

Solana (SOL) could surge more than 2,000% in the coming months, based on favorable chart technical signals.
Dubbed the “Ethereum killer,” the coin has surged more than 2,000% since hitting a cycle low of around $10 in November 2022. In doing so, its price trend has formed a cup-with-handle pattern on the weekly chart, as spotted by veteran analyst Peter Brandt.
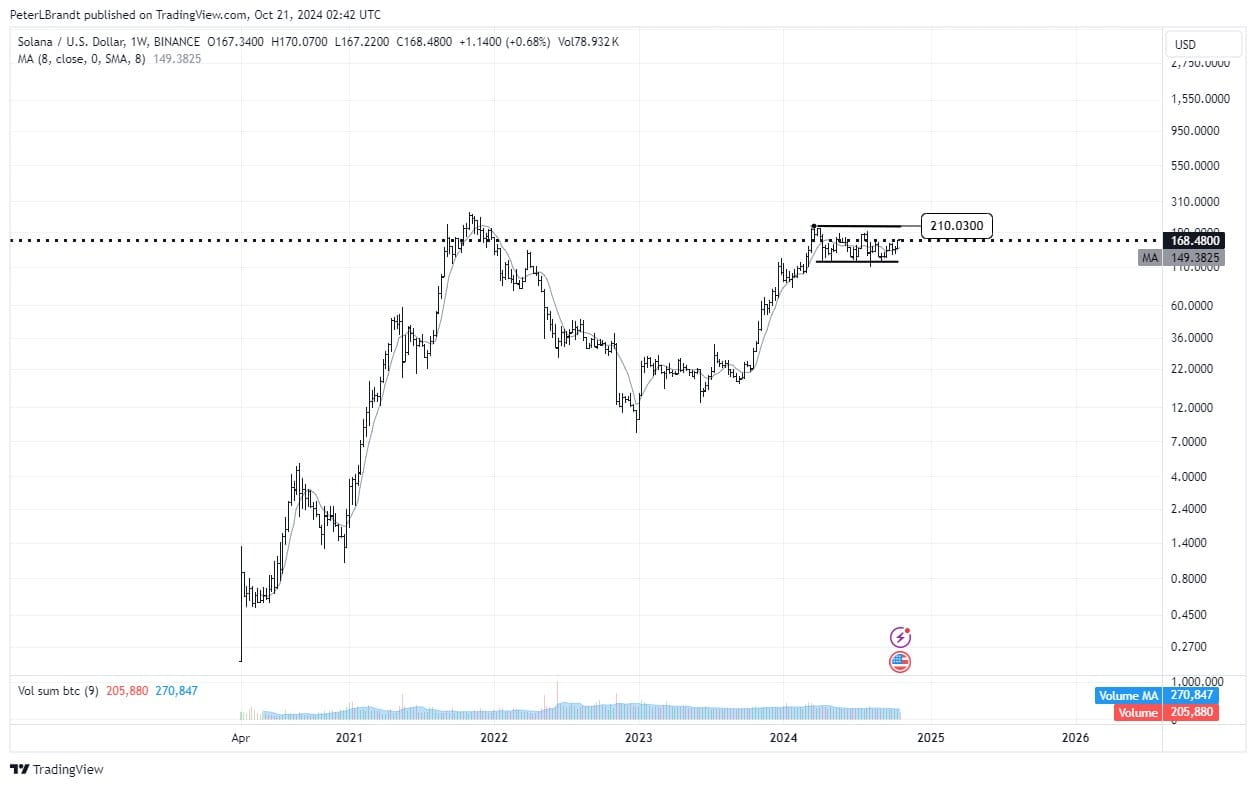
SOL/USD weekly price chart. Source: Peter Brandt
Solana in its final potential boom phase
A cup with handle pattern develops when price makes a U-shaped rally, resembling a “cup”, followed by a consolidation period, resembling a “handle”.
Typically, the handle signals a moment of indecision as traders assess whether the uptrend will continue. That seems to be the market sentiment recently, with SOL consolidating in a $100-$200 trading range since March 2024.
According to technical analysis rules, the cup with handle pattern is usually identified when the price breaks above the common neckline resistance level ($205 in the case of SOL) and rises by the maximum distance between the bottom of the cup and the neckline.
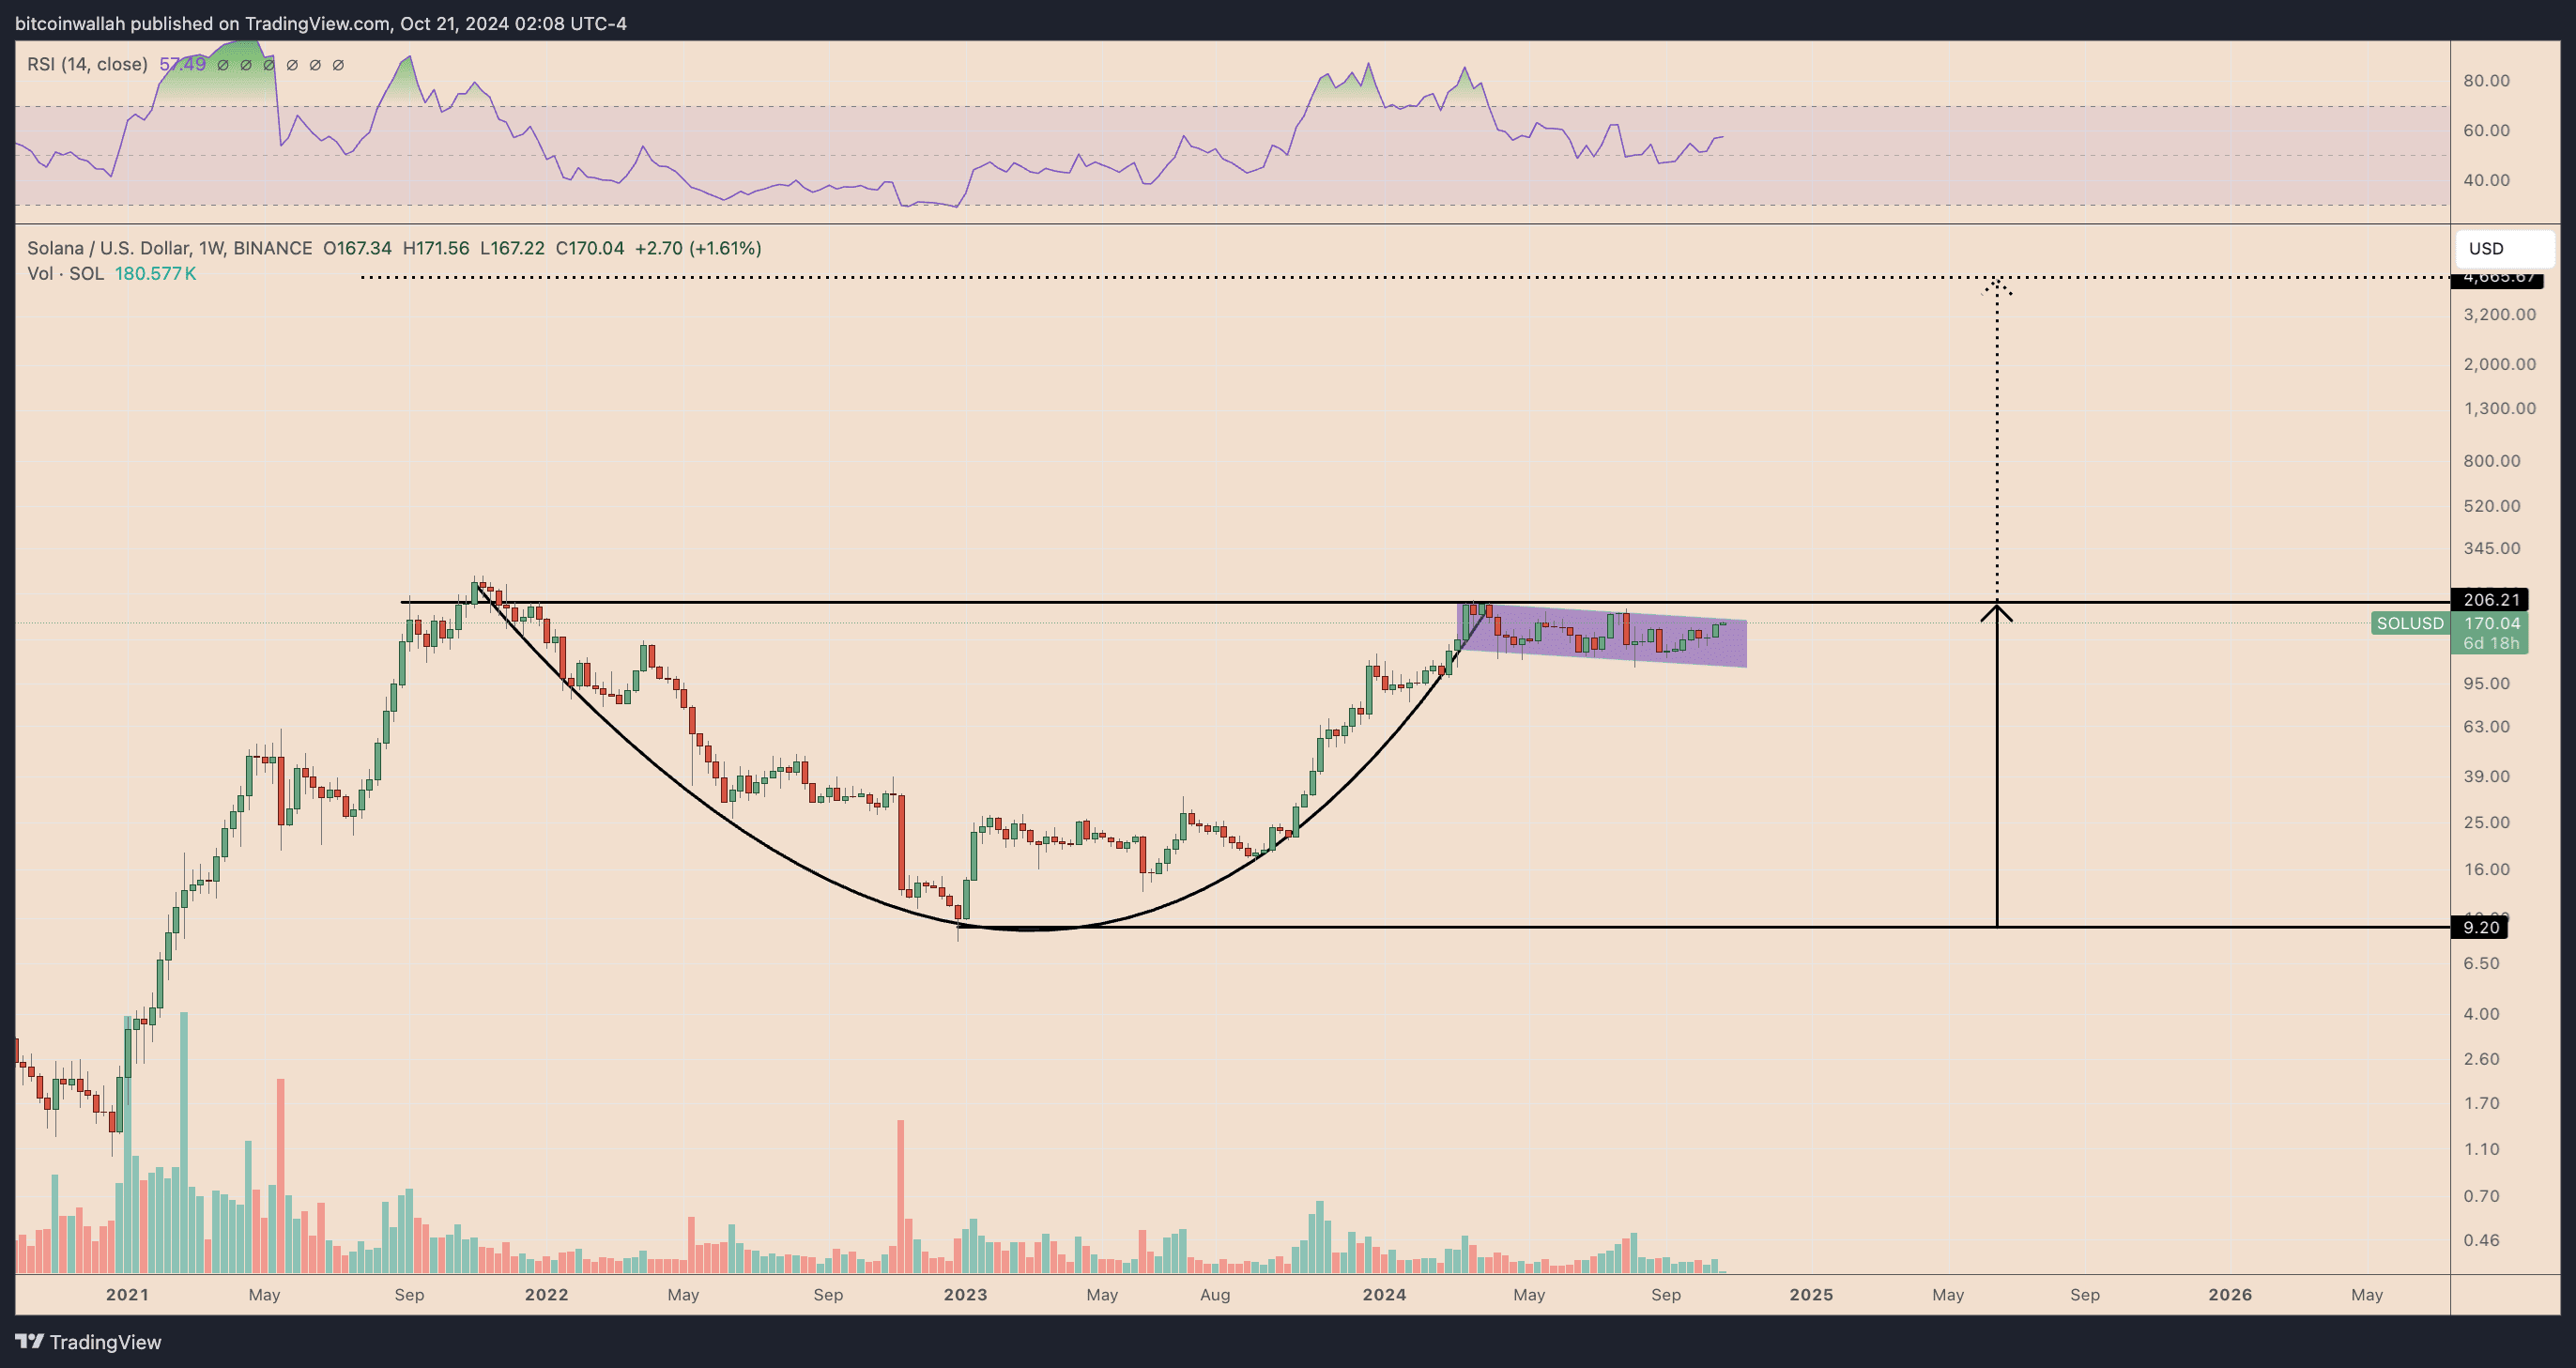
SOL/USD weekly price chart. Source: TradingView
This brings SOL’s cup-handle breakout target for 2025-2026 to around $4,500, representing an increase of more than 2,000% from current levels.
However, it is important to consider the historical probability of the cup with handle pattern.
For example, a study by veteran analyst Thomas Bulkowski, who analyzed 913 cup-and-handle trades in the stock market, found that only 61% of these structures achieved their intended target.
In other words, the cup with handle pattern does not always guarantee a complete bullish move.
Post-halving “altseason” could boost SOL price
Many of the potential bullish indicators for Solana stem from hopes of an altcoin season (or altseason) that has historically followed Bitcoin halving events.
For example, the altcoin market consolidated sideways for two months after the Bitcoin halving event in May 2020, then exploded to rally more than 1,950%. During the same period, the price of SOL increased by more than 49,360%.
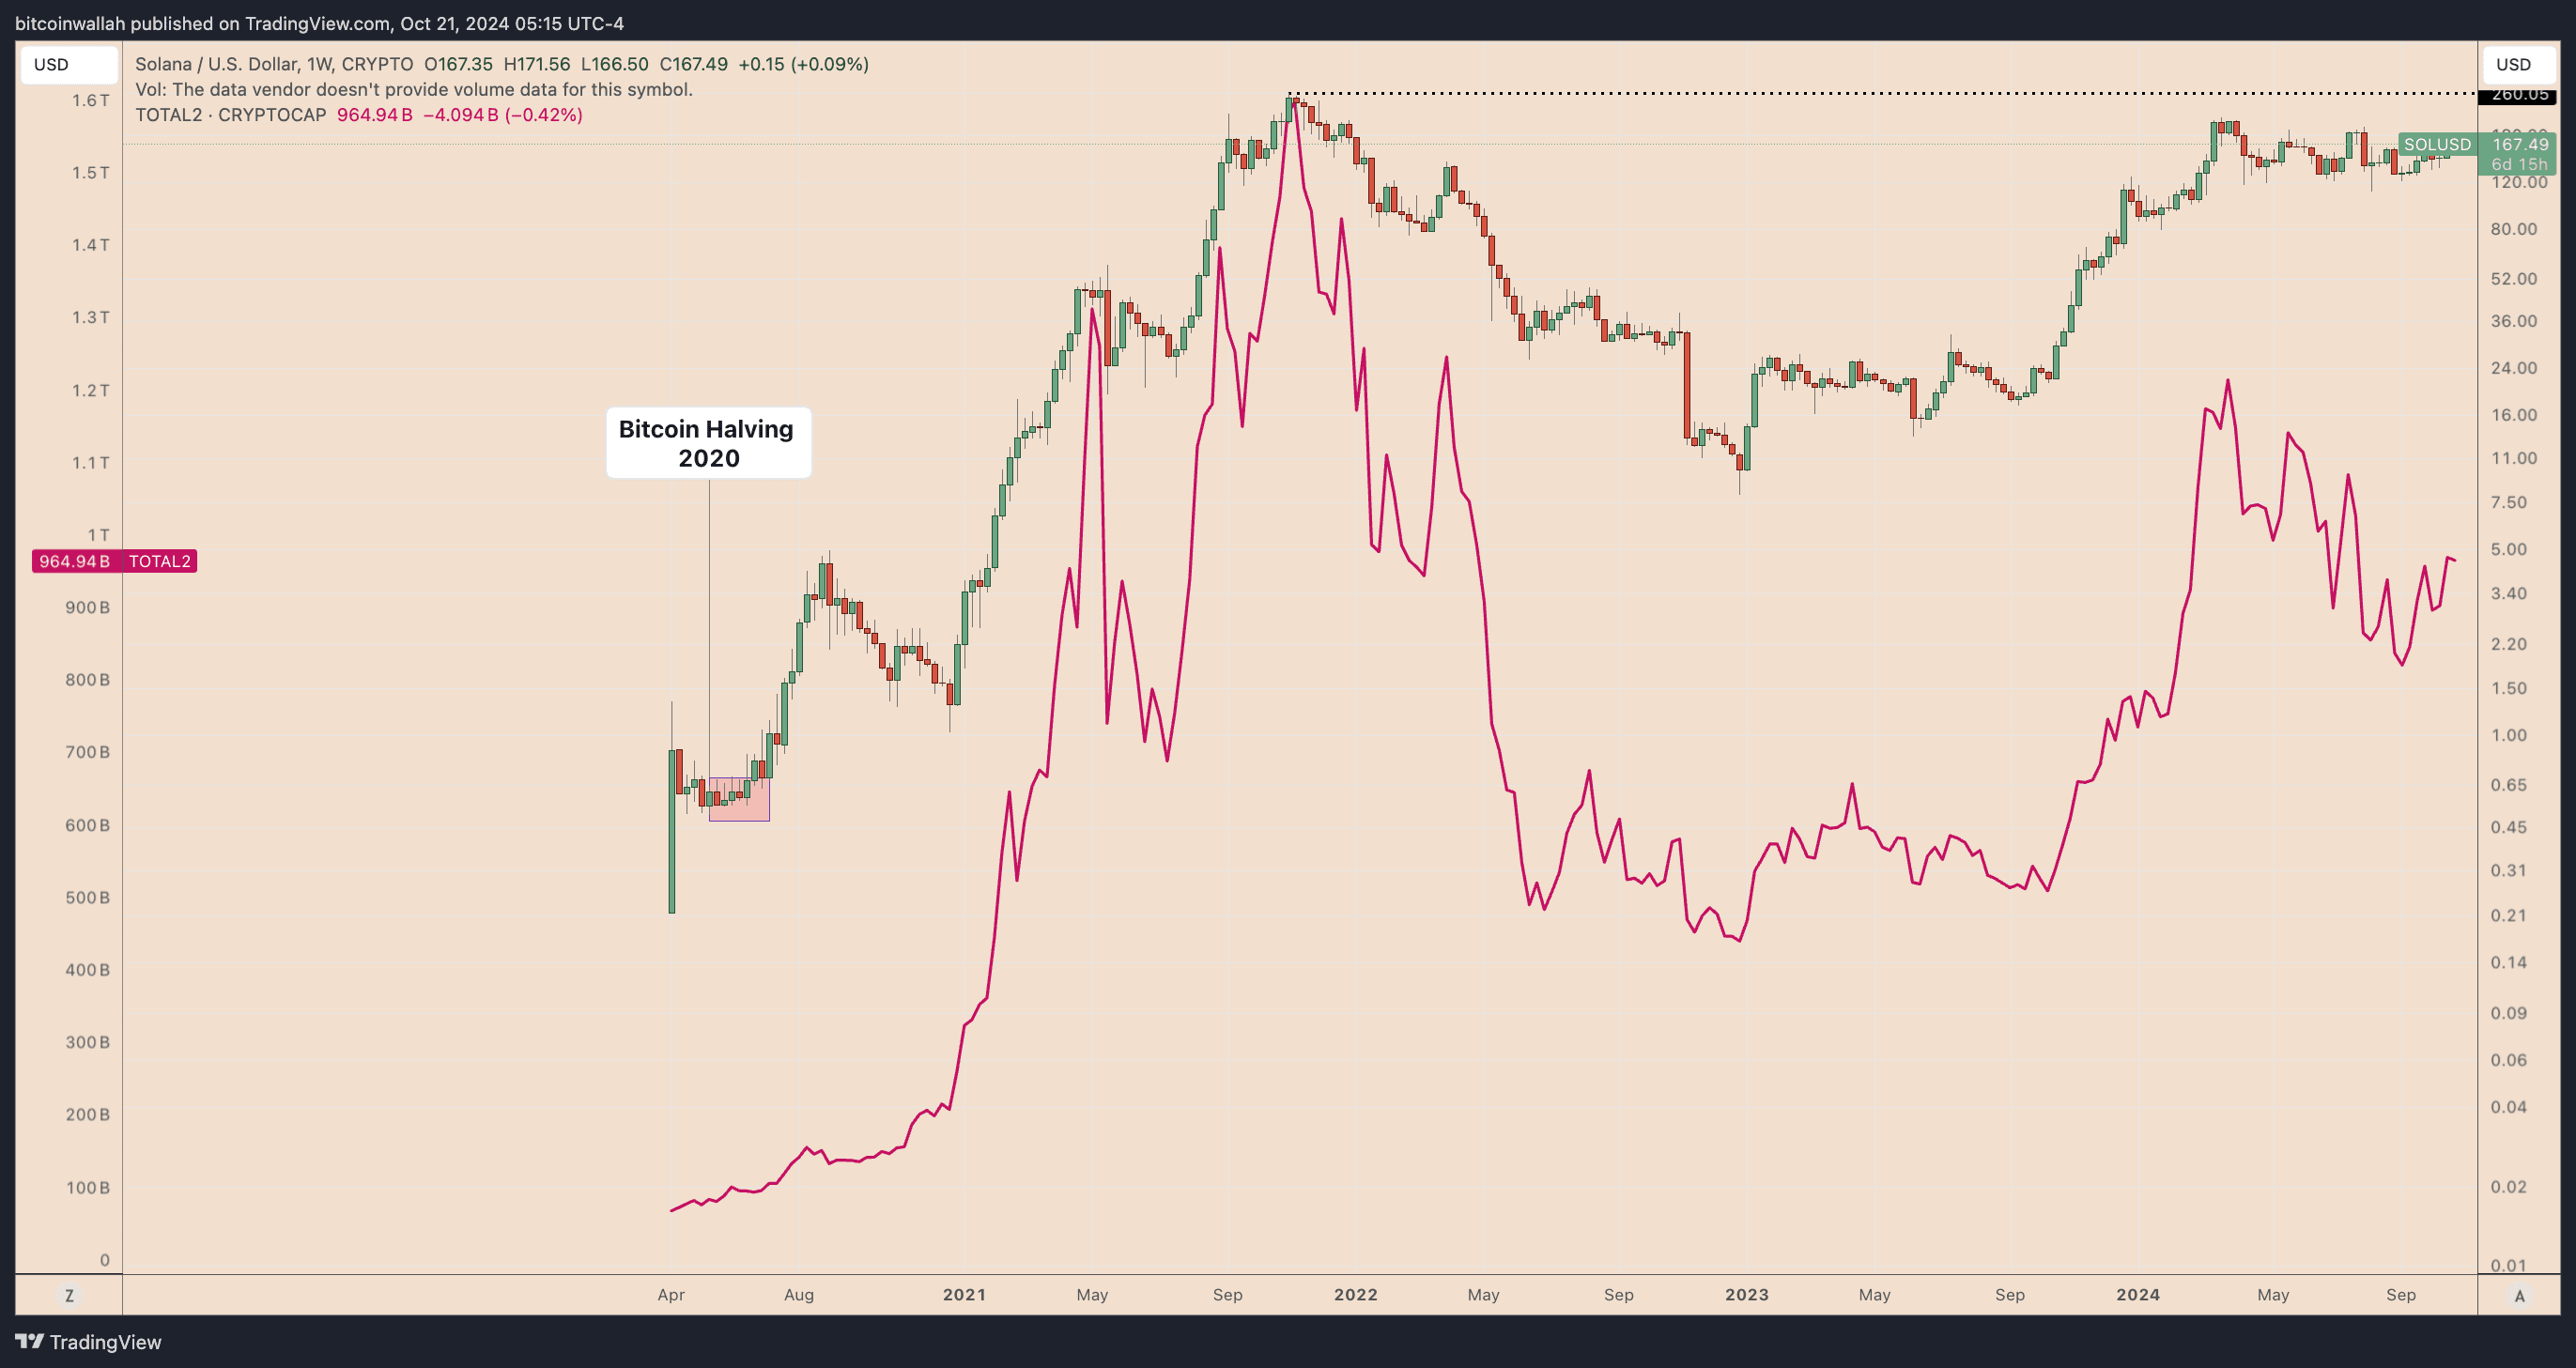
SOL/USDT weekly chart vs altcoin market. Source: TradingView
A similar altcoin market boom took place following the Bitcoin halving events in 2016, although Solana did not exist at the time.
History shows that after Bitcoin halving events, traders often shift their attention from Bitcoin to altcoins.
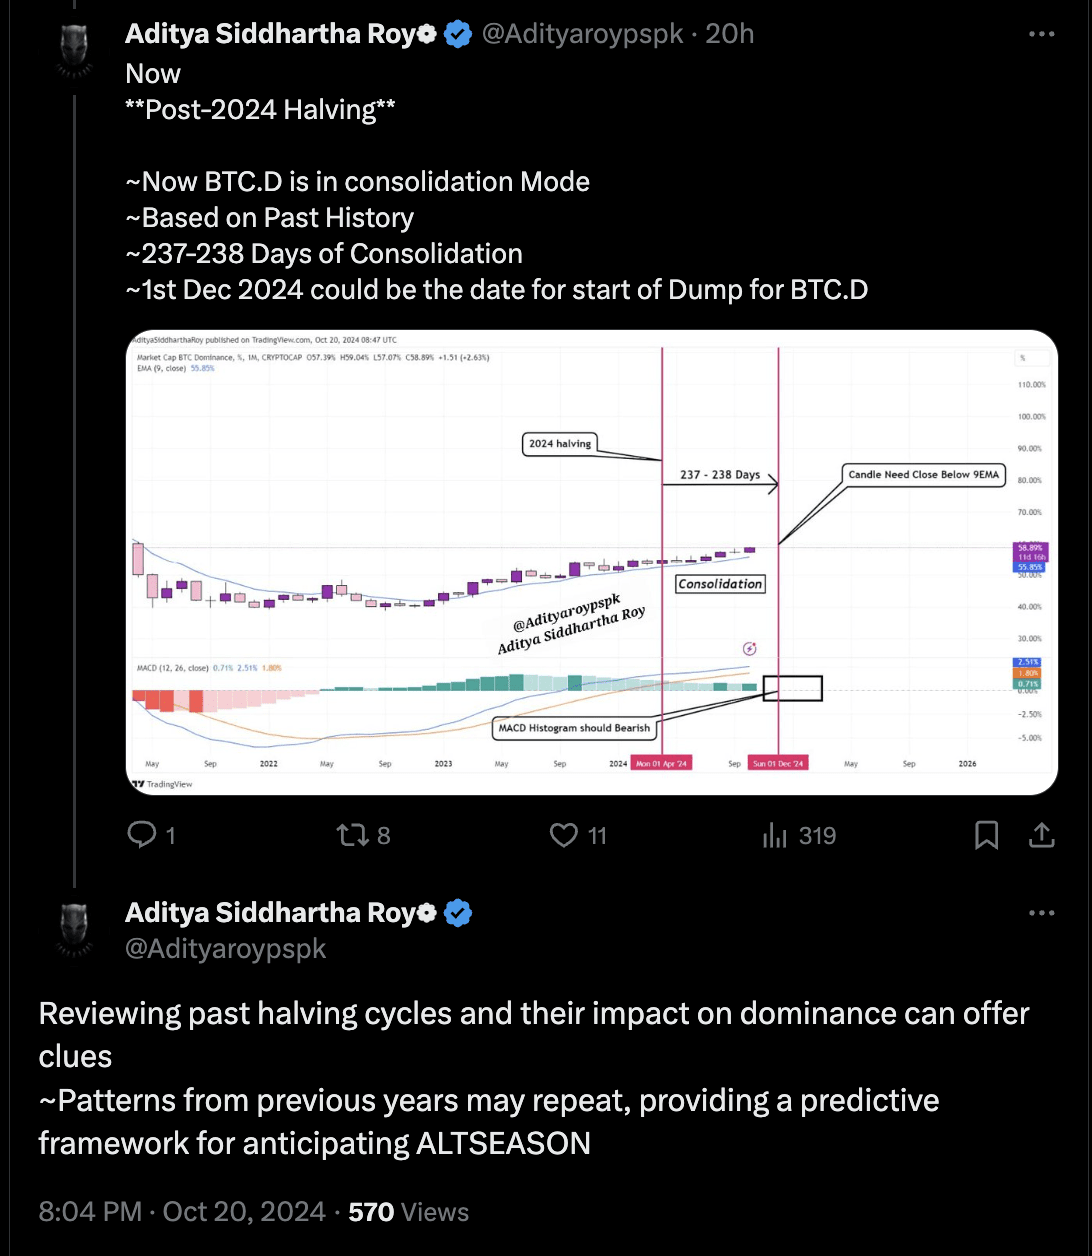
Source: X
Once Bitcoin has risen, the potential for higher percentage gains may become limited, especially for traders looking for larger returns. As a result, attention shifts to altcoins — assets with smaller market capitalizations that are more volatile but can provide higher percentage returns during bullish phases.
#tintucbitcoin #Write2Win #MarketDownturn #BinanceTurns7 #IntroToCopytrading $BTC $ETH $SOL


