
1. The Economy of the United States
1. DXY Dollar Index
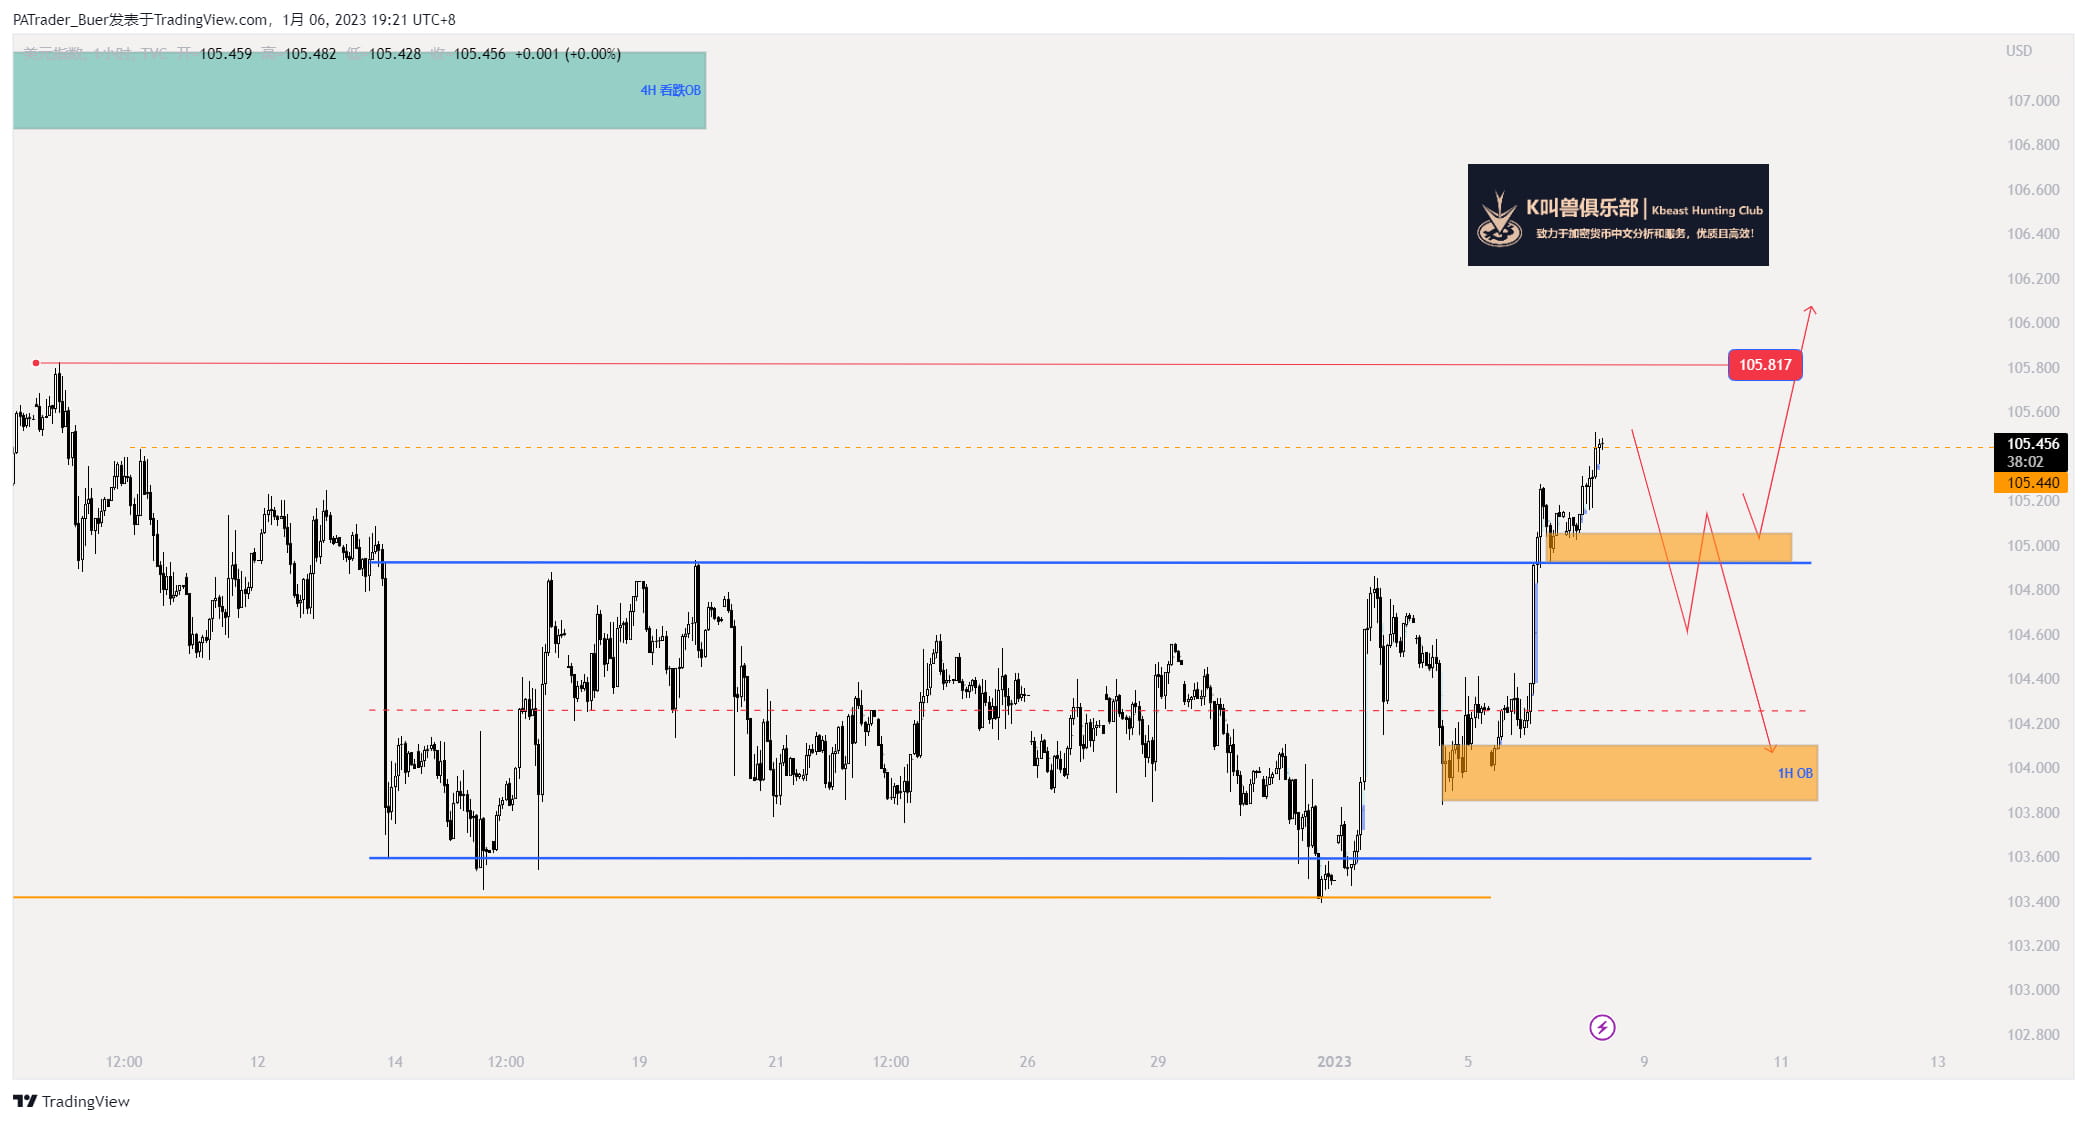
Hourly chart
Hourly order flow is upward. After stepping back to range-H 104.93, it continues to move upward and has now broken through the upper edge of the 1H OB hunting at 105.456.
Here, we can see the test of 105.817 upward. If it breaks through here, the daily CH order flow is upward, and the target can be seen at 108. But it is very slow to move upward, and there is no sign of waterfall in the EU euro at present, so it is almost the top here for the time being.
If there is a pullback here, we will see the test of range-H. If it falls below here, it will be a bearish QM structure, and it may test the 1H OB of 104 downwards. If range-H holds, it may continue to rise (very strong). Pay attention to the non-farm data and unemployment rate data tonight. Looking ahead, the job market is much hotter than expected, new jobs are higher than expected, and the number of people receiving unemployment benefits has hit a new low. The rise of DXY in the past two days may be based on this.
2. SPX S&P 500
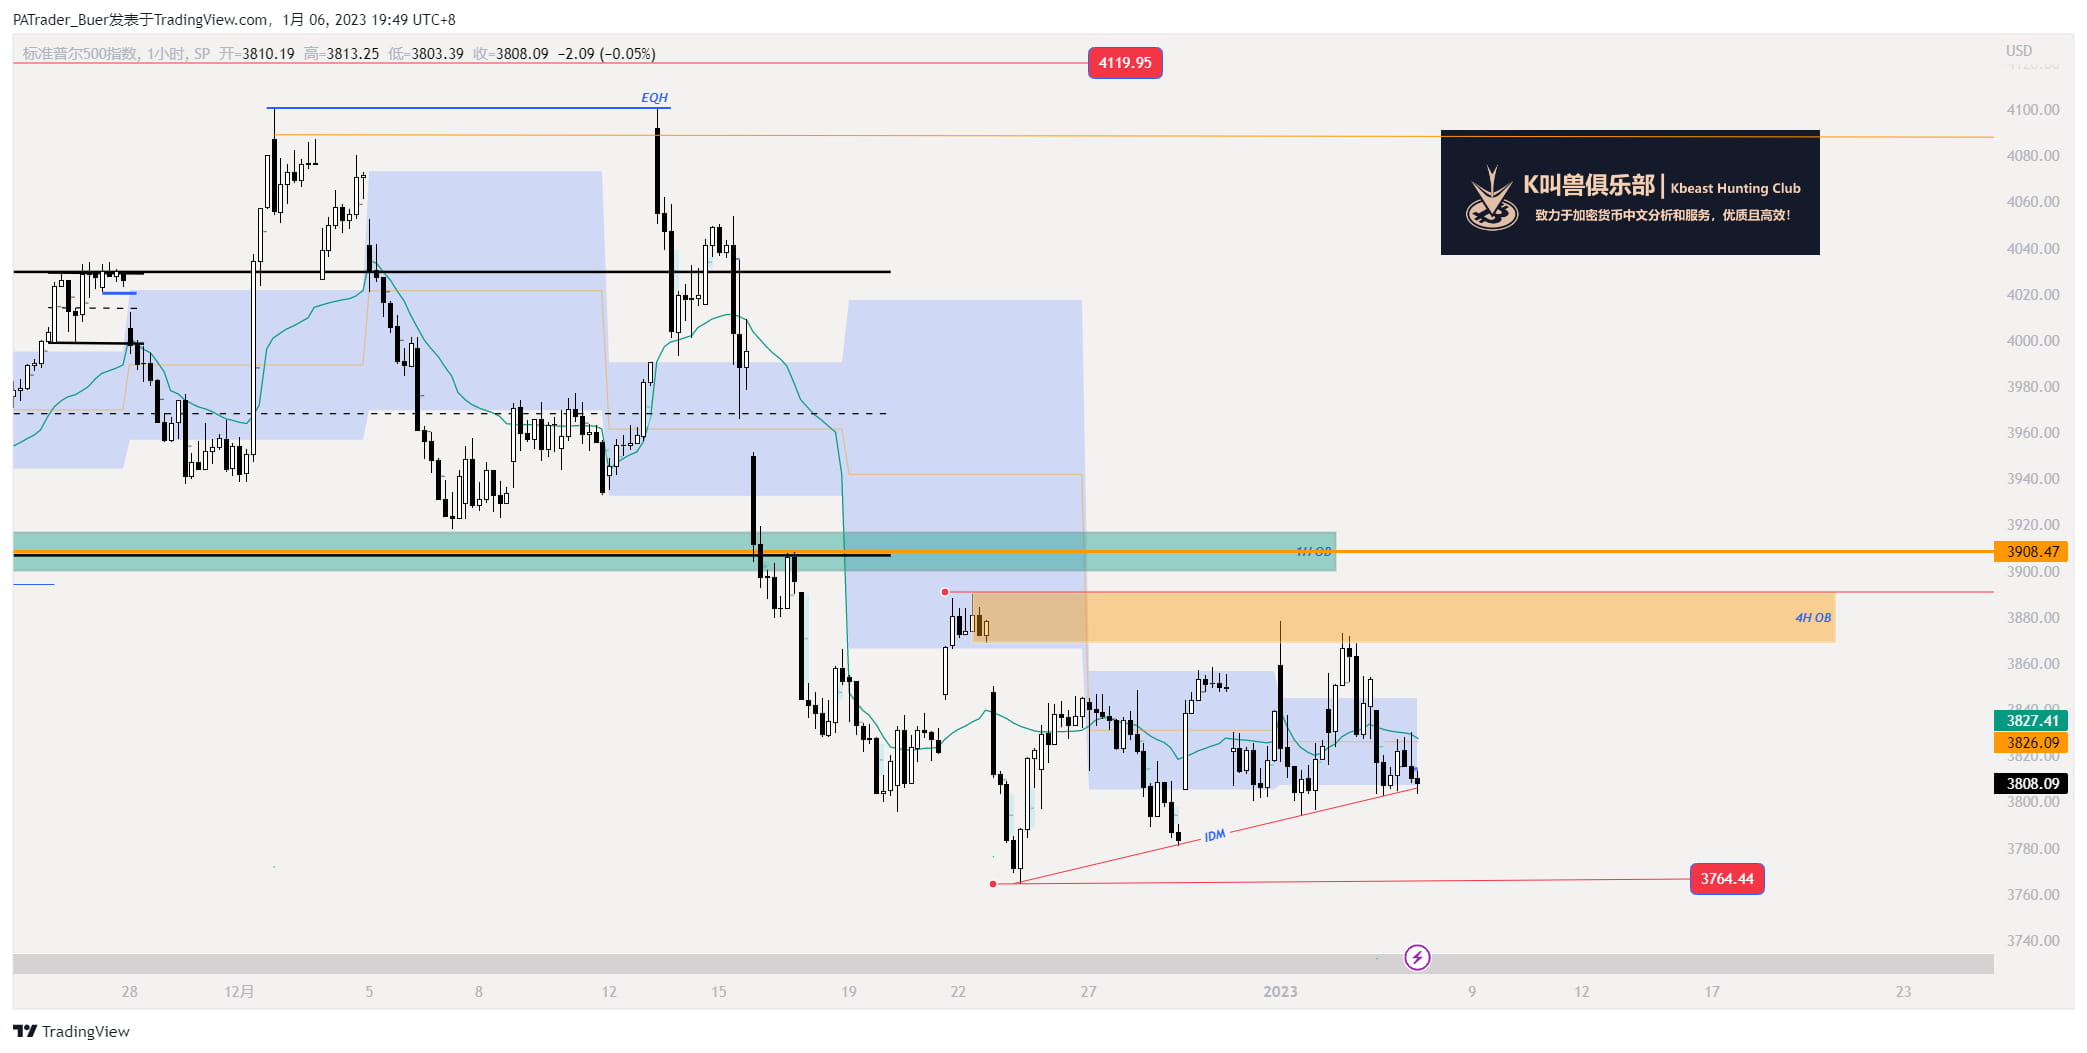
Hourly chart
Hourly order flow is downward. US stocks are already below the weekly VWAP, and this is also IDM. US stocks need to look at the data first, and then look at the direction after the opening. If it is downward, look at the test of 3764 SSL, and if it is upward, look at the test of 4H OB.
3. ES1! (S&P Futures)
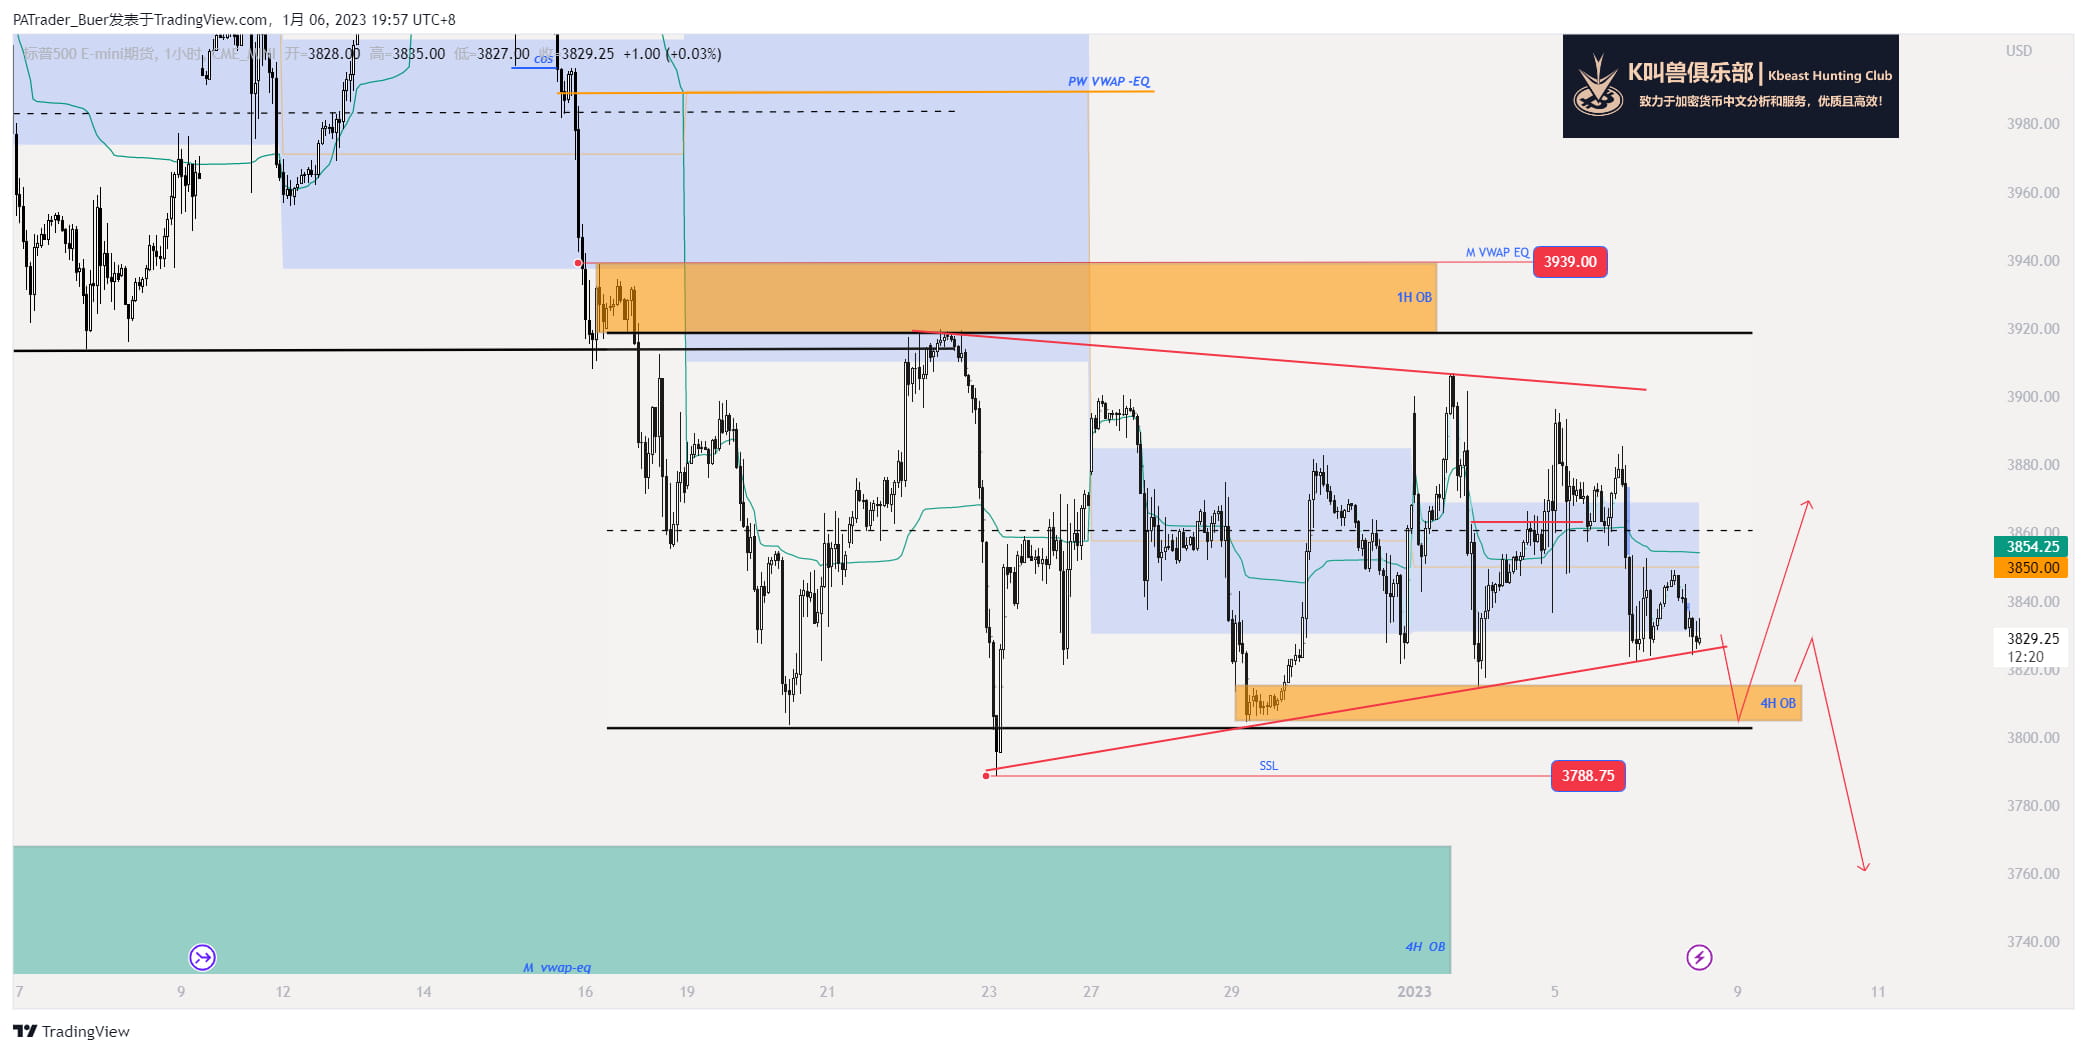
Hourly chart
Hourly order flow is still oscillating around 3802-3919, but it is currently in a convergent triangle state. It has been oscillating at the lower edge of the weekly VWAP value range for a day. Waiting for the data to be released to see whether it will directly fall down to test 3788, or test the upper edge of the weekly VWAP value range of 3873 after 4H OB obtains liquidity.
2. BTC

Hourly chart
4H order flow is upward.
It can be seen that after the pin breaks through range-H to the monthly VWAP value range EQ, it falls back to range-EQ. Here, I first look at the test of the lower edge of the monthly VWAP value range 16656, which is the 4H OB. If it does not break here, it is still possible to test BSL upward again. If it falls below here, the target will first look at range-L, and then look at SSL.
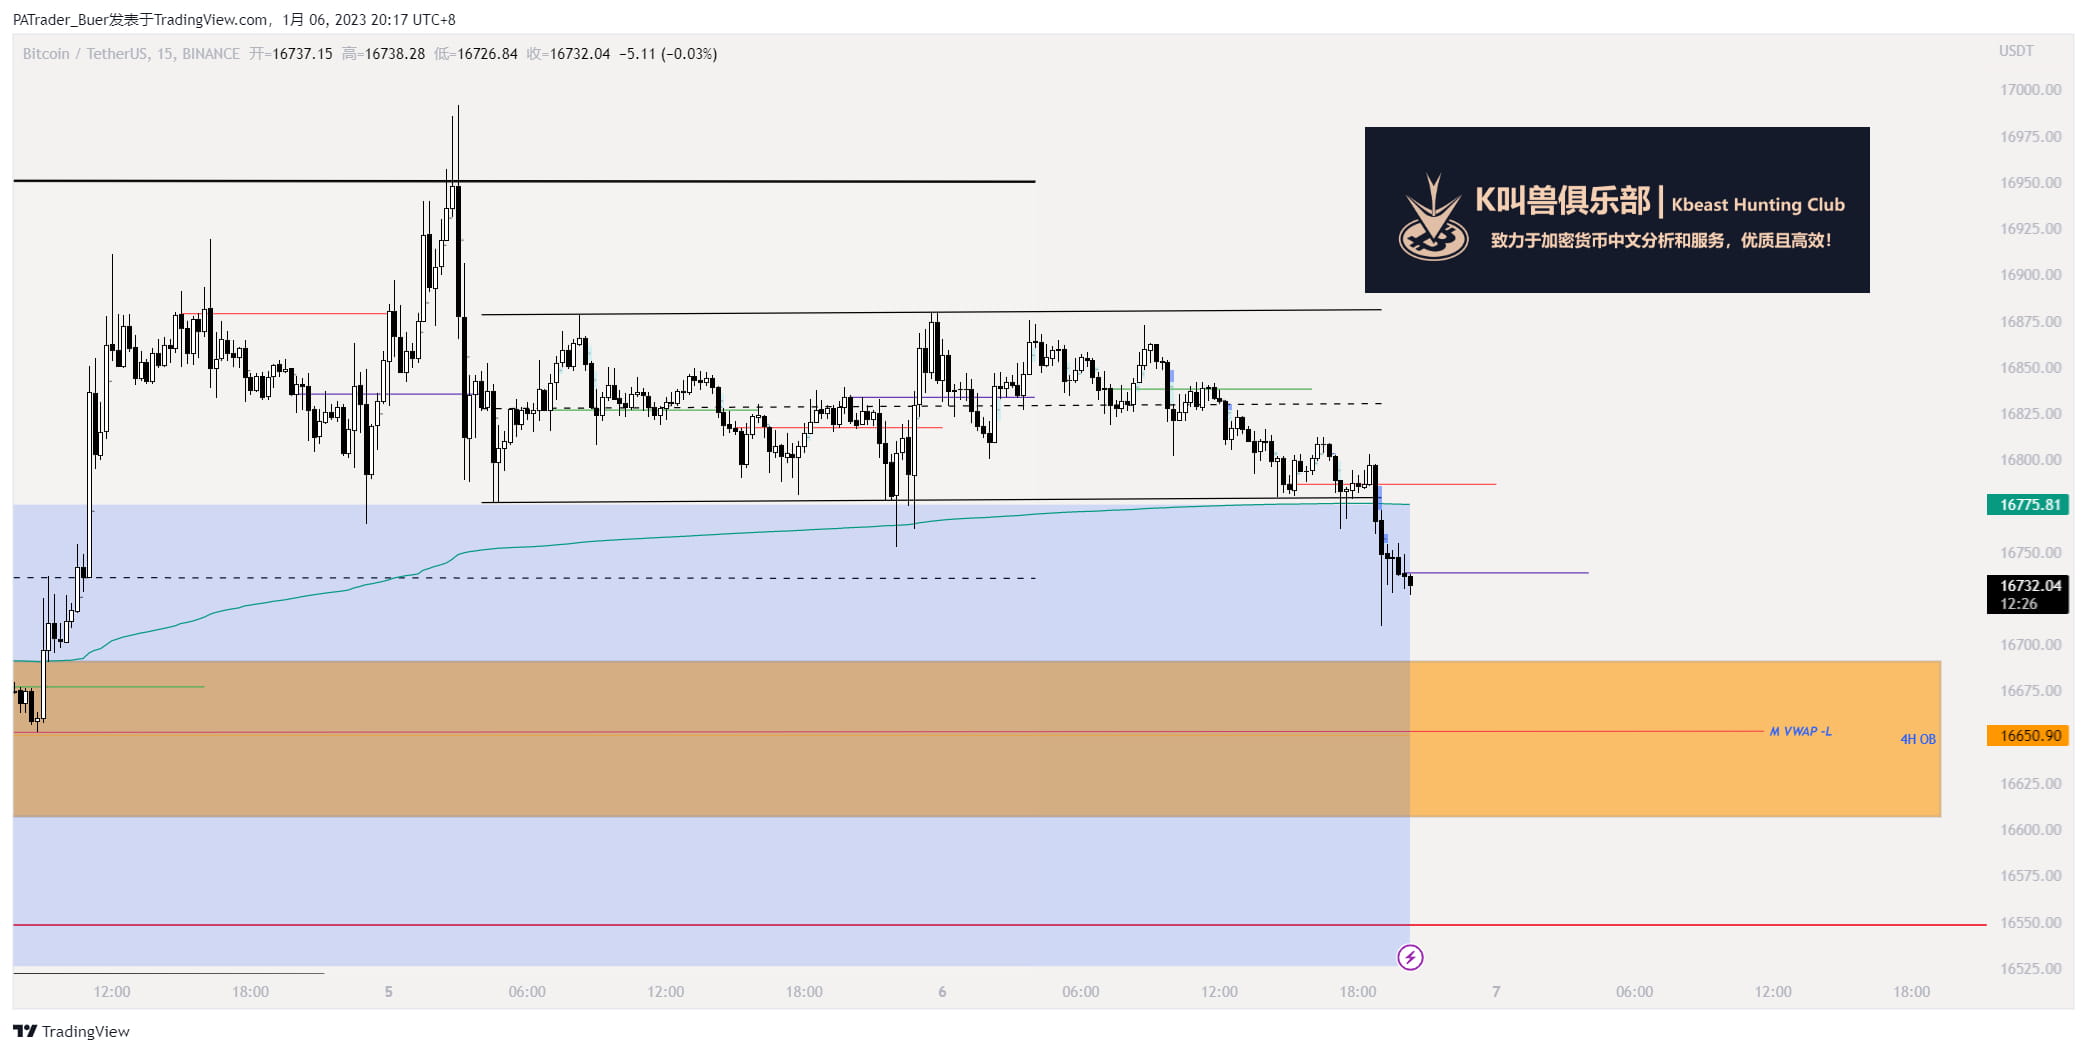
15F Chart
The 15F order flow is downward. The range-H here did not break through in the morning, and then it continued to fall, falling below the upper edge of the weekly vwap value range.
Here we also look at the test of the value range EQ, which is also at the position of 16656.
ETH
Hourly chart
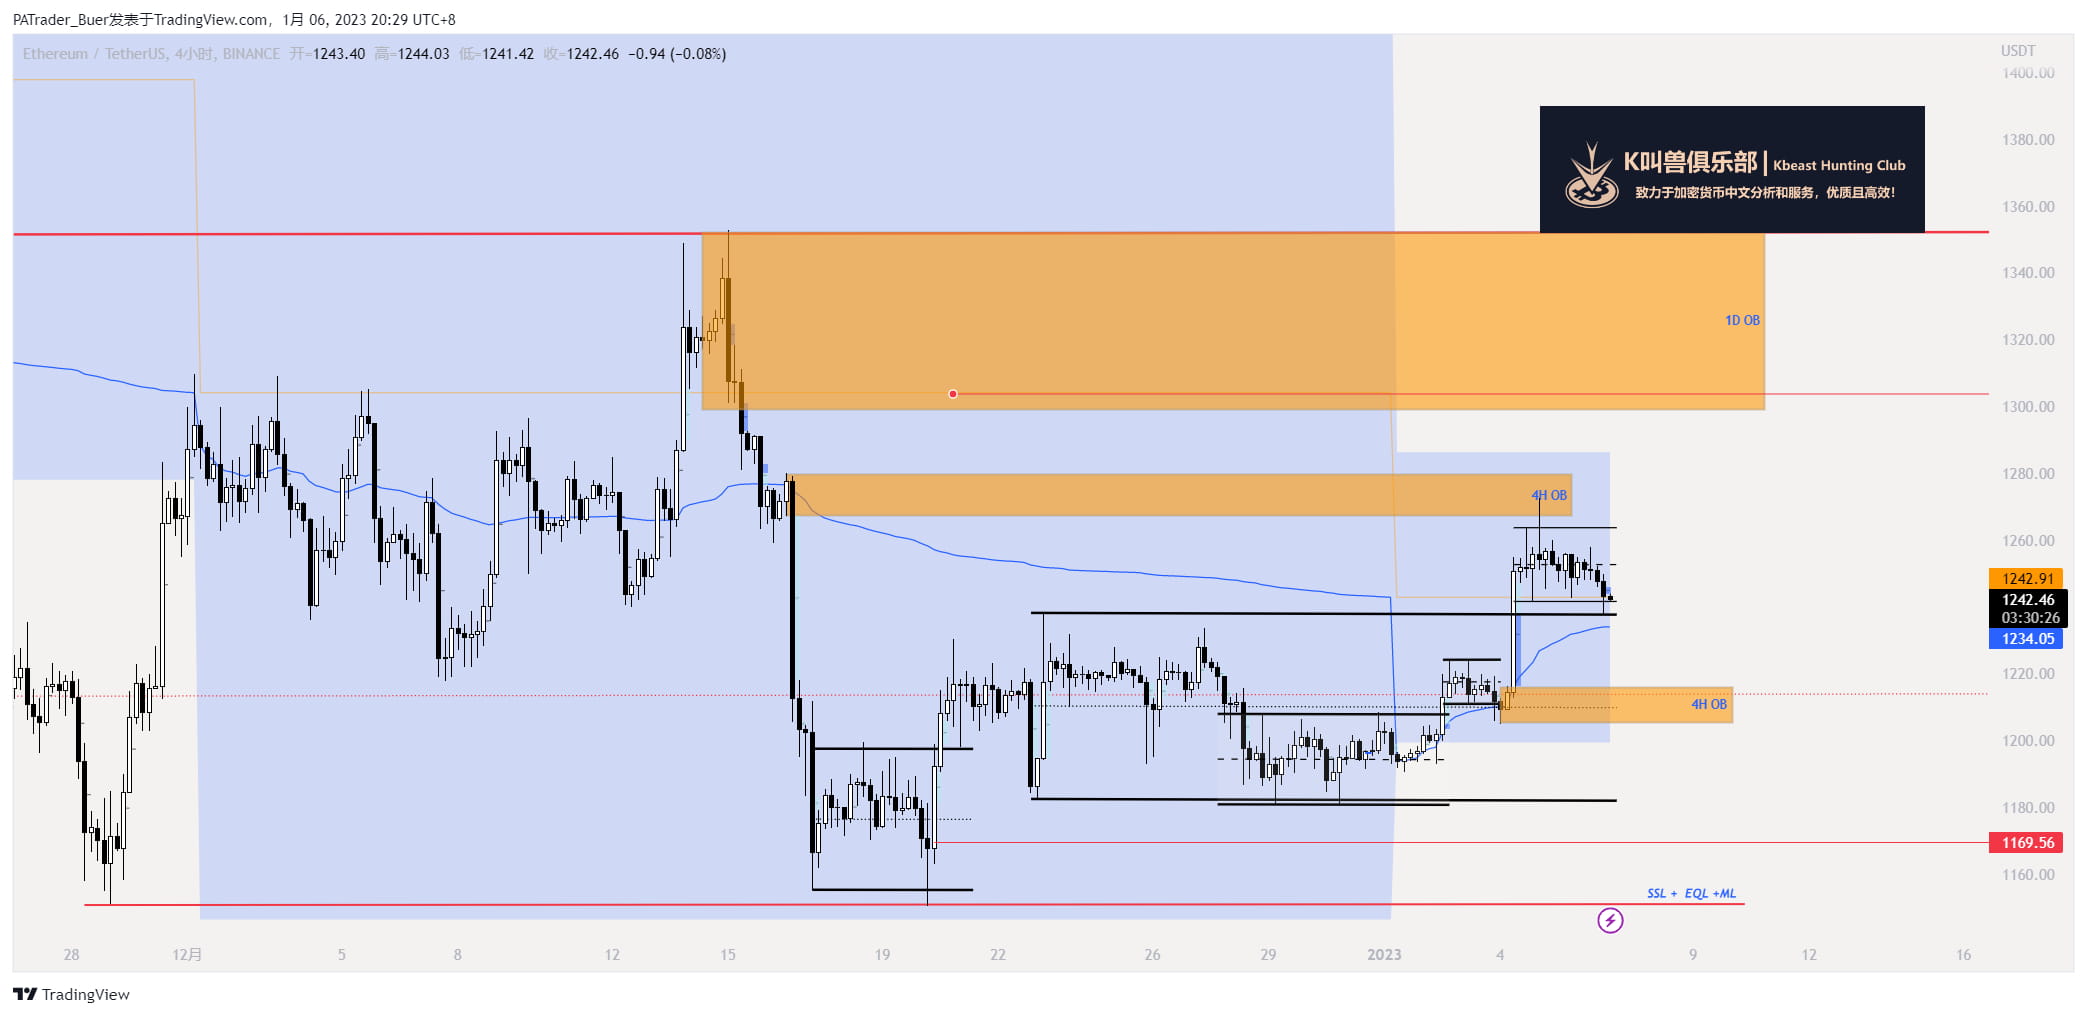
4H order flow is upward. You can see that ETH inserted the 4H OB upward and then inserted the range-H (1237) downward after obtaining liquidity. This is also the monthly VWAP value range EQ. Look at the support strength here. If it holds here, or hunts a little, then look at the upper edge of the value range 1288. If it can't hold here, it may have to test the 4H OB. It also holds here, and it continues to rise. If it falls below, first look at the hunt for 1181EQL.
15F Chart
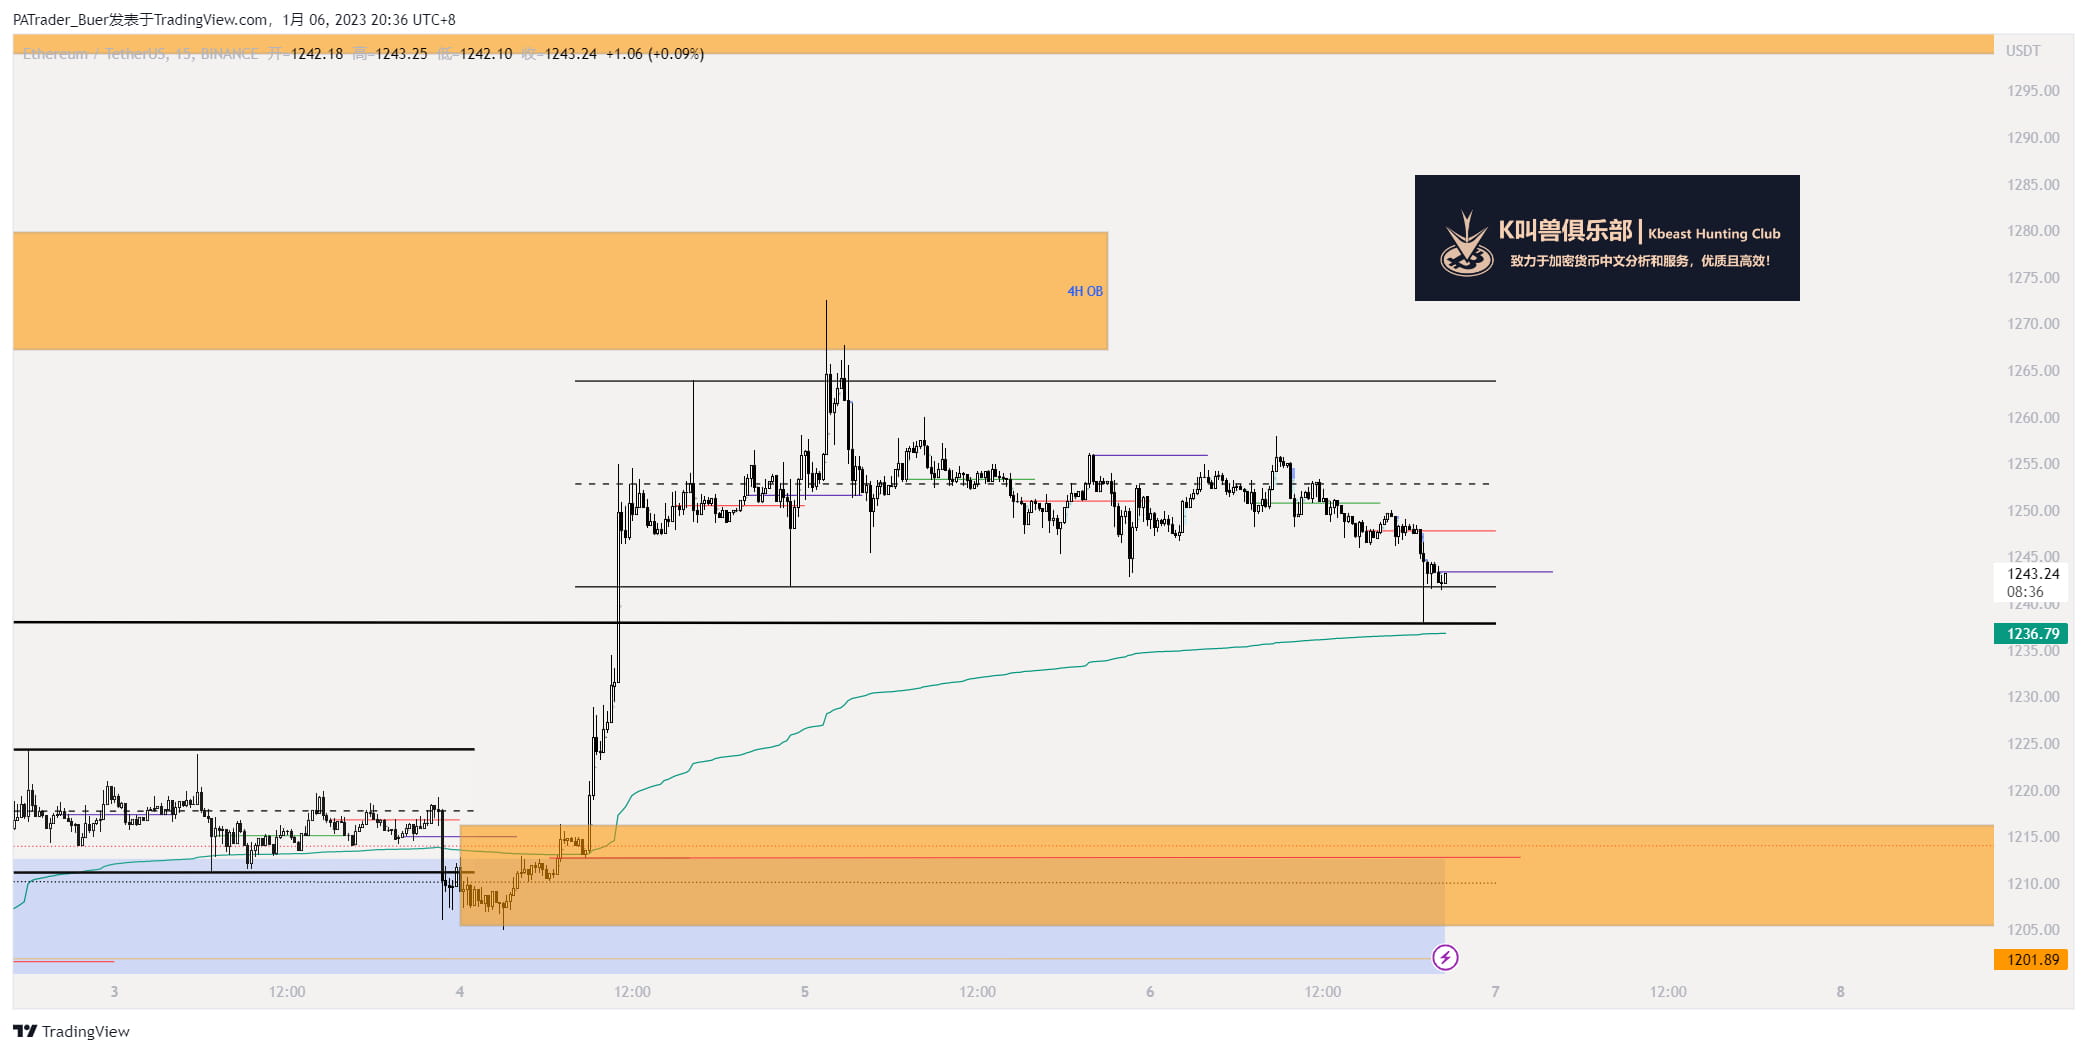
15f order flow is downward. ETH is not bad at the moment. After the pin test 1237, it returned to the range. Here, after the upward pin, the downward pin was used to obtain flow. Let's see here. As long as it stands firm, there is still a chance to test 4H OB upward.