


Smart Money Strategy is a method of analyzing the behavior and movement of "smart money" or large capital, which is operated by large market participants (popularly known as Whales - large banks, hedge funds, institutional investors, and other large institutions). It is used in all markets - stock, currency, cryptocurrency, etc.
Large players can influence pricing or even manipulate the price of certain assets for personal gain because they have huge capital under their control.
The essence of the Smart Money concept: there are large and small participants in the market (popularly known as the "crowd" or "hamsters"). A large player always acts against the thinking and expectations of the crowd. Playing on the emotions (FOMO) of small traders, he moves the market in the direction he needs and in his interests. The Smart Money strategy will teach you to identify and understand the actions of a large player and think like a large player, and he always makes money on the market.
A whale needs equally huge liquidity to fill its order-application with a huge volume, and this can take a long time. Therefore, in order to collect the necessary liquidity, Whales hunt for the liquidity they need and resort to various tricks for this, which SM helps to identify.
Classic Tech. Analysis (TA) and Smart Money - what's the difference?
To tell the truth, Smart Money is technical analysis, only it is based on candlestick analysis. This strategy allows you to look at what is happening on the market from a completely different angle.
Usually in practice, small participants (the crowd) use patterns of classical technical analysis (figures, formations, indicators, etc.), which in most cases do not work, which leads to the drain of their deposits.
Have you seen how a beautiful and technically correct bullish/bearish triangle breaks in an "illogical" direction? Or how strong support/resistance, from which a 100% reversal was expected, turns out to be impulse-broken with a subsequent sharp return to the original? They put out "hamster" Stop orders and continued what they started, this is a classic.
A major player understands the psychology and thinking of the crowd, specifically drawing for it the formations that it wants to see. The result is one: the overwhelming majority of small participants lose their assets. Classic Technical Analysis is an opportunity for the necessary manipulations of a major player. That is why 95% of the crowd ends up with nothing.
Here are some examples:
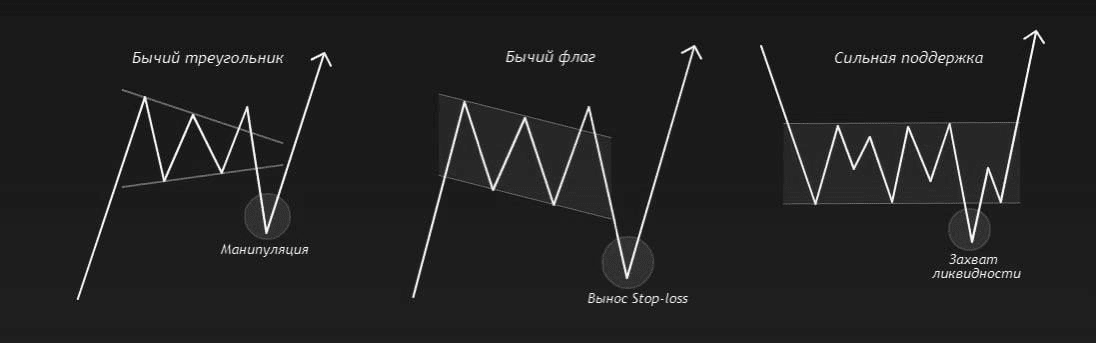
This is what manipulation by a major player looks like
Market structures
In total, the market has 3 structures: ascending (bullish trend), descending (bearish trend) and sideways movement (flat/consolidation/range).
Determining the current structure is the basis of analysis and the foundation for making any trading decisions. In other words, it is a trend, whether short-term, medium-term or global (long-term).
Now let's look at all the types in more detail:
· Ascending structure (HH+HL) – sequential renewal of highs with increasing lows (without renewal). Higher Hihg+Higher Low.
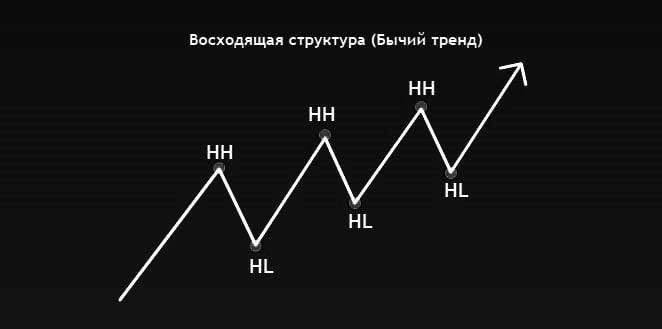
Bullish trend
Descending structure (LH+LL) - sequential renewal of minimums with decreasing maximums (without their renewal). Lower Hihg+Lower Low.
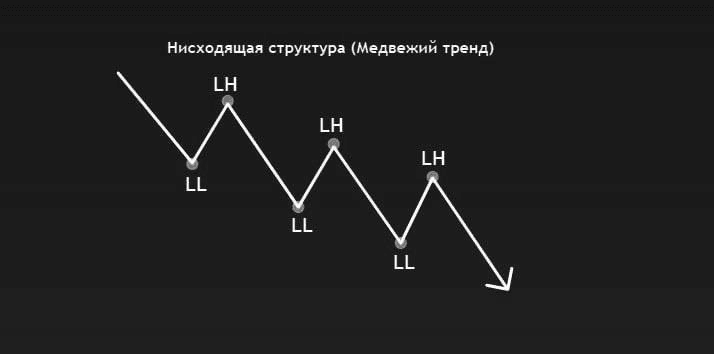
Bearish trend
Sideways movement (flat/consolidation/range) - market movement without a specific direction in one direction or another, without a clear trend. Usually looks like a parallel channel with fluctuations between internal highs and lows. There is a balance between purchases and sales.
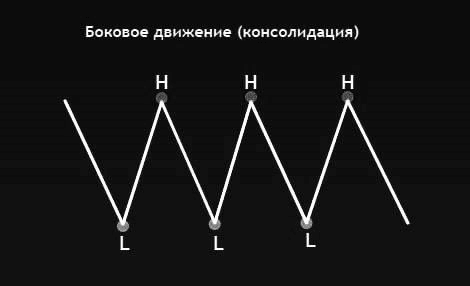
Outset
In most cases, such a consolidation period occurs when a major player gains a position or when interest in the asset falls. Due to the sideways movement, the whale receives the liquidity it needs.
Below we will look at a clear example of a sideways movement using the Fibonacci grid, where 1 and 0 are the highs and lows of the trading range, and 0.5 is the middle of the range.
The main task of a major player is to capture (collect) liquidity outside the trading range in order to gain a position more quickly.
Going beyond the range is called Deviation (Latin: deviatio - deviation).
The formation of a Deviation is very often a signal for the price to reverse in the opposite direction and return to the borders of the sideways trend.
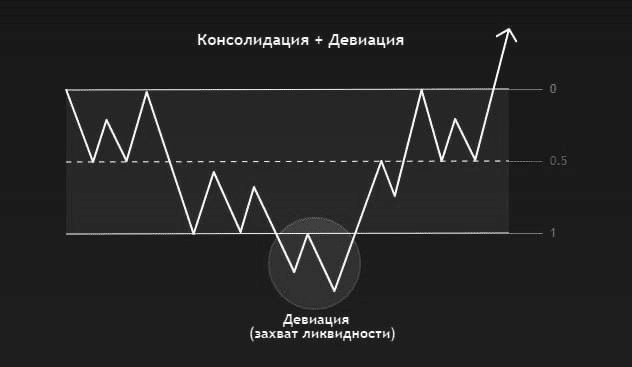
Deviation
After identifying the Deviation, you can enter the position on a sharp price exit beyond the range and the first attempts to return back. Stop-order for the wick formed on the impulse breakout. Or already when the price returns to the borders of the side corridor.
Structural SWING reversal points.
At Swing points, the moment of price reversal occurs, they are divided into:
Swing high - consists of three candles. The main candle (central) has the highest maximum and 2 adjacent candles with lower maximums (mandatory). Reversal down.
Swing low - here it is the opposite, the Main candle (central) has the lowest minimum and 2 adjacent candles with higher minimums. Reversal up.
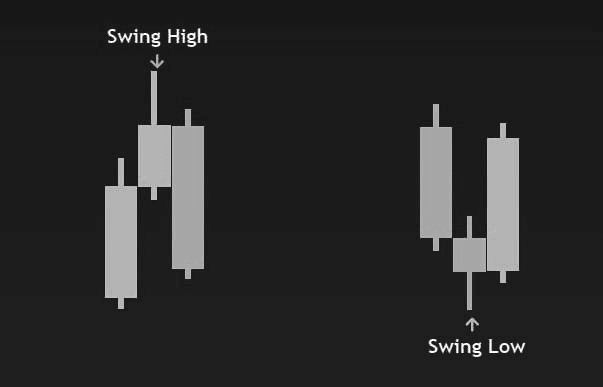
Swing
Breakdown of the Structure
As we have discussed above, trend movement can be ascending (updating maximums without updating minimums) and descending (updating minimums without updating maximums), but how can we understand when a structure breakdown occurs? This is a very important point.
Break Of Structure(BOS) - updating the structure within the trend. Updating the maximum on an upward trend and updating the minimum on a downward trend.
Change of character (CHoCH) - change in the trend direction of the market.
The first BoS after CHoCH is called Confirm and it confirms the trend change.
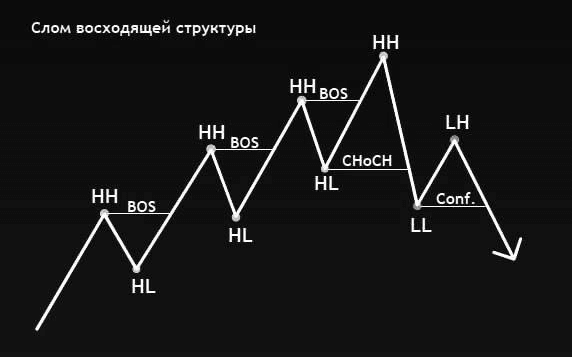
Breakdown of the top-down structure
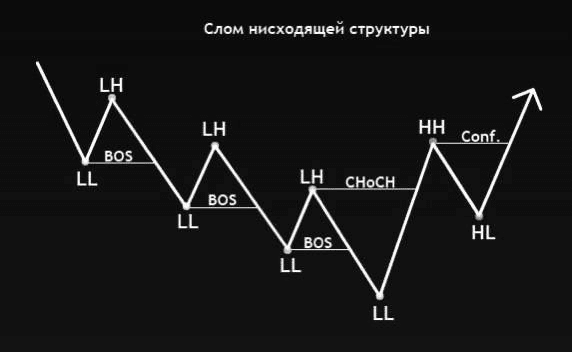
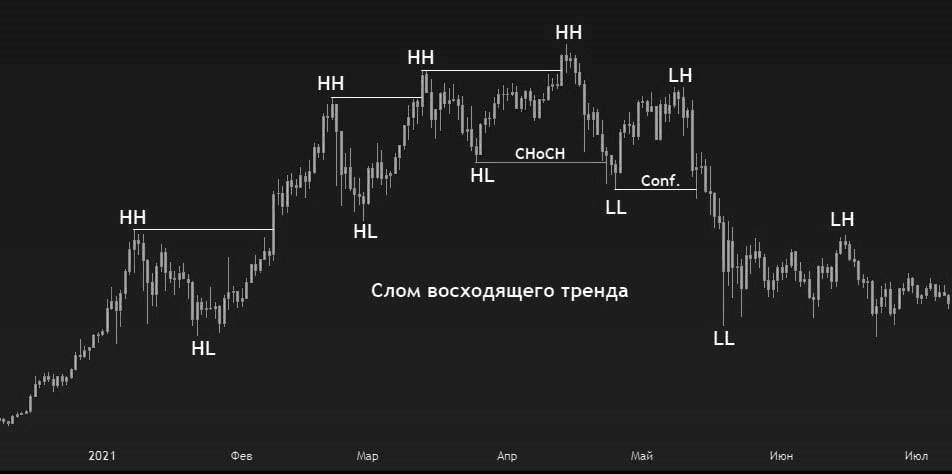
Structures are divided into primary and secondary.
· Primary - senior timeframes (1W, 1D, 4h). This is the main trend.
· Secondary - lower timeframes (1h, 15 min, etc.). They occur within the primary structures.
Within the primary ascending structure there are secondary descending ones (corrections of the trend movement), and vice versa, within the primary descending structure there will be secondary ascending ones.
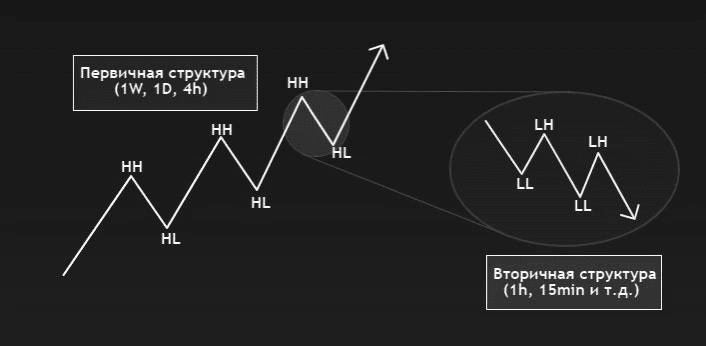
Structures
Optimal trading means trading with the trend. Without the necessary experience, trading against the trend can be dangerous. It is possible to "catch" corrective movements, but very carefully.
To find a more profitable entry point into a position (either Short or Long), you should go down from higher Time Frames to lower ones (1d-4h-1h-15min). The structure will be approximately the same everywhere. If all conditions are met on each TF - we act!
Liquidity
Liquidity is the main element of the Smart Money strategy. It is the "fuel" for a major player, with the help of which he carries out the necessary actions and moves the market in the direction he needs.
In practice, liquidity for a whale is provided by Stop orders of smaller market participants, which are usually located behind obvious support-resistance levels/beyond figure boundaries/beyond candle shadows, etc. By filling the Stop orders of the crowd, a large player gains his position to buy or sell (in practice, this usually looks like an impulse squeeze).
The largest accumulation of orders is located behind significant points of maximums and minimums (they are also Swing High and Swing Low, which we discussed above) - these are the so-called liquidity pools, which are what a large player hunts for.
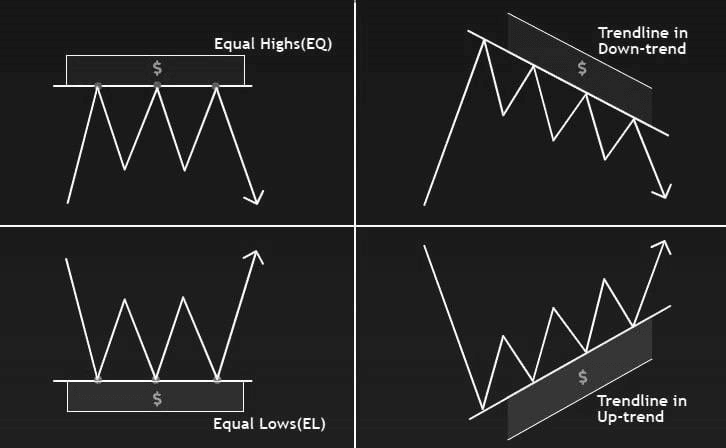
Liquidity $
In the case of equal (Equal) highs and lows (Double Bottom/Top), the removal of Stop orders/capture (collection) of liquidity occurs due to the renewal of the highs and lows of the previous Swing High and Swing Low by the shadow of the candle in the form of an impulse shoot.
In the Smart Money concept, this phenomenon is called SFP (Swing Failure Pattern).
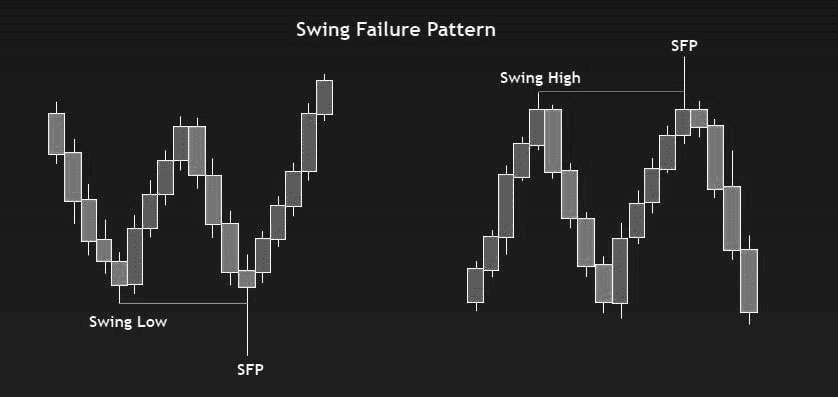
SFP
The most common use of SFP in trading is to open a position after the SFP candle closes, with a Stop order placed behind its shadow.
During a sideways movement (accumulation/consolidation) or a trend (whether a bullish or bearish trend), the shadow of the next SWING candle that breaks through the liquidity zone is called WICK.
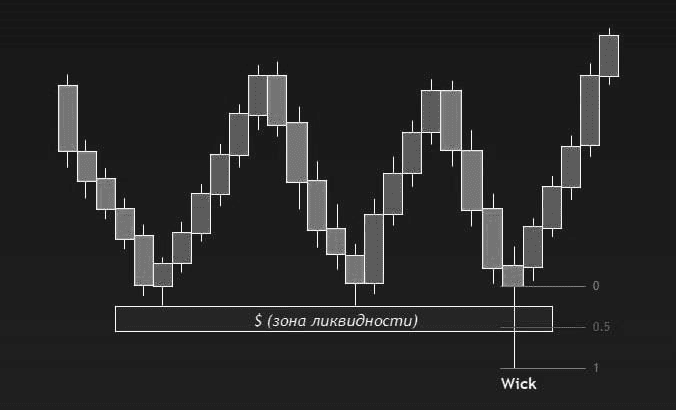
Wick
The entry into the position in this scenario will be at 0.5 Fibo at the wick of the Wick candle with a short stop behind it. The Risk/Profit ratio in this case will be the most profitable, the position will be practically safe.
Imbalance (Imbalance) or Disbalance
Imbalance (IMB) - is formed due to the emergence of an imbalance between buy and sell orders.
On the chart it is a long impulse candle, the body of which "breaks" the shadows of the two neighboring candles (on the left and on the right). If the shadows of the side candles intersect along the length of the impulse body, this is not considered an imbalance.
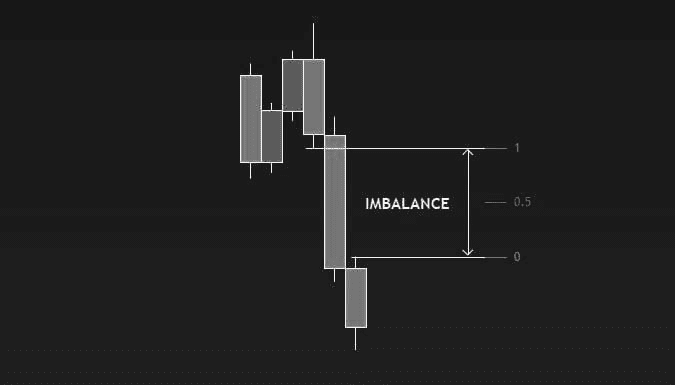
Imbalance
To restore balance in the market, a major player will try to completely cover this "hole" (imbalance zone). Imbalance is a kind of magnet for the price. Analogy with the gap on CME. Entry is also upon reaching 0.5 Fibo (covering half of the imbalance).
Orderblock (OB) - Orderblock.
Orderblock (OB) - a place where a large volume was traded by a major player. Here, the key manipulation with liquidity is carried out, due to which the whale fills the desired position. For this, they can simultaneously specifically open a short-term loss-making position (to show a false movement). In the future, Orderblocks act as support/resistance and a kind of magnet to which the price will strive for a major player to exit a loss-making position into BU or even plus.
There are 2 types of Order Block:
Bullish order block is the lowest descending candle that removes liquidity.
Bearish order block is the highest rising candle with the same function.
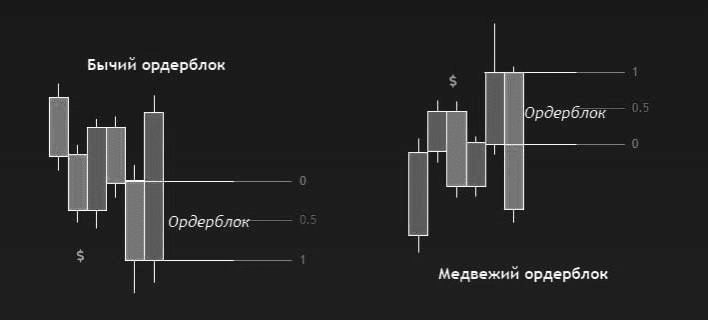
Order block
The absorption of the candle removing liquidity confirms the order block.
The optimal entry will be on the order block retest or also 0.5 Fibo of the order block candle body with a stop behind the candle shadow. For more efficient use, you need to choose OB, below which there is no large imbalance or significant liquidity zone.
Divergences
Divergence (from Latin Divergo - "to deviate", English divergence - "divergence") is a phenomenon when the direction of price movement diverges from the direction of the indicator movement. It is a reversal signal.
Divergences can be Bullish and Bearish. Also, divergence can be Classical and Hidden.
How to determine divergence?
· Bullish divergence: on the price chart, the minimums are decreasing, and on the indicator, the minimums are increasing. It indicates the weakness of the seller and is a signal for a reversal upwards ↑.
With hidden divergence on the chart, everything looks the other way around.
To identify divergence in a pair, one of the classic indicators (such as RSI, Stochastic, MACD, etc.) is usually used on the price chart.
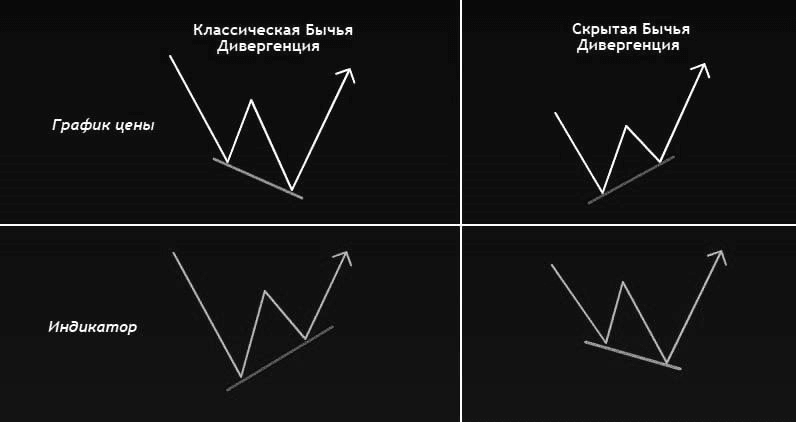
Bullish Divergence
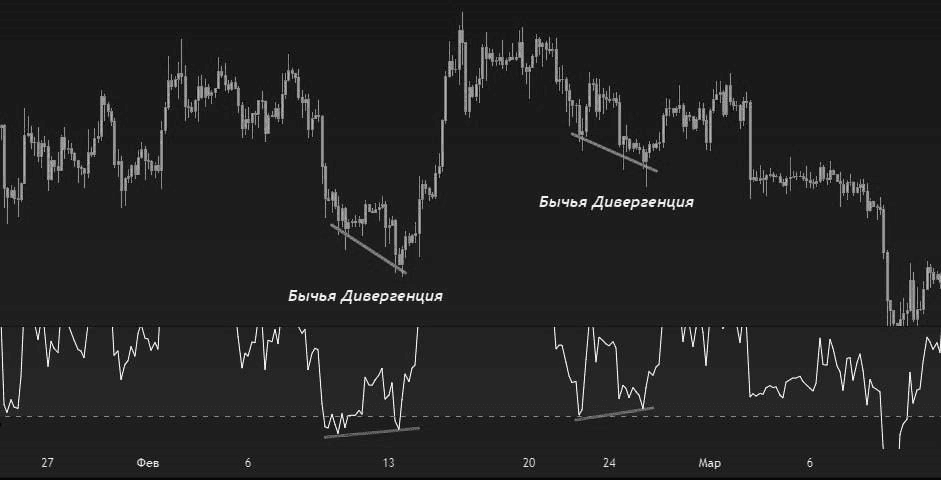
Example of Bullish Divergence on a chart
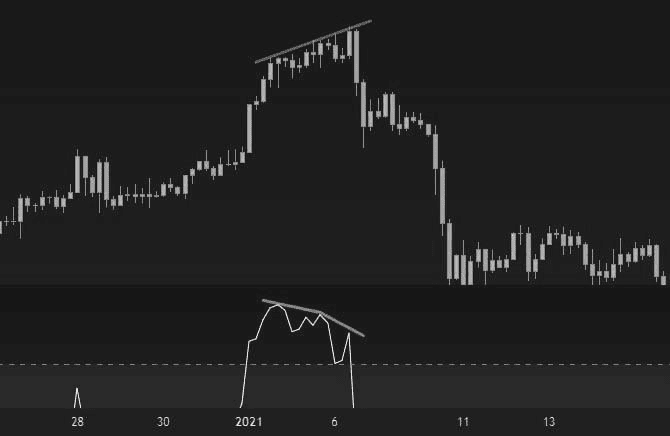
· Bearish divergence: the price chart shows rising highs, while the indicator shows falling highs. Indicates buyer weakness and is a signal for a downward reversal ↓.
With hidden divergence on the chart, everything looks the other way around.
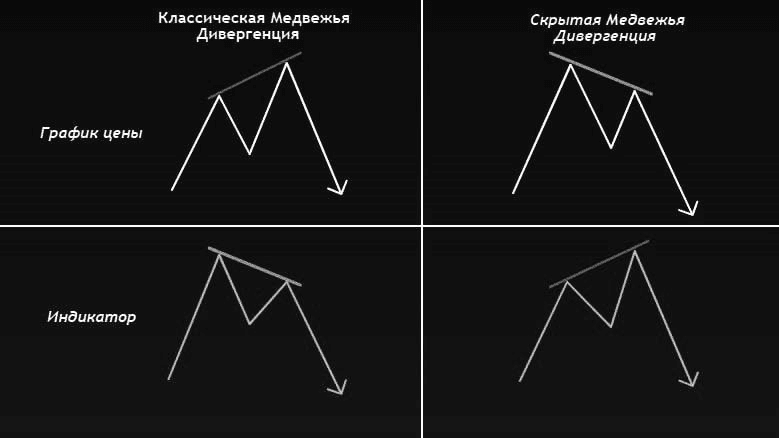
Bearish Divergence
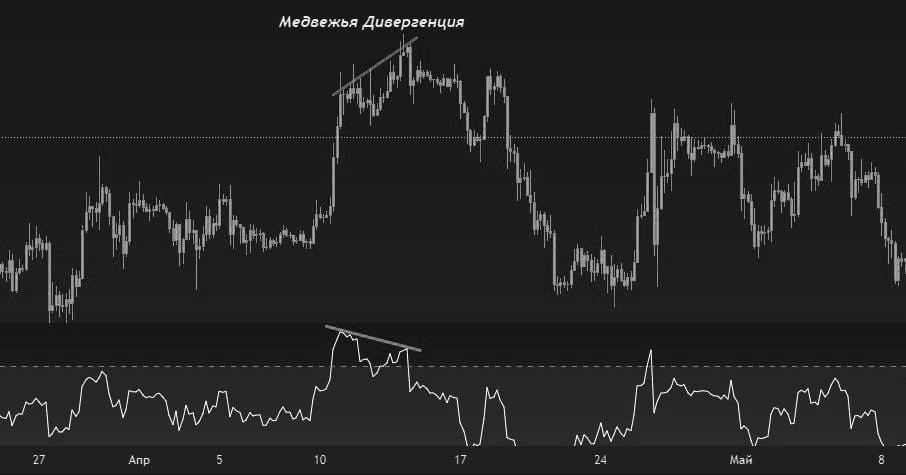
Example of Bearish Divergence on a chart
The higher the Timeframe, the stronger the signal will be. On lower TFs (1-15 min) divers are often broken.
Triple Divergence is a very strong reversal setup.
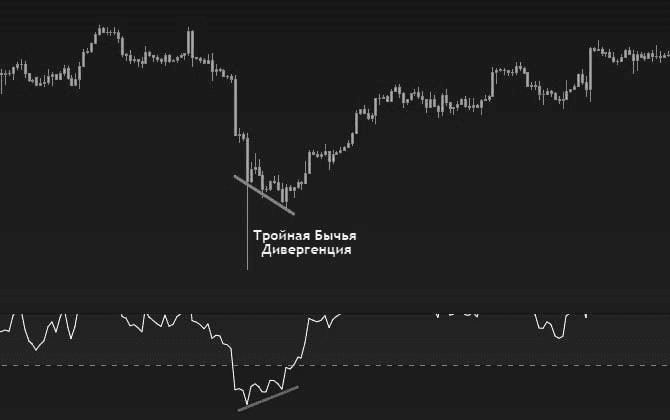
Triple Bullish Divergence
Volumetric Analysis, Vertical Volumes
Volumes reflect the actual interest of market participants. This is an indicator of purchases and sales of an asset for a certain time (per traded candle on a particular time frame, be it 1min/5min/15min/1h/4h/1d, etc.). Volumes help determine the strength of a trend, as well as identify its fading and imminent change. They show a deeper picture of the market and are an additional factor in making trading decisions.
An increase in volumes means the strength of the trend, and a decrease means the weakness of the trend:
During a bullish trend, purchase volumes increase, and during a bearish trend, sales volumes increase, respectively.
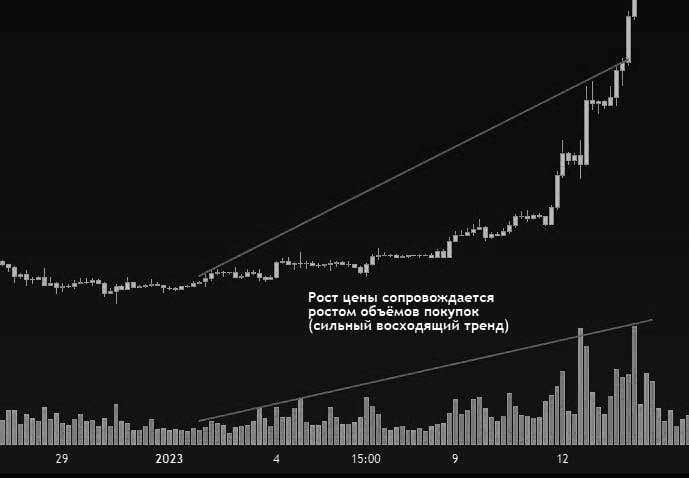
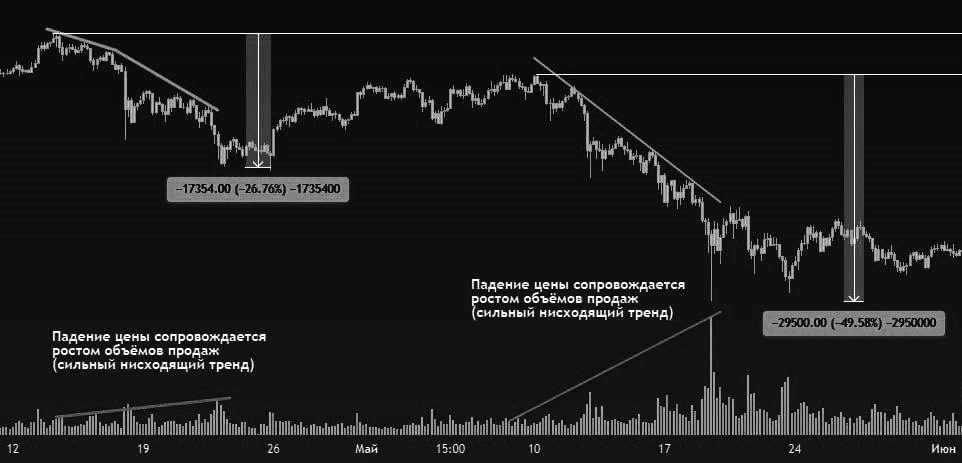
A rise in price during a bullish trend with a decrease in buying volumes may signal an imminent reversal downwards, while a fall in price with a decrease in selling volumes may signal an imminent reversal upwards.
Three Drives Pattern
An analogue of the classic Pattern from TA "3 Movements", which we studied in one of the previous courses.
Three Drives Pattern (TDP) is a reversal pattern that is characterized by a series of higher highs or lower lows. Often the pattern is based on a parallel channel or a wedge figure due to the renewal of previous Swing candles.
Typically the pattern is formed near a support/resistance zone.
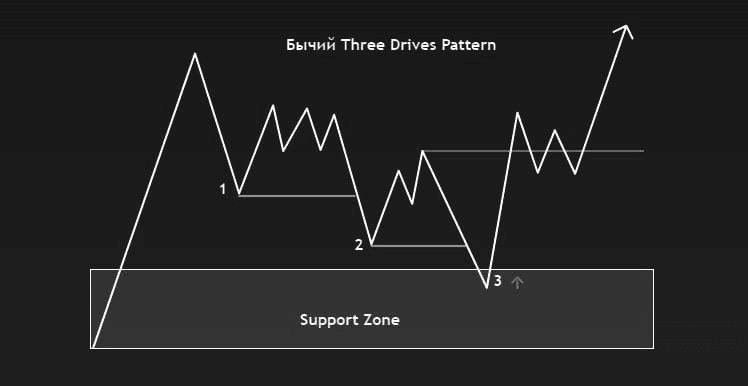
Bullish Three Drives Pattern - a series of lower lows.
Bullish TDP
The entry into the position will be when the price enters the support zone (Support) or after the third minimum has been formed. The stop order is placed below the support zone.
Bearish Three Drives Pattern - a series of higher highs.
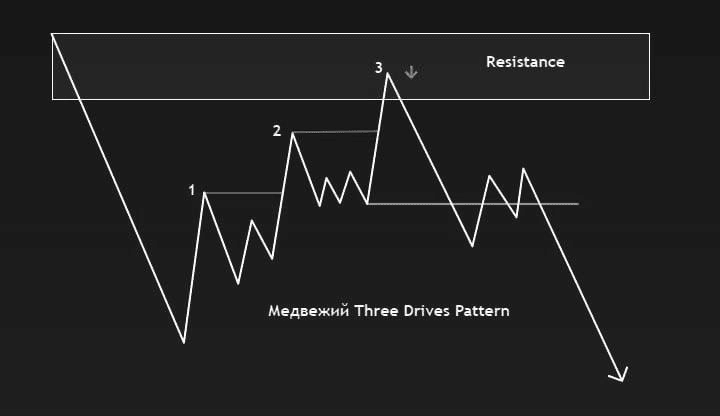
Bearish TDP
The entry into the position will be when the price enters the resistance zone (Resistance) or after the third maximum has been formed. The stop order is placed above the resistance zone.
Three Tap Setup (3-Tap Pattern)
Three Tap Setup (TTS) is an analogue of TDP, but here there is no third more
lower minimum or higher maximum. This is the main difference between the patterns.
The main task of TTS: accumulation of a position by a major player. Occurs in the support/resistance zone.
Bullish Three Tap Setup - a position taken by a major player in the Support zone.
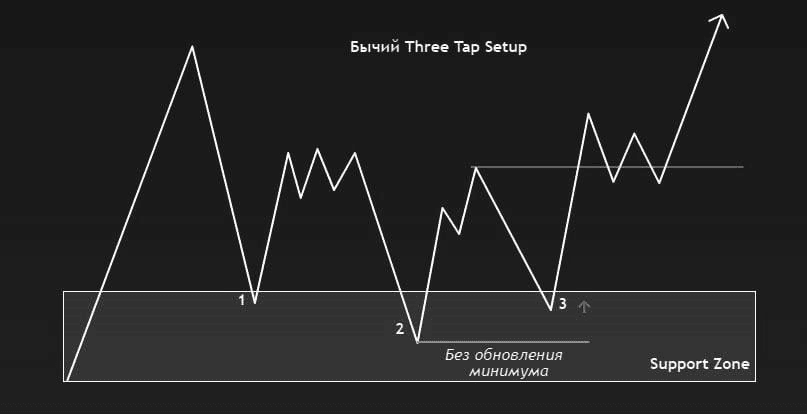
Bullish TTS
The entry into the position will be on the second movement (collecting stops through updating the minimum) or on the third retest of the support zone and OB of the second movement. The stop order is placed below the support zone.
Bearish Three Tap Setup - a position taken by a major player in a resistance zone.
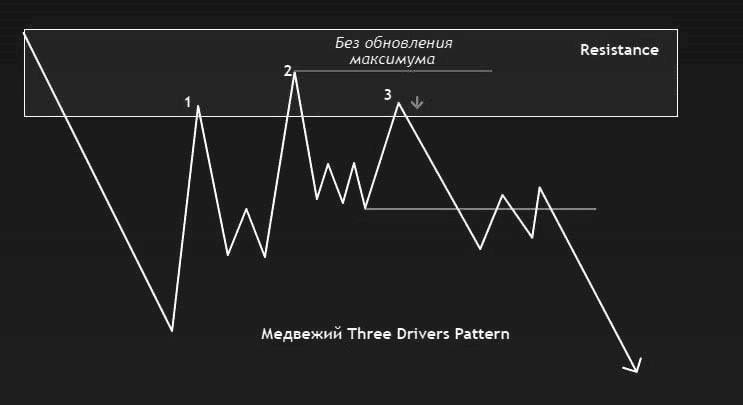
Bearish TTS
The entry into the position will be on the second movement (collecting stops through updating the maximum) or on the third retest of the resistance zone and OB of the second movement. The stop order is placed above the resistance zone.
Trading sessions
The bulk of market activity occurs during the Asian, European (London) and American (New York) trading sessions. The rest of the time, markets often experience lower volatility (despite the fact that cryptocurrency exchanges trade 24/7).
Asian trading session: 03:00 – 11:00;
European trading session (London): 09:00 – 17:00;
American trading session (New York): 16:00 – 24:00.
Moscow time.
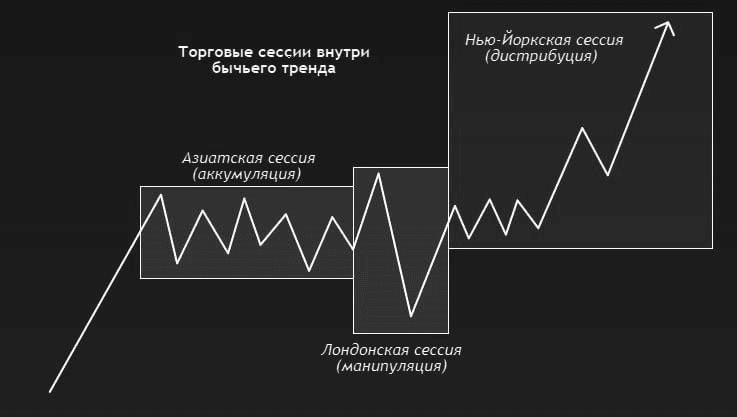
There are 3 market cycles during the day: accumulation, manipulation (sharp manipulative movement with the aim of capturing liquidity and collecting stops), distribution (distribution of positions).
Typically, Accumulation occurs during the Asian session, Manipulation during the European (London) session, and Distribution during the American (New York) session.
Chicago Mercantile Exchange (CME)
Trading on the Chicago Mercantile Exchange (CME Group) is conducted from Monday to Friday. Bitcoin Futures are also traded here. The exchange "rests" on weekends and resumes trading on Monday of the following week.
· Trading starts on Monday at 01:00 Moscow time.
· Trading closes on Friday at 24:00 Moscow time.
In winter:
· Trading starts on Monday at 02:00 Moscow time.
· Trading closes on Saturday at 01:00 Moscow time.
Further, using the example of summer time: among other things, during the week, daily trading opens at 01:00 and closes at 24:00 of the current day (Moscow time). Between 00:00-01:00, trading is not conducted, due to which an additional Gap may form (this happens extremely rarely, but it does happen).
Due to the fact that on classic crypto exchanges (Binance, Coinbase, Bybit, KuCoin, OKX, etc.) trading is carried out 24/7 without days off, during the trading on them on the weekend the BTC rate may change, and then trading on Monday on CME will open with a gap.
Gap (Russian: "Break") - a price gap on a price chart (in our case, between the closing price on Friday and the current price at the opening on Monday).
Such "holes" in the future act as a kind of magnet for the price, and in most cases they try to cover them.
In practice, the smaller the gap, the faster it is closed.
What might happen is that during active trading on classic crypto exchanges on Saturday, the BTC price moves away from the CME closing price on Friday (either higher or lower) quite significantly. Then, to prevent a new gap from forming on Monday, the price will try to return to the starting point by the end of Sunday.
In practice, gaps are quite common, but in 80-90% of cases they are completely closed sooner or later. The formation of a Gap serves as an additional signal for the probable further direction of price movement (with the aim of closing the "gap").
Important indices
Despite the fact that the cryptocurrency market is developing extremely quickly and has already become something familiar and ordinary for many, it is still very young and is not yet ready for complete independence. Crypto is heavily dependent on the classic stock market (represented by the S&P500 index) and the Dollar index (DXY).
S&P500 is a stock index, the basket of which includes shares of 500 selected public companies traded on US stock exchanges with the largest capitalization. There is a positive (direct) correlation with BTC and the cryptocurrency market in general.
Typically, the growth of S&P500 is accompanied by the growth of BTC and the fall of DXY.
· DXY - an index showing the US dollar's relationship to six other major currencies: the euro, the yen, the pound sterling, the Canadian dollar, the Swedish krona and the Swiss franc. Negative (inverse) correlation with BTC and the cryptocurrency market in general.
Typically, the growth of DXY is accompanied by a fall in BTC and S&P500.
To form a clearer picture of what is happening, these important indices cannot be neglected. Often, the movement of the same DXY helps to understand the situation on the cryptocurrency market.
Let's sum it up
The Smart Money concept helps to identify the actions of a major player and "sheds light" on many manipulations, explaining their nature. With this strategy, you will learn to benefit from the manipulations of a major player and will be able to trade along with him and in the future will join the ranks of the best of the best! If the article was useful, save it so as not to lose it, and also subscribe to the channel and look for the Cryptonator's Diary in Telegram. Good luck, friend. $BTC $ETH