"Solana Trend Analysis: Outlook after the Fall"
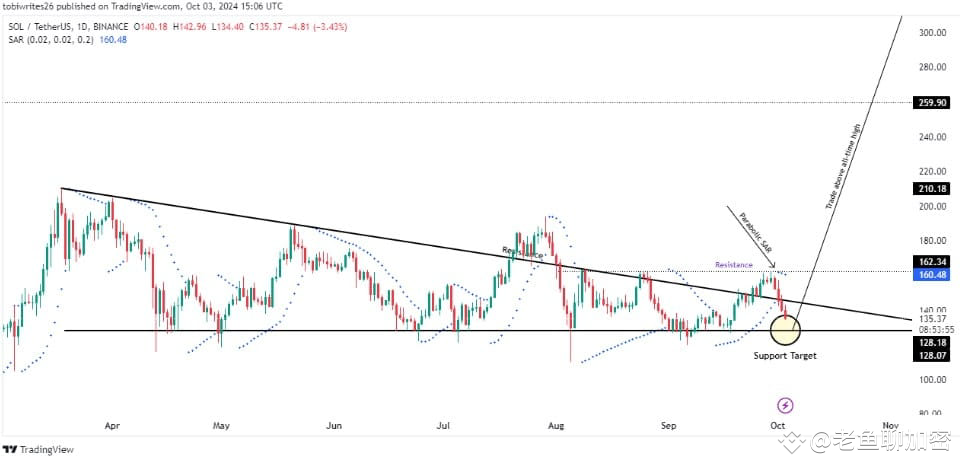
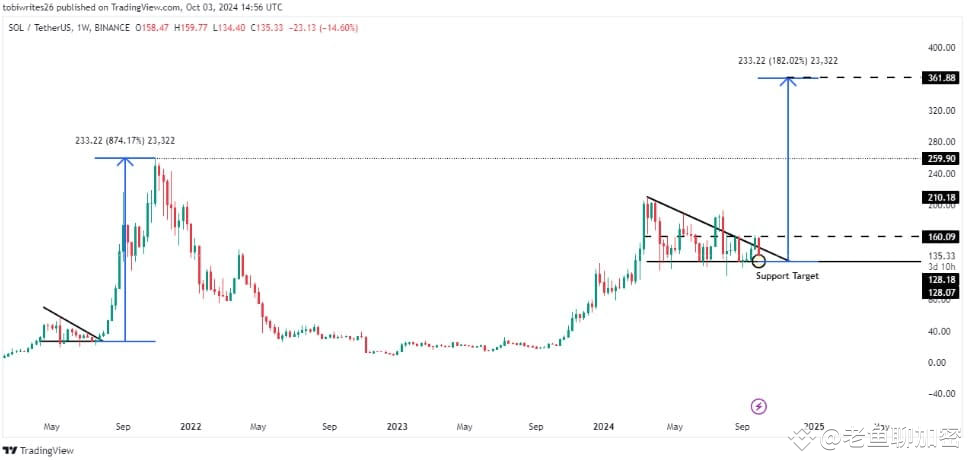
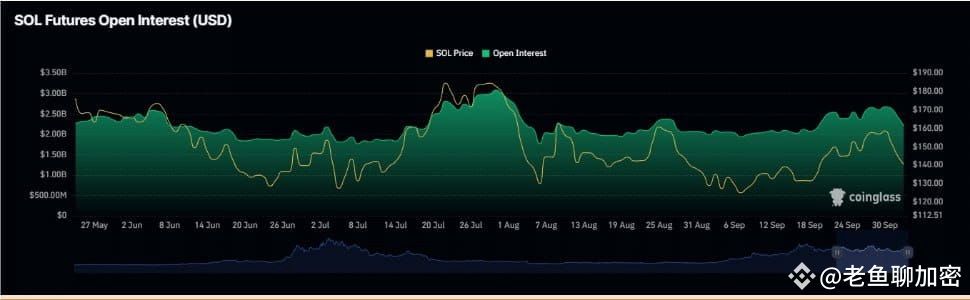
Recently, Solana (SOL) has retreated from a strong resistance line and is currently approaching the nearest support level. On-chain indicators including liquidation data indicate a bearish bias in the market, with SOL rising only a little over the past month and currently falling on the daily chart. Its decline is associated with a pullback from the $160.09 resistance zone, and market sentiment and indicators validate a possible fall to the $128.18 support level. However, based on historical patterns, SOL may be preparing for a massive rebound, and the current trend is similar to that in 2021, and may be in an accumulation phase. At the same time, the lack of interest in the market has led to a drop in the price of SOL, a significant reduction in open interest, and traders have been forced to exit the market, with a total liquidation of $10.88 million. Bearish forces dominate, which may push SOL to the key support level of $128.18.
Recently, Solana (SOL) has retreated from a strong resistance line and is currently approaching the nearest support level. On-chain indicators including liquidation data indicate a bearish bias in the market, with SOL rising only a little over the past month and currently falling on the daily chart. Its decline is associated with a pullback from the $160.09 resistance zone, and market sentiment and indicators validate a possible fall to the $128.18 support level. However, based on historical patterns, SOL may be preparing for a massive rebound, and the current trend is similar to that in 2021, and may be in an accumulation phase. At the same time, the lack of interest in the market has led to a drop in the price of SOL, a significant reduction in open interest, and traders have been forced to exit the market, with a total liquidation of $10.88 million. Bearish forces dominate, which may push SOL to the key support level of $128.18.