


Technical indicators are among the most important tools that help traders in various financial markets. The RSI (or Relative Strength Index) is considered one of the most important and popular of these indicators, given its great advantages and benefits in determining price trends on charts, and identifying saturation areas.
Whether overbought or oversold, measuring the strength of momentum in a trend, as well as the accuracy of the trading signals generated by it. However, it can be said that the RSI contains many secrets,
These are the secrets of the RSI indicator in trading, which may be unknown to many traders, especially beginners. These are the secrets related to how to monitor and capture high-quality and reliable trading signals, as well as the settings of the indicator itself.
In this article, I will discuss with you the secrets of the RSI indicator in trading. We will first start by presenting a brief overview of the nature of the Relative Strength Index and its components. Then we will learn how to benefit from the various trading signals resulting from it in a way that is somewhat different from traditional methods. As well as its best settings.
What is the RSI indicator?
The Relative Strength Index (RSI) is a technical indicator that belongs to the oscillators. It was invented by the famous market analyst and expert Welles Wilder, who first introduced it in 1978 in his book “New Concepts in Technical Trading Systems.”
Like all oscillators, the main goal of the RSI is to measure momentum, i.e. the speed of price movement over time. It can then detect overbought and oversold areas. Thus, the RSI oscillates between two specific levels: zero at the bottom, and 100 at the top. Between these two levels are three other levels: 70, 50 (the middle line or center line), and 30.
The chart below illustrates how the RSI indicator works:
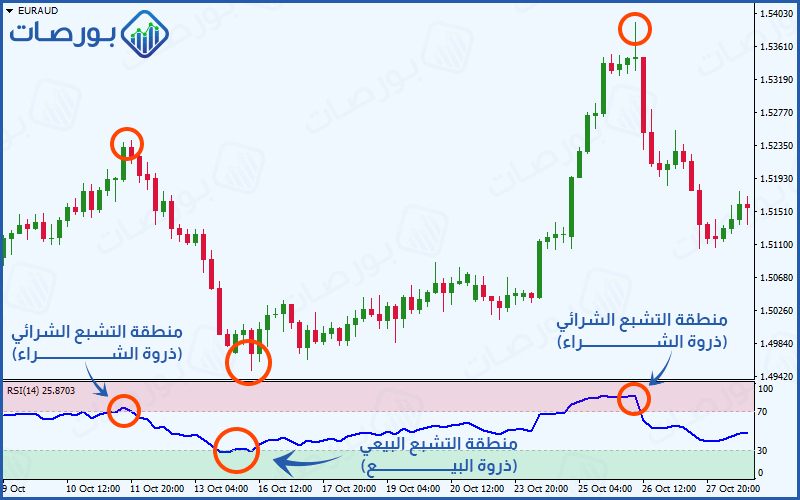
Figure 1 (RSI)
Overbought and Oversold Areas on RSI
Looking at the chart above, we notice that the RSI indicator is divided into three clear areas in order, which are:
Overbought zone: Located above the indicator, in the range between 70 and 100.
Neutral zone: Located in the middle of the index, in the range between 30 and 70.
Oversold zone: Located below the indicator, in the range between zero and 30.
Therefore, when reading the RSI, you should focus primarily on the following points:
When the RSI reading goes above 70 (above), it indicates that the price has reached an overbought state (buyers have exhausted their strength). Then we can look for selling opportunities.
Likewise, when the RSI reading goes above 30 (bottom), it indicates that the price has reached an oversold state (sellers have exhausted their strength). Then we can look for buying opportunities.
When the indicator is in the neutral zone, it often means that the price is moving in a clear direction, whether it is an uptrend or a downtrend.
It is important to keep in mind that these values (levels 70 and 30) can change; they are just default settings for the indicator, and may differ from one trader to another, according to each trader’s preferences and trading strategies (we will discuss this later in some detail).
Of course, the RSI indicator can be used in our trading in many ways, the most important of which are:
Exploiting the presence of the indicator in the overbought or oversold areas, and then determining the intersection of the indicator line with one of the mentioned levels (70 or 30). Each intersection has a specific meaning, and through it, good trading opportunities can be seized.
Spotting the phenomenon of divergence, which is one of the strongest signals of the RSI indicator.
Knowing that there are many details or secrets behind each method, which we will learn about in the following lines.
The most important secrets of the RSI indicator
When we mention the term RSI secrets, we mean those unconventional technical methods of using the indicator, through which we can get the most out of it. This is the main goal of using any technical indicator. These methods relate to the previously mentioned indicator usage strategies (peak areas, crossovers, divergences), or to the RSI settings themselves, which we can adjust to suit our trading methods.
RSI Indicator Secrets for Trading Overbought and Oversold Zones
When using the RSI, most novice traders place buy or sell orders in the market as soon as the indicator reading exceeds 70 (overbought areas), or 30 (oversold areas), and this is a huge mistake! Why?
Because the price can continue to move in the main direction. Accordingly, the indicator value moves to levels such as 90 up or 10 down during times of strong bullish or bearish momentum respectively. Therefore, if you place a sell order when the RSI reading reaches above 70, or place a buy order when the RSI reading reaches below 30, you are taking a huge risk that can lead to huge losses.
See the chart below:
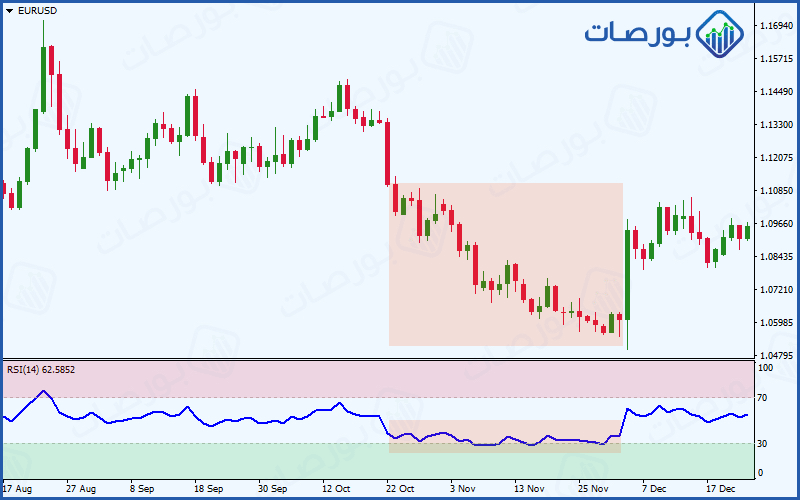 Figure 2 (RSI reaching overbought or oversold areas does not represent a trading signal)
The chart above shows an example of the RSI on the daily chart of the EUR/USD pair. We can see that despite the RSI falling below the 30 level (entering the oversold zone), the price continued to fall significantly.
Also, another problem with this hasty approach is that you will need to place a very large stop loss order to avoid price action fluctuations. This means that the risk to reward ratio will also be large.
So, what's the solution?
The solution is to treat the RSI differently, like professional traders. The secret of their success is that they combine the RSI signals with some other technical factors that confirm this signal. Based on this, they know exactly when and where to place their orders, set a tight stop loss order, and have a good reward-risk ratio.
In the chart below we notice that the indicator has been confirmed to have reached the overbought and oversold areas. Hence, the price trend reversal is confirmed by the Japanese candlestick patterns.
Figure 3 (Confirmation of RSI signals through Japanese candlestick patterns)
In the above figure of the GBP/USD pair, we can see two trades: a sell trade and a buy trade, based on the price reaching the overbought and oversold areas respectively.
First deal (sell)
In the first trade (far left of the chart) the RSI reading exceeded 70, indicating that the market has entered the overbought zone. However, before we place a sell order in the market, we must look for confirmation of our sell decision. This confirmation came as soon as a bearish candlestick pattern appeared. It was a bearish engulfing pattern, which is one of the most powerful and effective candlestick patterns.
Also, we can place a stop loss order very precisely, above the bearish engulfing candle. This way we will enter the market at the right time, when the bearish momentum is likely to increase.
Second deal (buy)
The same applies to the second trade (the buy trade on the right of the chart above). It was clear to us that the RSI was in the oversold zone. However, this was not enough to take a buy position, as we needed to look for additional confirmation to enter a buy position. The confirmation came with the appearance of the bullish Three White Soldiers candlestick pattern, which confirmed the price rebound upwards.
Once the bullish Three Soldiers pattern is complete (close of the third candle of the pattern), we can enter a high-quality and reliable buy trade. We will have several options for placing a stop loss order. The best one is to place it below the last low formed before the price went up.
RSI Divergence Secrets
Another way professional traders use to trade with the RSI is divergence. Divergence is the difference in the reading of price action and the RSI indicator. The RSI indicator may make a higher low than the previous low, while the price has made a lower low than the previous low, which is a conflict between the price action and the indicator value.
See the chart below, where we notice a confirmed bullish divergence forming:
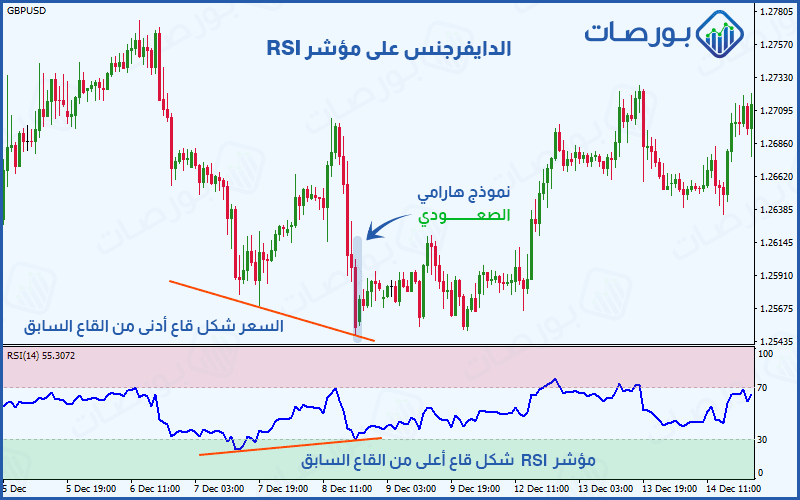
Figure 4 (Confirmation of divergence on the RSI through Japanese candlestick patterns)
In the chart above we see a great example of divergence. However, we should not rush into a long trade without additional confirmation from candlestick patterns. In the previous example, the confirmation came from the appearance of a Bullish Harami pattern, which also gave us the opportunity to place a tight stop loss order, below the last bottom formed (the bottom of the pattern).
From this we conclude that the real secret to successful trading using the Relative Strength Index is to combine it with another auxiliary technical tool, provided that this tool is strong and reliable, such as Japanese candlesticks, so that we use it as a means to confirm the trading signals resulting from the RSI indicator, whether the signals of overbought and oversold, or the signals resulting from divergence conditions.
The importance of the center line (central level) in the RSI indicator
The vast majority of oscillator indicators have a Med Line. However, this level is often overlooked by traders despite its importance. It is no different with the RSI, as the Med Line is located at the 50 level and can be very helpful in our trading.
The center level or center line can be used to identify potential reversals in the trend. All you have to do is follow this rule:
If the RSI is above the 50 level, the momentum is considered bullish, and traders can look for buying opportunities.
If the indicator falls below 50, this means that the momentum is bearish, and you can look for selling opportunities.
Notice the chart below, where you can see an example of the EUR/USD pair on the daily time frame.
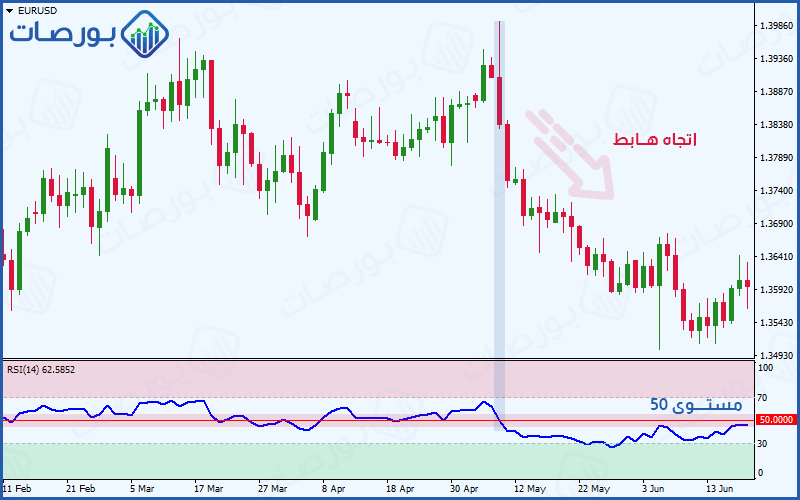
Figure 5 (The effectiveness of the RSI midline in determining the price direction)
Notice that when the price went up, the RSI remained above the 50 level. Also, at times, the midline served as a support level for the indicator.
We also note that as the momentum turned bearish, the RSI dropped below the 50 level, indicating an imminent bearish reversal.
What are the best RSI settings?
Keep in mind that adjusting the indicator settings is one of the secrets of the RSI in trading. The explanation for this is that every trader has his own trading style; a trader may tend to take short-term or long-term trades. In this case, it is better to experiment with more than one setting until you find the one that works best for you.
Like most oscillators, the RSI is usually set to 14 candles or periods, which is the default setting for the indicator. This means that the indicator bases its formula and calculation on the last 14 candles of whatever time frame you are working on. So if you are working on the daily time frame, the RSI will be based on the last 14 days on the chart. Likewise, if you are working on the hourly time frame, the indicator will be based on the last 14 hours... and so on.
Although the default setting of 14 is mentioned, it may not be the best for your trading style. Short-term traders often use a smaller time frame, such as a setting of (9), so that the indicator can absorb and react to the large number of short-term movements in the market.
On the other hand, long-term traders may prefer to set the indicator settings to a higher period, such as (25), in order to get more accurate results. So it depends on your approach to trading; whether you prefer short-term or long-term trading.
Notice the chart below, where you can see the difference between setting (9) and setting (25), in terms of how the indicator's behavior interacts with price action:
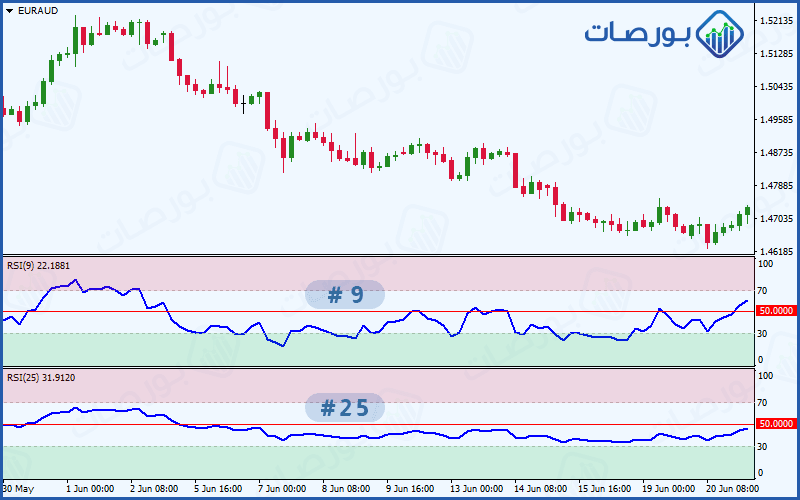
Figure 6 (Differences in the behavior of the RSI indicator when changing its settings)
From the chart above we can see that the 25 period setting is less responsive to price action fluctuations than the 9 period setting. Therefore it can be more suitable for long-term or medium-term traders (swing traders). While the 9 period setting is more sensitive to fluctuations in general, so it can be suitable for short-term traders and scalpers.
Final summary
Finally, we would like to remind you that the Relative Strength Index (RSI) is one of the best and most powerful technical indicators ever. It can be used in all financial markets, whether stocks, commodities, Forex, etc. Its true value becomes clear when used correctly. In other words, benefit from the secrets of the RSI indicator in various ways. The most important of these ways is learning how to combine it with various technical analysis tools, such as Japanese candlesticks, and other technical analysis tools such as:
Support and Resistance Levels.
Trend Lines.
Chart Patterns.
Fibonacci Levels.
This simply means that we have clear technical situations and opportunities to seize good profits, and we can enter the market based on them. It is important to apply this rule, whether when using the RSI indicator, or any other technical indicator, in order to get the desired results.
Conclusion
In this article, we learned about the secrets of the RSI indicator in trading. The RSI indicator is considered one of the most important and popular technical indicators, given its great advantages and benefits in determining price trends on charts, identifying overbought and oversold areas, and the accuracy of the trading signals resulting from it.
The main purpose of the RSI indicator is to measure the speed of price movement over time, and thus detect overbought and oversold areas.
The RSI indicator can be used in our trading in many ways, the most important of which are:
Exploiting the presence of the indicator in the overbought or oversold areas, and then determining the intersection of the indicator line with one of the levels (70 or 30). Through this, good trading opportunities can be seized.
Spotting divergence, one of the strongest RSI signals.
The secret to successful trading with the RSI lies in combining the RSI signals with some other technical factors that confirm these signals. One of the most important and effective of these tools is Japanese candlesticks. Other tools can also be used, such as:
Support and resistance levels.
Trend lines.
Artistic models.
Fibonacci levels.
The center level or midline of the RSI indicator can be used to identify potential reversals in the main price trend.
The default settings for the RSI indicator are 14 periods. However, these settings can be changed to suit your trading style. So it depends on your approach to trading and whether you prefer short-term or long-term trading.
Happy Friday to all 🙋🏻♀️
For more related economic articles, please
Follow and thanks
#TopCoinsJune2024 #MarketDownturn #FavoriteToken #elaouzi #IntroToCopytrading