What Are Gann Indicators?
Gann indicators, most notably Gann angles, are trading techniques developed by W.D. Gann. They are widely seen as innovative and still studied and used by traders today. Gann used angles and various geometric constructions to divide time and price into proportionate parts. Gann indicators are often used to predict areas of support and resistance, key tops and bottoms, and future price moves.
KEY TAKEAWAYS
Gann indicators—based on trading techniques developed by W.D. Gann—are used in predicting support and resistance levels, as well as predict tops, bottoms, and future price moves.
Gann studies have been used by active traders for decades, and even though the futures and stock markets have changed considerably, they remain a popular method of analyzing an asset's direction.
Gann angles are a popular analysis and trading tool that are used to measure key elements, such as pattern, price, and time
What Are Gann Angles?
Gann angles are named after their creator W.D. Gann. Gann believed the angles could predict future price movements based on geometric angles of time versus price. Gann was a 20th-century market theorist. The validity and usefulness of his theories, however, are subject to debate.
Several Gann angles used together make up the Gann fan.
KEY TAKEAWAYS
Gann angles are based on the 45-degree angle, known as the 1:1 angle. Gann believed the 45-degree angle is important and trends above it are strong and trends below it weaker.
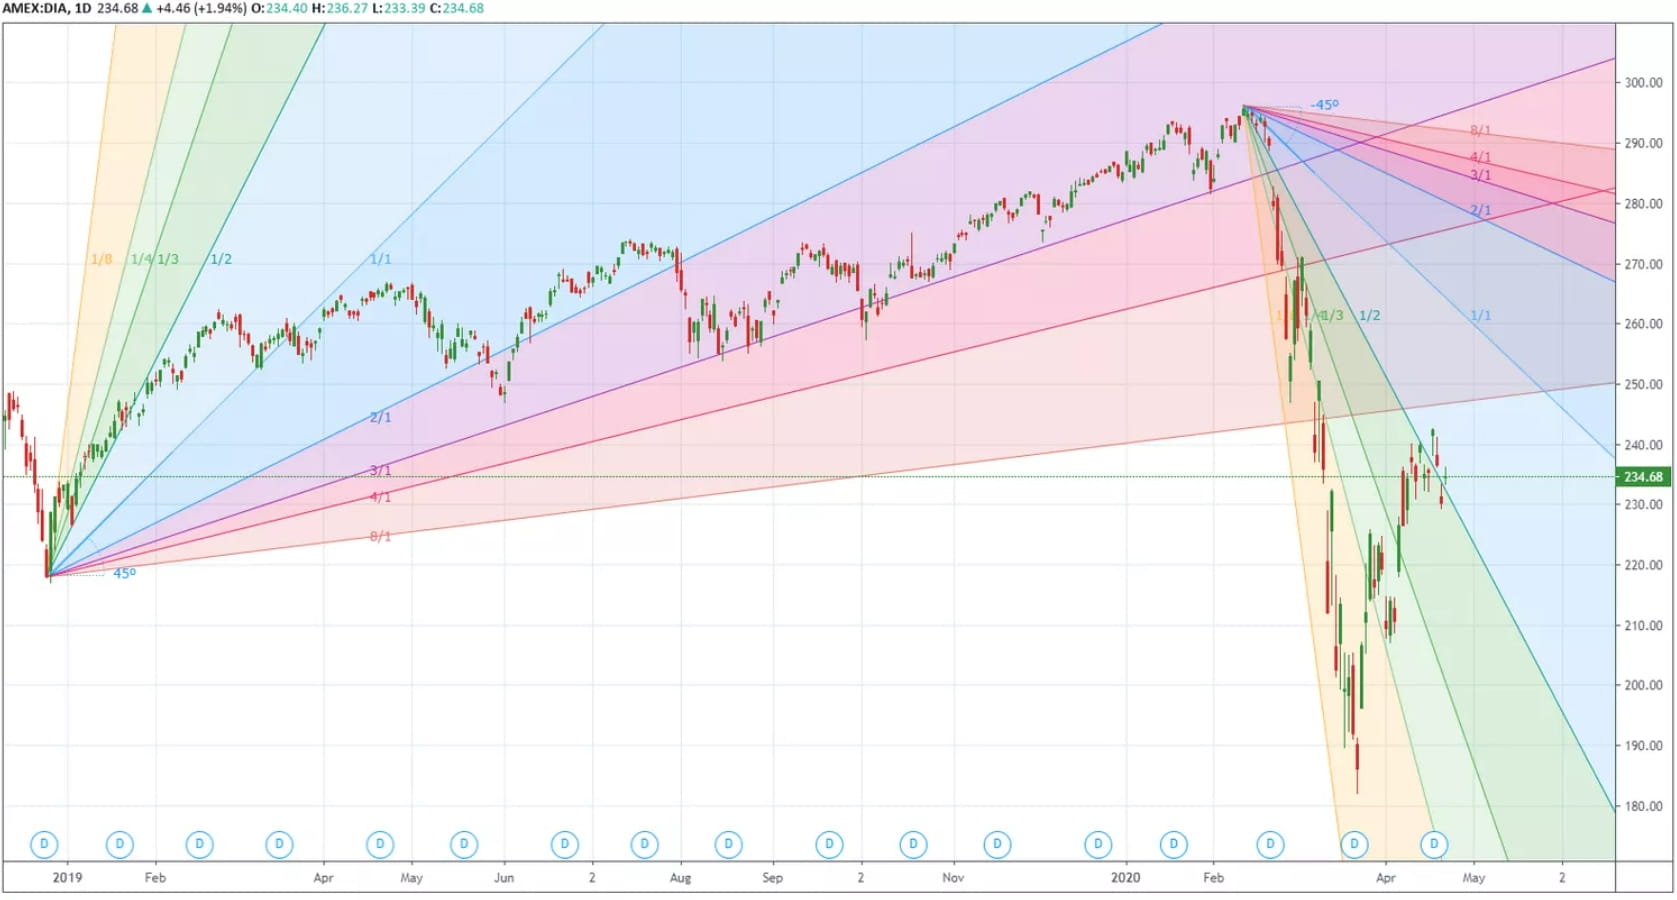
Gann angles are applied from price bottoms extending upwards or from price tops extending downwards.
Other Gann angles include 2:1, 3:1, 4:1, 8:1, 1:2, 1:3, 1:4, 1:8. The theory is that as price moves through one angle, it will gravitate toward the next.
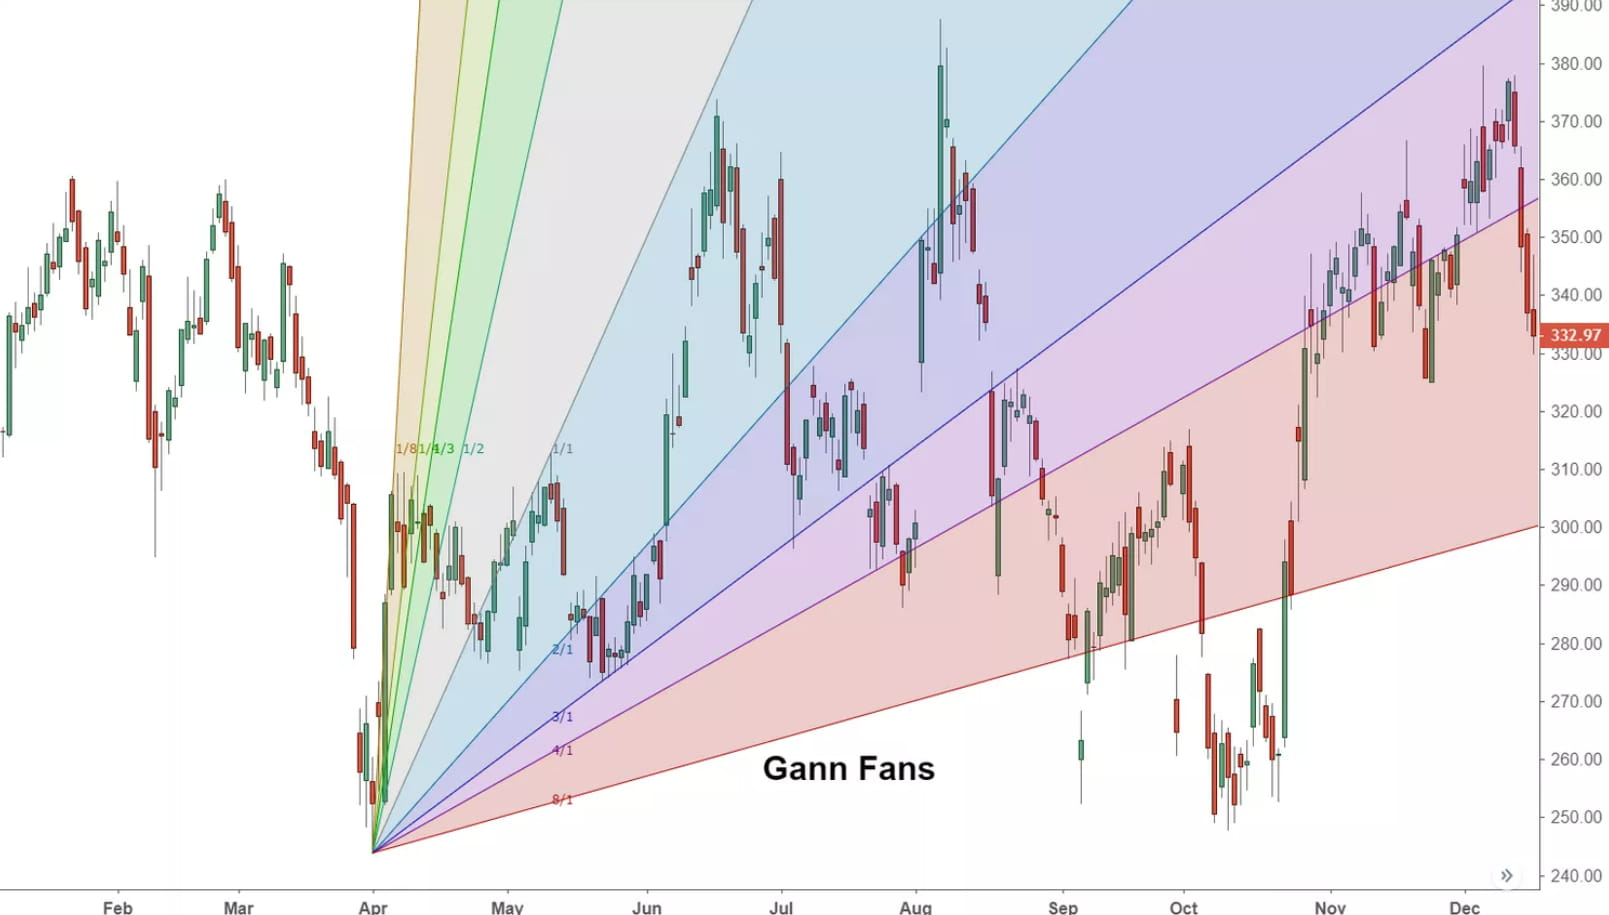
What Are Gann Fans?
Gann fans are a form of technical analysis based on the idea that the market is geometric and cyclical in nature. A Gann fan consists of a series of lines called Gann angles. These angles are superimposed over a price chart to show potential support and resistance levels. The resulting image is supposed to help technical analysts predict price changes.
KEY TAKEAWAYS
The Gann fan, created by early market technician W.D. Gann, consists of a series of angled lines. The trader selects the starting point and the lines extend out into the future.
Gann believed the 45-degree angle to be most important, but the Gann fan also draws angles at 82.5, 75, 71.25, 63.75, 26.25, 18.75, 15, and 7.5 degrees.
The Gann fan originates at a low or high point. The resulting lines show areas of potential future support and resistance.