


Pola Utama Support Resistance (DBR DBD DBR RBR)
Support and resistance are two important concepts in technical analysis. Support is a price level where buying pressure tends to increase and prices tend to reverse upwards. Resistance is a price level where selling pressure tends to increase and prices tend to turn down.
There are four main support resistance patterns that can be identified on the chart, namely:
Rally Base Rally (RBR)
Drop Base Drop (DBD)
Rally Base Drop (RBD)
Drop Base Rally (DBR)
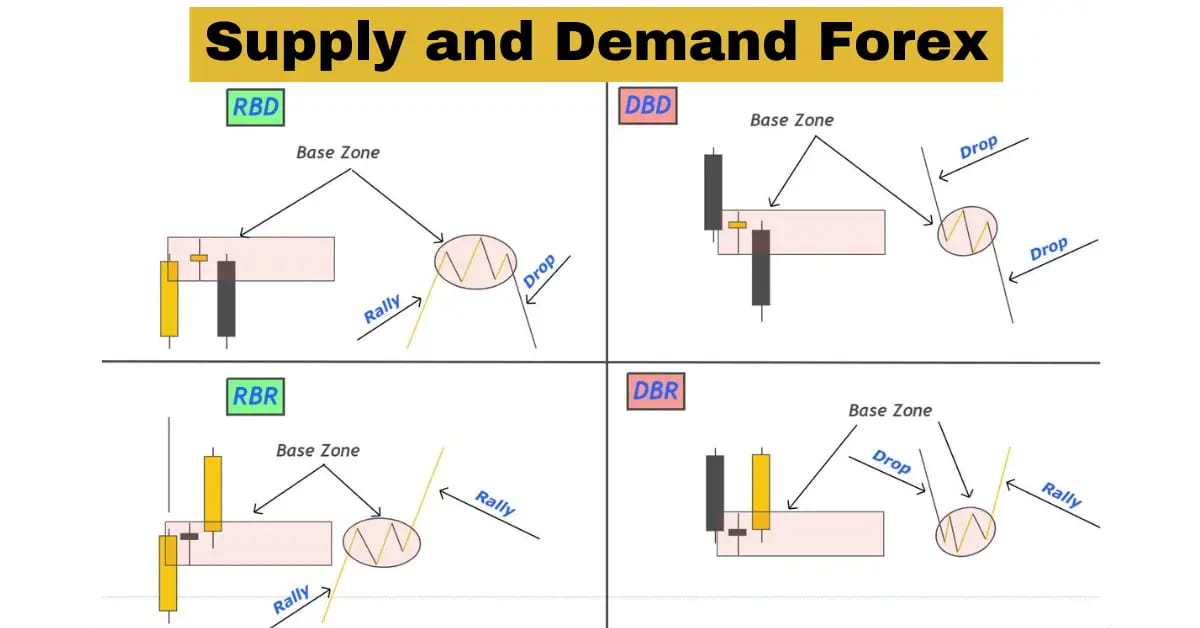
Rally Base Rally (RBR)
The RBR pattern is formed when the price moves up and then forms a consolidation above the support level. Once the consolidation is complete, the price usually resumes its upward movement.
The RBR pattern is a strong pattern because it shows that there is a lot of buying pressure at the support level. This pattern is often used as a signal to open a buy position.
Drop Base Drop (DBD)
The DBD pattern is formed when the price moves down and then forms a consolidation below the resistance level. Once the consolidation is complete, the price usually resumes its downward movement.
The DBD pattern is a strong pattern because it shows that there is a lot of selling pressure at the resistance level. This pattern is often used as a signal to open a sell position.
Rally Base Drop (RBD)
The RBD pattern is formed when the price moves up and then forms a consolidation above the support level. After the consolidation is complete, the price moves down and then forms a consolidation below the resistance level. Once the second consolidation is complete, the price usually resumes its upward movement.
The RBD pattern is a more complex pattern than the RBR or DBD pattern. This pattern is often used as a signal to open a buy position after the price rebounds from the resistance level.
Drop Base Rally (DBR)
The DBR pattern is formed when the price moves down and then forms a consolidation below the resistance level. After the consolidation is complete, the price moves up and then forms a consolidation above the support level. Once the second consolidation is complete, the price usually resumes its downward movement.
The DBR pattern is a more complex pattern than the RBR or DBD pattern. This pattern is often used as a signal to open a sell position after the price rebounds from the support level.
How to Read Support Resistance Patterns
To read support resistance patterns, you need to identify support and resistance levels first. Support levels are usually marked by a strong buying action, such as a bullish engulfing candle or bullish pin bar. Resistance levels are usually marked by a strong selling action, such as a bearish engulfing candle or bearish pin bar.
Once you have identified support and resistance levels, you can start looking for support resistance patterns. The RBR and DBD patterns are the easiest patterns to identify. The RBD and DBR patterns are more complex patterns and require more experience to identify.
Conclusion
Support resistance patterns are a powerful tool for identifying potential price reversals. By studying these patterns, you can increase your chances of profiting from the market.