


Bitcoin is the world's first and largest digital currency by market capitalization. Individual investors and traders are very interested in Bitcoin's uniqueness, growth potential, and ability to influence other digital currencies. Bitcoin's market cap is around $539,114,505,737, and the price of Bitcoin directly affects the prices of other digital assets.
This article will review the history of this cryptocurrency, make predictions for the price of Bitcoin in the near future using technical analysis, and will also look at the ratings of leading cryptocurrency analysts.
The article covers the following topics:
Key and important points
Bitcoin Weekly Elliott Wave Analysis Starting 2.9.2024
Key and important points
The current Bitcoin price in US dollars is $54 135.16 as of 09/08/2024.
Bitcoin will continue to trade at a level between $66,000 and $76,000 until the end of 2024. The price of the currency may reach $76,000 - $78,000 by the end of the year.
In 2025, the average price of Bitcoin will reach $109,000, and it is expected to trade within the range of $124,000 - $132,000.
In 2030, the price of BTCUSD will trade at $117,252, and the highest price is expected to reach around $765,037.86.
BTCUSD: According to Elliott Wave analysis, the price is expected to fall within the impulse wave [3] to reach the bottom level of 54092.00 during this week, and it will be appropriate to look for short trades for Bitcoin at the current level, with the take profit level set at 54092.00.
Bitcoin Weekly Elliott Wave Analysis Starting 02.09.2024
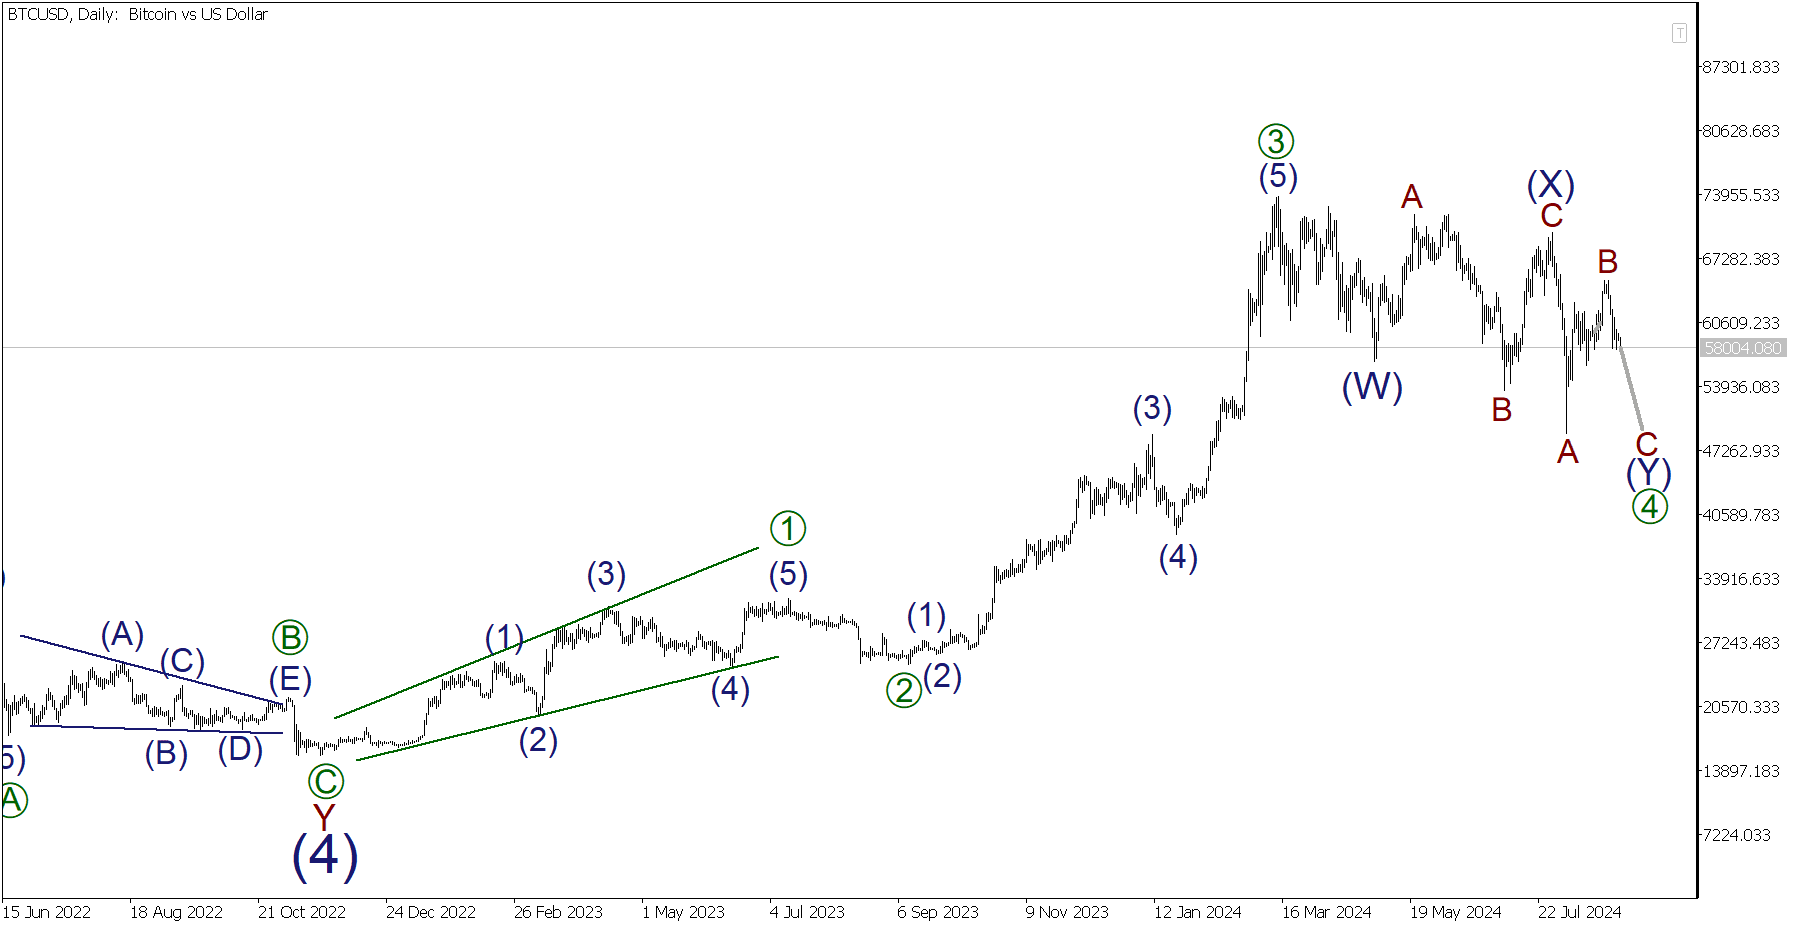
The BTCUSD market continues to form a long-term impulsive wave consisting of waves (1), (2), (3), (4), and (5). The first four waves of that wave have been completed, and the corrective wave (4) has been completed as a double zigzag wave of waves W, X, and Y. The bullish wave (5) is unfolding as an impulsive wave of waves [1], [2], [3], [4], and [5] in the latest part of the price chart. The sub-waves [1], [2], and [3] have been completed. The compound corrective wave [4] is currently unfolding as a double zigzag wave of waves (W), (X), and (Y). When the sub-wave (Y) unfolds, the corrective wave will be completed. Let's analyze the latest part of the price chart in more detail.
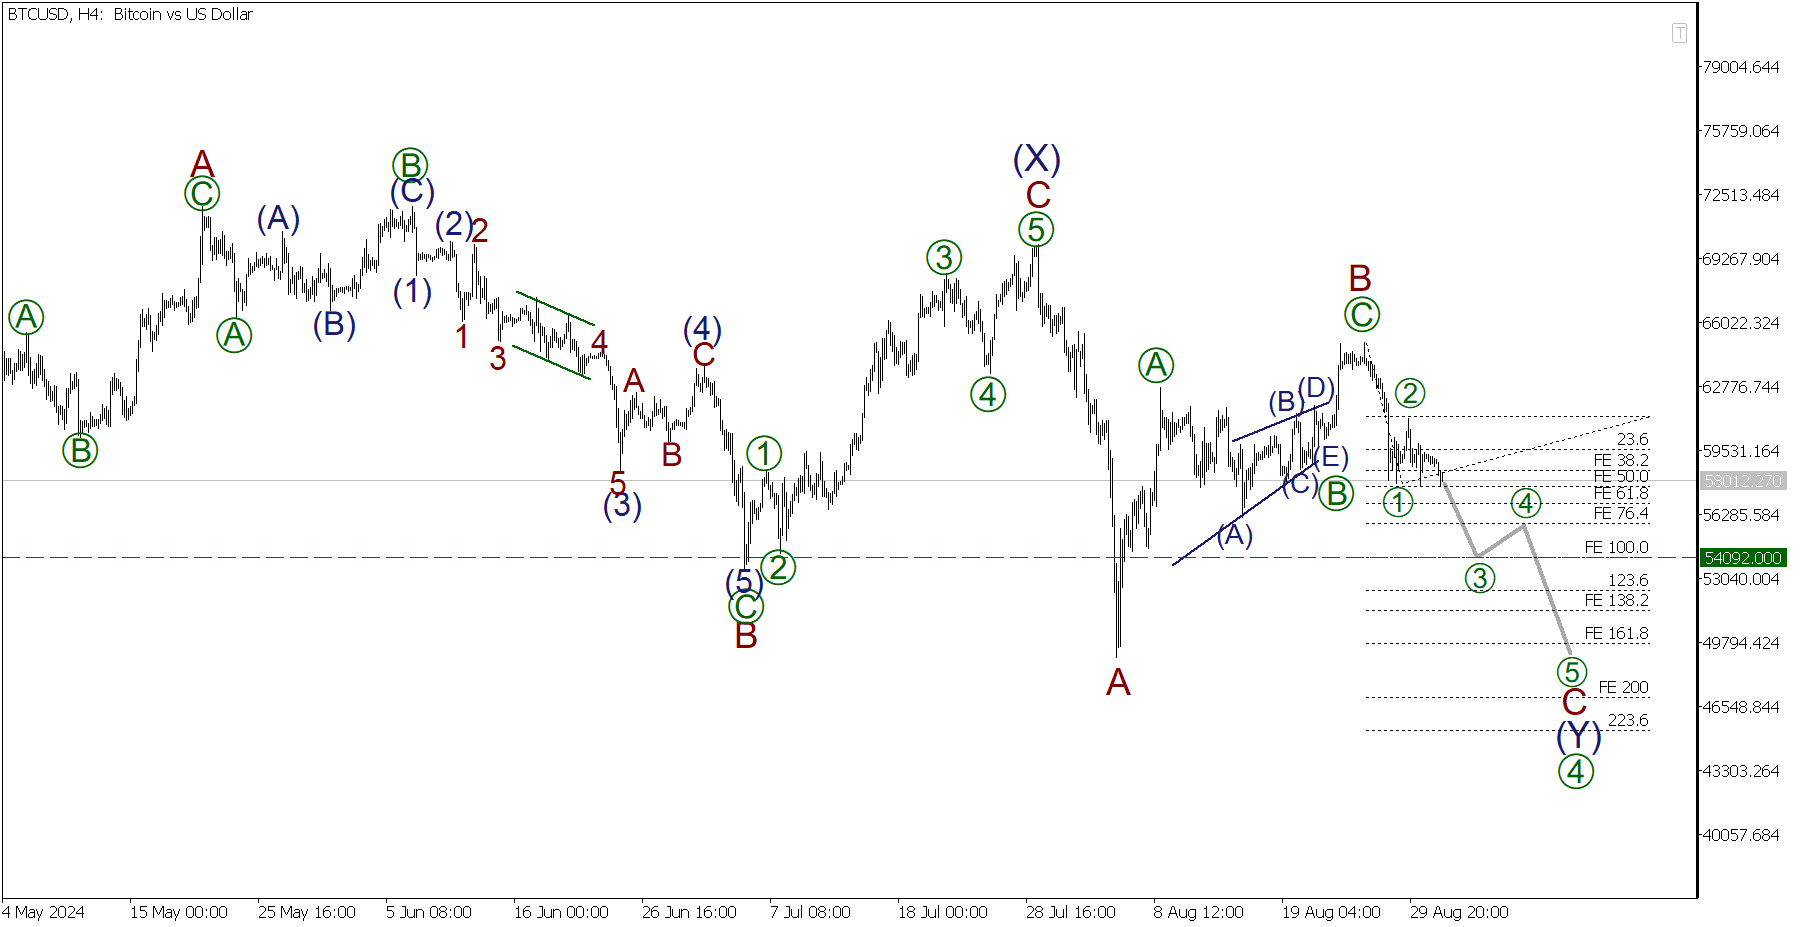
The last impulsive wave (Y) within the corrective wave [4] is unfolding as a standard zigzag wave of waves A, B and C. The impulsive wave A has been completed. The corrective wave B has also been completed as a zigzag wave of waves [A], [B] and [C]. The last wave C is developing as an impulsive wave of waves [1], [2], [3], [4] and [5]. Both sub-waves [1] and [2] have been completed. The price is trading within the impulsive wave [3]. The price is expected to fall to reach the level of 54092.00, where sub-wave [3] will be equal to sub-wave [1].