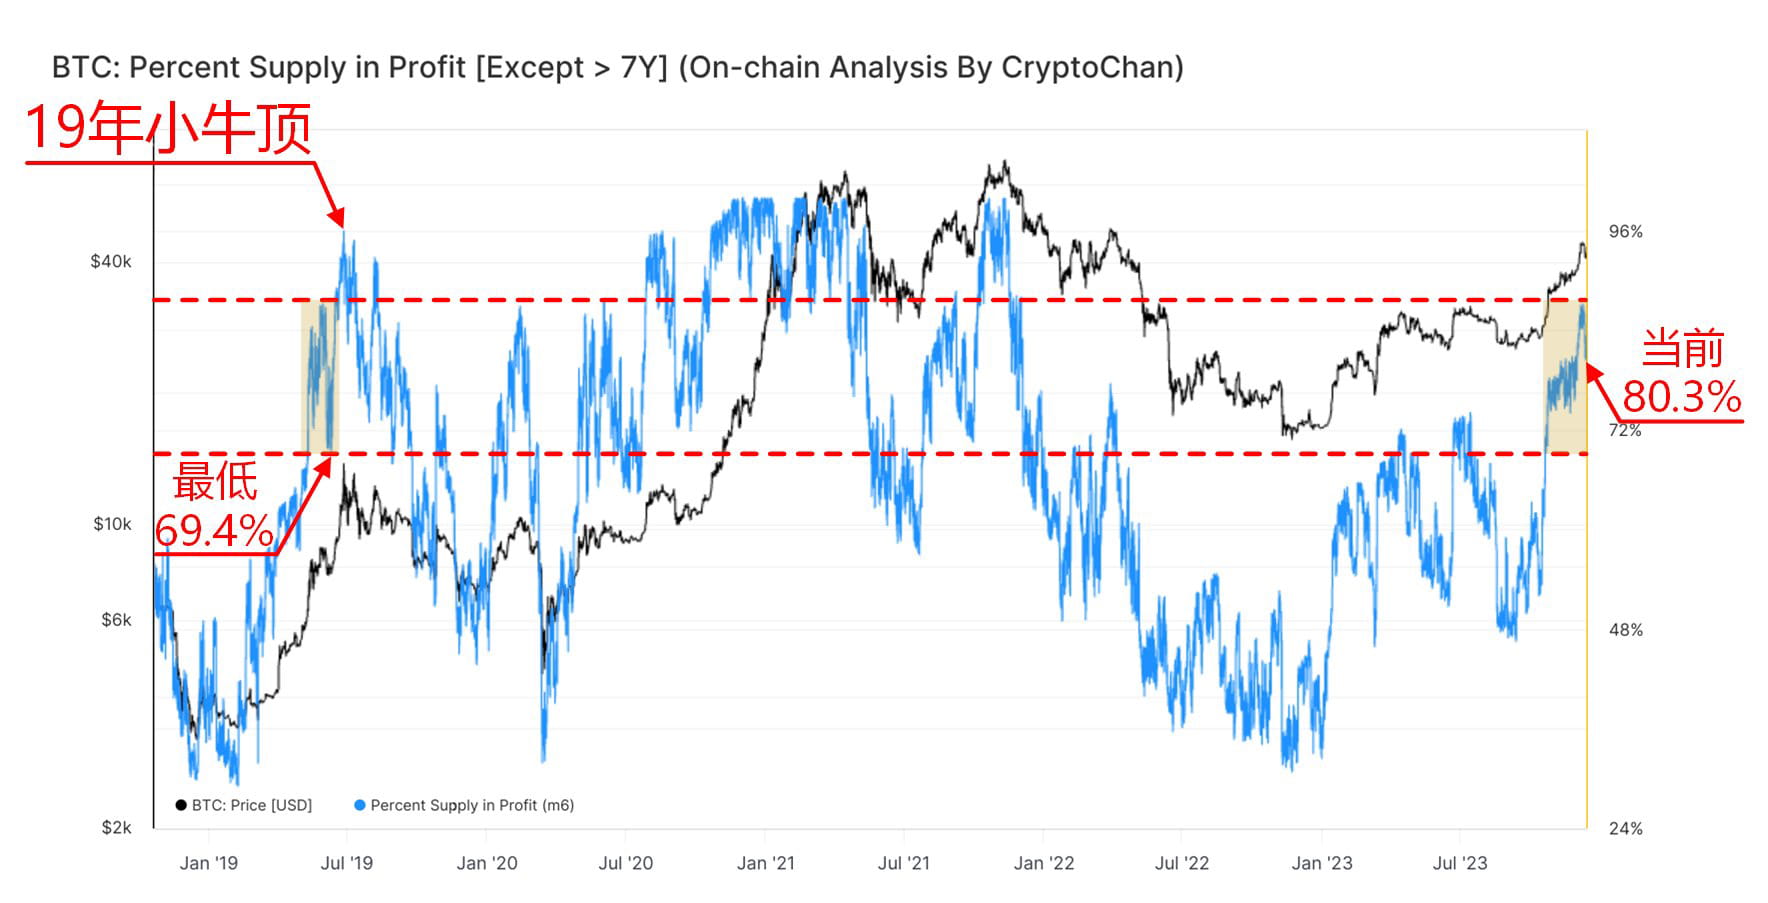
Before the BTC calf peaked in 2019, the indicator on the chain fell back to a minimum of 69.4%.
Currently, the indicator on the chain has fallen back to 80.3%.
The black line in the figure is the price of #BTC; the blue line is the number of BTC in a profitable state on the chain as a percentage of the total circulation of BTC (BTC that has not been moved on the chain for more than 7 years is regarded as long-term dormancy or lost and is excluded from the calculation). #BTC #ETH。
Currently, the indicator on the chain has fallen back to 80.3%.
The black line in the figure is the price of #BTC; the blue line is the number of BTC in a profitable state on the chain as a percentage of the total circulation of BTC (BTC that has not been moved on the chain for more than 7 years is regarded as long-term dormancy or lost and is excluded from the calculation). #BTC #ETH。