Bitcoin price is expected to rise again towards the $28,500 resistance level. If BTC breaks out of the $28,500 resistance zone, it is likely to start a strong increase.
Bitcoin remains up above the $27,450 area and is showing positive signs.
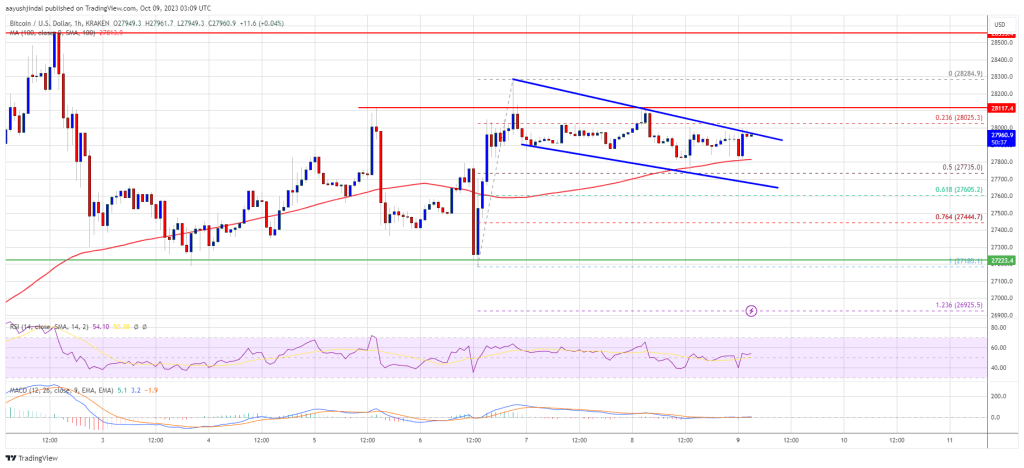
The price is trading above $27,800 and the 100 hourly simple moving average.
There is a short term declining channel in place with resistance near $27,980 on the hourly chart of the BTC/USD pair (data source from Kraken).
The pair might soon revisit the $28,500 resistance level in the near term.
Bitcoin price aims higher
Bitcoin price started a downside correction after it failed to break out of the $28,500 resistance area. BTC declined below the $28,000 level and tested the $27,200 support area.
The recent low was formed near $27,185 and the price has again increased upwards. It broke the $27,400 and $27,500 resistance levels. The price formed a high near $28,284 and it is currently consolidating gains below the 23.6% Fib retracement level of the recent rise from the $27,185 swing low to $28,284 high.
Bitcoin is currently trading above $27,800 and the 100 hourly simple moving average. The price is currently testing the $28,000 resistance level. There is also a short term descending channel forming with resistance near $27,980 on the hourly chart of the BTC/USD pair.
An immediate resistance on the upside is near the $28,000 level. The next key resistance could be near the $28,500 level. A close above the $28,500 resistance level could spark another increase. In the mentioned case, the price could move towards the $29,200 resistance level. Any more gains might entail a move towards the $30,000 level.
Bitcoin rejected again?
If bitcoin fails to continue above the $28,000 resistance, there could be a fresh decline. An immediate support on the downside is near the $27,800 level and the 100 hourly simple moving average.
The next major support is near $27,4500. The major support is currently formed near $27,200. A downside break and close below $27,200 could push the price further lower to $26,650 in the near term. The next support is $26,200.
Technical indicators:
Hourly MACD – The MACD is currently accelerating in the bullish zone.
Hourly RSI (Relative Strength Index) – The RSI for BTC/USD is currently above the 50 level.
Major Support Levels – $27,800, followed by $27,200.
Major Resistance Levels – $28,000, $28,500, and $29,200.