
Original author: duoduo, LD Capital

Recently, Bitcoin has been rising strongly, and has tried to break through the resistance range of 28000-28500 several times; ETH is relatively weak, and has only tested the resistance level of 1750 once. ETH This article briefly analyzes the recent price performance of ETH and possible influencing factors.
1. Price performance
ETH/BTC: Down since MERGE 2022
In the past year, ETH has been in a weak position relative to BTC. From the ETH/BTC indicator from 2022 to now, from the beginning of 2022 to June, it was in a downward trend, falling from 0.081 to around 0.050. Since then, due to the positive news of the merge, it rebounded and returned to around 0.8 in September 2022. After the merger was implemented, the indicator was in an overall downward trend and is currently 0.058, which is close to the weekly EMA 200.
However, in the long run, ETH/BTC is in a state of growth. In the long run, during the 2018 bear market, ETH/BTC reached a minimum of 0.01, while in the bear market from 2022 to now, ETH/BTC has recently been 0.05. This is mainly due to the development and growth of the ETH ecosystem, which has accumulated a large amount of on-chain value compared with the previous bear market.

Source: tradingview
Technical indicators
On the daily chart, ETH has been below EMA 200 since its decline on August 18, and MACD is just close to the zero axis. In contrast, BTC stood above EMA 200 on October 1, and MACD also broke through the zero axis and entered the above-water area.

2. Influencing factors
The strength of ETH is influenced by a very complex set of factors. At the macro level, this includes changes in the Fed’s interest rate hike policy and changes in the SEC’s regulatory attitude. At the micro level, this includes the development of the ETH ecosystem, the rise of the second layer, token consumption and supply, and market capital participation enthusiasm. Only factors that have changed significantly recently are analyzed.
Gas consumption is greatly reduced, ETH resumes inflation
In August and September 2023, on-chain transactions entered a cold period. On the one hand, there were no new hot projects on the chain, and transactions decreased; on the other hand, several large potential airdrop projects saw a large number of hacker thefts, project rugs, and other behaviors, and the enthusiasm for interaction decreased.
The gas on the eth chain has basically remained below 10 gwei. The reduction in on-chain activities and the reduction in gas fees have caused the supply of eth to exceed consumption in the past 30 days, restoring inflation, with an inflation rate of 0.275%. In the past 30 days, 27,000 ETH have been added.
However, overall, after the merge, ETH is still in a deflationary state. From the merge to date, the inflation rate is -0.217%, and a total of 277,000 ETH has been reduced.

Source: ultrasound.money
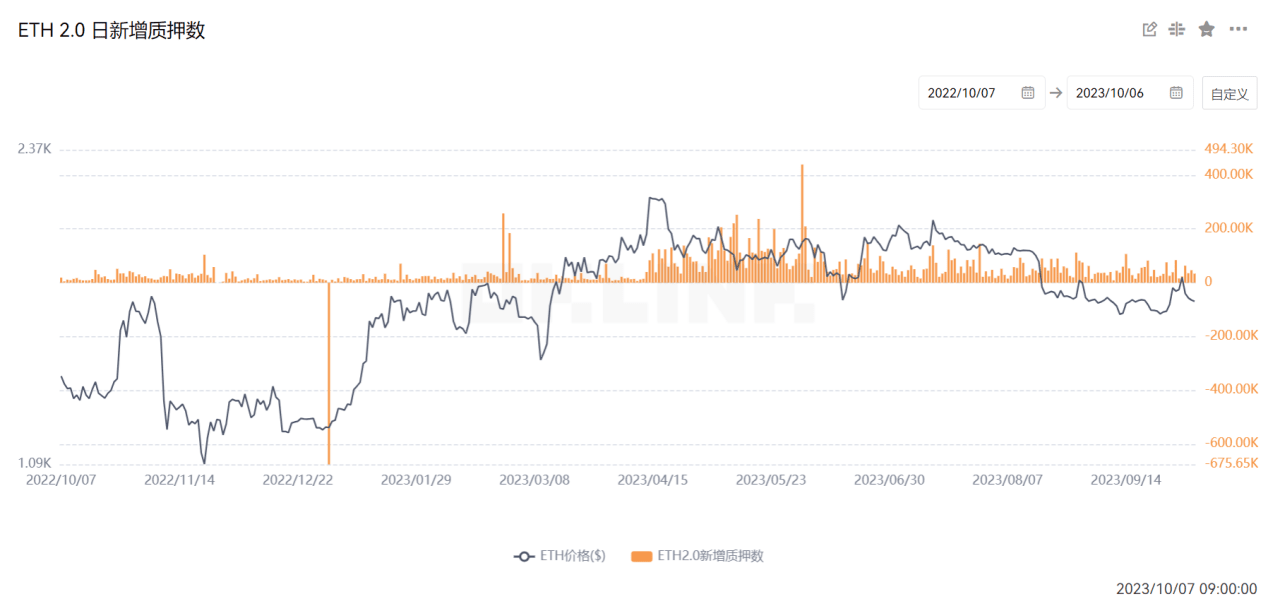
Staking slows down, and the queue of tokens waiting to be staked decreases
Currently, Ethereum has a total of 844,000 active staking nodes, staking approximately 27 million ETH, and the staking rate has reached 25.33%.
Overall, the current number of newly pledged shares is significantly lower than that in the second quarter of 2023.
Source: OKlink
Currently, there are 5723 nodes waiting to participate in staking, and Ethereum can add up to 2700 new staking nodes per day. Therefore, if no new tokens are added, it will only take 2 to 3 days to complete the process. This is the period with the least number of nodes waiting to participate in staking since the Shanghai upgrade.

Source: beaconcha.in
The founder has been selling ETH for the past two months
The address associated with founder Vitalik has been continuously transferring ETH to exchanges. On October 7, it transferred another 1,000 ETH (about $1.64 million) to Bitstamp. In the past two months, this address has deposited a total of 4,400 ETH (about $7.23 million) to Bitstamp.
In terms of quantity and amount, this is not enough to affect the price of ETH. However, in terms of sentiment, it will affect investors' confidence in holding.
FTX hacker sold ETH, bringing short-term selling pressure
The major event affecting ETH in the past seven days was that FTX hackers sold ETH and bought BTC starting from October 1st.
In November 2022, shortly after FTX filed for bankruptcy, hundreds of millions of dollars began to flow out of the exchange balance and into the hacker's address. On November 21, 2022, the hacker put 185,000 ETH ($308 million) into hibernation after storing it in 13 addresses. After 10 months of dormancy, the hacker began to transfer and sell the ETH in these addresses on September 30.
From September 30 to 6, 75,000 ETH ($120 million) was transferred from 5 addresses. Among them, 71,000 were exchanged for BTC through the THOR Chain cross-chain. 2,700 ETH was converted into 165 tBTC and then bridged back to the Bitcoin network through the Threshold Network. 1,500 ETH was transferred through the privacy network RAILGUN_Project. This also led to the announcement by THOR Chain on the afternoon of October 6 that it would temporarily enter maintenance status.
Currently, hackers still hold 110,000 ETH (US$176 million) in 8 addresses on the Ethereum network. 5 of the original 13 addresses have been cleared.


Source: mest.io
Contract data
Focusing on the change of holdings, ETH holdings are generally in a state of decline. When it rose to $1,600 in January 2023, the holdings were at the highest level of the year, about 2.37 million. When it rose to around $2,000 in April, the holdings were 1.22 million, the second highest point of the year. Before the decline on August 18, the holdings were 890,000. The current holdings are 730,000.
Compared with the high point at the beginning of the year, positions fell by 45%; compared with the second high point of the year, positions fell by 37%; compared with positions before the decline on August 18, positions fell by 17%.

Source: coinglass
Conclusion
In the long run, compared with the last bear market, ETH’s exchange rate has been rising compared with BTC due to the development of the ecosystem, rising from 0.01 to above 0.05. However, in the past year, ETH is in a weak position compared with BTC, and the exchange rate is falling.
Fundamentally, since the merge, ETH has been in a deflationary state, with an inflation rate of -0.217%. However, in the past two months, on-chain transactions have been quiet, gas revenue has dropped significantly, and ETH has entered an inflationary state, with an annualized inflation rate of 0.275% in the past 30 days.
In terms of pledge data, ETH pledge has been rising continuously since the Shanghai upgrade, and the current pledge rate is 25.33%. However, the recent increase in pledge data has slowed down. The number of new pledges is significantly less than the data in the second quarter of this year; and the number of nodes queuing for pledges is also relatively small recently, which is the least period since the Shanghai upgrade.
In terms of selling pressure, the founders continue to sell ETH. Although the amount is not large, it has an adverse impact on the confidence of holding tokens. In addition, affected by the FTX hacker selling ETH and buying BTC, it faces greater short-term selling pressure.
In terms of contract data, ETH contract positions are on a downward trend this year. Compared with the high point at the beginning of the year, ETH contract positions fell by 45%; compared with the second high point of the year, positions fell by 37%; compared with positions before the decline on August 18, they fell by 17%.
Note: The data in this article is as of October 7, 2023.