The current total circulation of Ethereum is approximately 233,000 more than 120 million. These more than 100 million tokens are now scattered in various corners of the Web3 world, including exchanges, DeFi, cross-chain bridges, Layer 2, and non-EVM ecological chains. There are also many wallets that hackers dare not touch for fear of being located.
We are bombarded with various data every day. The cross-chain Ethereum on a certain new L2 has reached a new high, and the exchange inventory has reached a new low. But has anyone ever thought about the distribution of these Ethereums and where are the Ethereums’ favorite places to go?
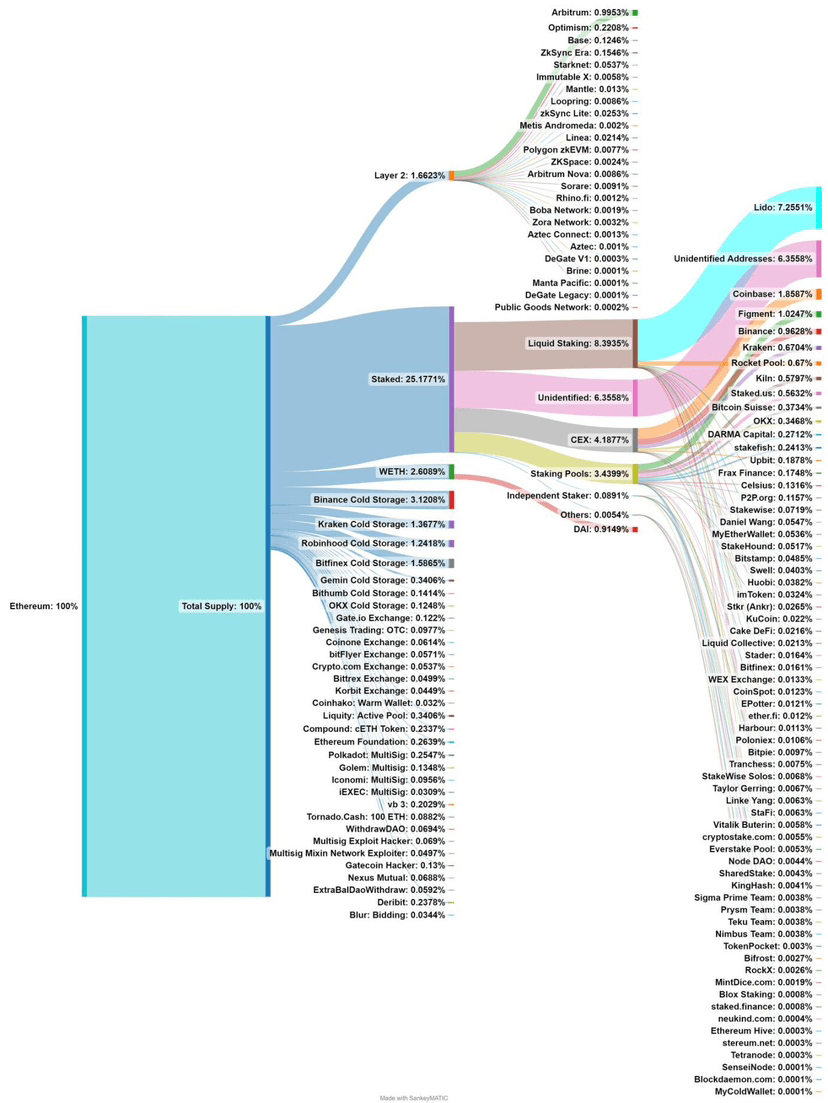
An Ethereum-obsessed user on the X platform named Eth Wave (@TrueWaveBreak) made a statistical analysis that can only be said to be completely incomplete, although it does not miss a lot. Although this statistical analysis ignores the destination of many WETH and ETH that escaped from the EVM ecosystem, it generally outlines a picture that can understand the distribution of Ethereum:
There are a lot of interesting data in this picture that are worth talking about separately.
ETH on L2 accounts for less than 2% of the total
According to the data in the figure, all ETH on L2 only accounts for about 1.66% of the total circulation of ETH, which is about 1.992 million pieces. Calculated at the Ethereum price at the time of writing this article, the total value is US$3.223 billion, accounting for 30.87% of the L2 TVL of US$10.44 billion.
The ranking of L2 based on ETH stock in this chart is almost the same as the ranking based on TVL in L2BEAT. In addition to the two giants Arbitrum and OP Mainnet, the recent development speed of Base has indeed caught many people off guard, and its TVL has exceeded zkSync Era and Starknet, which were launched earlier.
But even though L2 performs well, by comparison we can see that the ETH inventory on all L2s is only slightly higher than the inventory in Bitfinex's cold wallet, and is even only about half of the inventory in Binance's cold wallet.
Based on this, we can also conclude that as an alternative to Ethereum that significantly reduces transaction costs, L2 has not shown any signs of shaking Ethereum's position at least for now. On the one hand, it may be because the user base that is proficient in transferring assets between chains is still low, and on the other hand, it may be because there are still many irreplaceable applications on the main network.
CEX is still the main battlefield for ETH liquidity
According to the data listed in the figure, the ETH stock of identified exchanges exceeds 7%. Combined with small exchanges around the world and potential unidentified exchange addresses, the ETH stock of centralized exchanges may still be close to or even exceed 10%, although it has been on a downward trend in recent years.
This means that CEX is still the main gathering place for ETH liquidity, and the so-called "lack of liquidity" that we observe on the market with our naked eyes is likely just a decrease in users' willingness to trade frequently, and most of them may be sitting on their hands.
In addition, institutions such as Robinhood that are not cryptocurrency exchanges but have cryptocurrency trading businesses should not be ignored. For example, Grayscale, whose Ethereum fund is not mentioned in the figure, was identified by the blockchain data analysis platform Arkham as holding 3.03 million ETH, which also accounts for more than 2.5% of the total circulation.
The chips in the hands of hackers cannot be ignored
The figure also lists the holdings of some hackers, such as hackers who attacked the Polkadot multi-signature wallet, Mixin, and Gatecoin, as well as those not listed, such as the notorious North Korean hacker group Lazarus Group. However, those not listed may have deposited the stolen assets in mixers including Tornado.Cash, or stored them in different addresses, making it difficult to identify them all in a short period of time.
Staked Ethereum
The staked ETH has accounted for more than 25% of the total circulation of ETH, and this number may continue to rise in the foreseeable future. Among the staked ETH, 1/3 is deposited in the liquidity staking protocol, and more than 86% of this 1/3 is in Lido. In the field of staking, although centralized exchanges have also taken a share and launched the Liquidity Staking Token (LST), it seems that their popularity is far less than that of decentralized protocols, and the staked amount is only half of that of the LSD protocol.
Liquidity staking is a track that may be far more complicated than it seems. It is not simply about obtaining an equal amount of tokens representing the staked share after staking. How to be more decentralized to avoid risks, how to reduce the amount of ETH deposited by users, how to use LST to maintain the security of other networks (re-staking), etc. are all areas worthy of in-depth research.
On the other hand, liquidity pledge is essentially a leveraged behavior. The current use of LST as collateral for lending and the issuance of decentralized stablecoins by many LSD protocols through LST have further amplified the leverage. In the future, if the scale is large enough and the market is extremely extreme again, whether there is enough liquidity to liquidate these assets is also a problem we need to prepare for.
As the author said, this chart is not perfect. For example, exchanges, WETH on L2, DEX, etc. are not counted. In addition, in the DeFi field, the chart only shows the proportion of Compound's cETH and DAI (MakerDAO) minted by pledging WETH. Other large DeFi protocols such as Aave, Curve, and Uniswap are not included. The author said that this chart will be continuously improved in the future, and he also expects that the improved chart will have more information worth exploring.