

The information, opinions and judgments on markets, projects, currencies, etc. mentioned in this report are for reference only and do not constitute any investment advice.
Macro Market
Walk to the end of the water, sit and watch the clouds rise.
In September, the market was secretly brewing clues of recovery amidst the despair.
The global macro-financial market is not optimistic. The Nasdaq, which is highly correlated with the crypto asset market, even experienced its biggest drop this year, falling 5.81% in August after a 2.17% drop in August. The Fed has not yet made a dovish statement on rate hikes, and some market voices predict that there will be another rate hike this year. In addition, high valuations also continue to put pressure on the market.
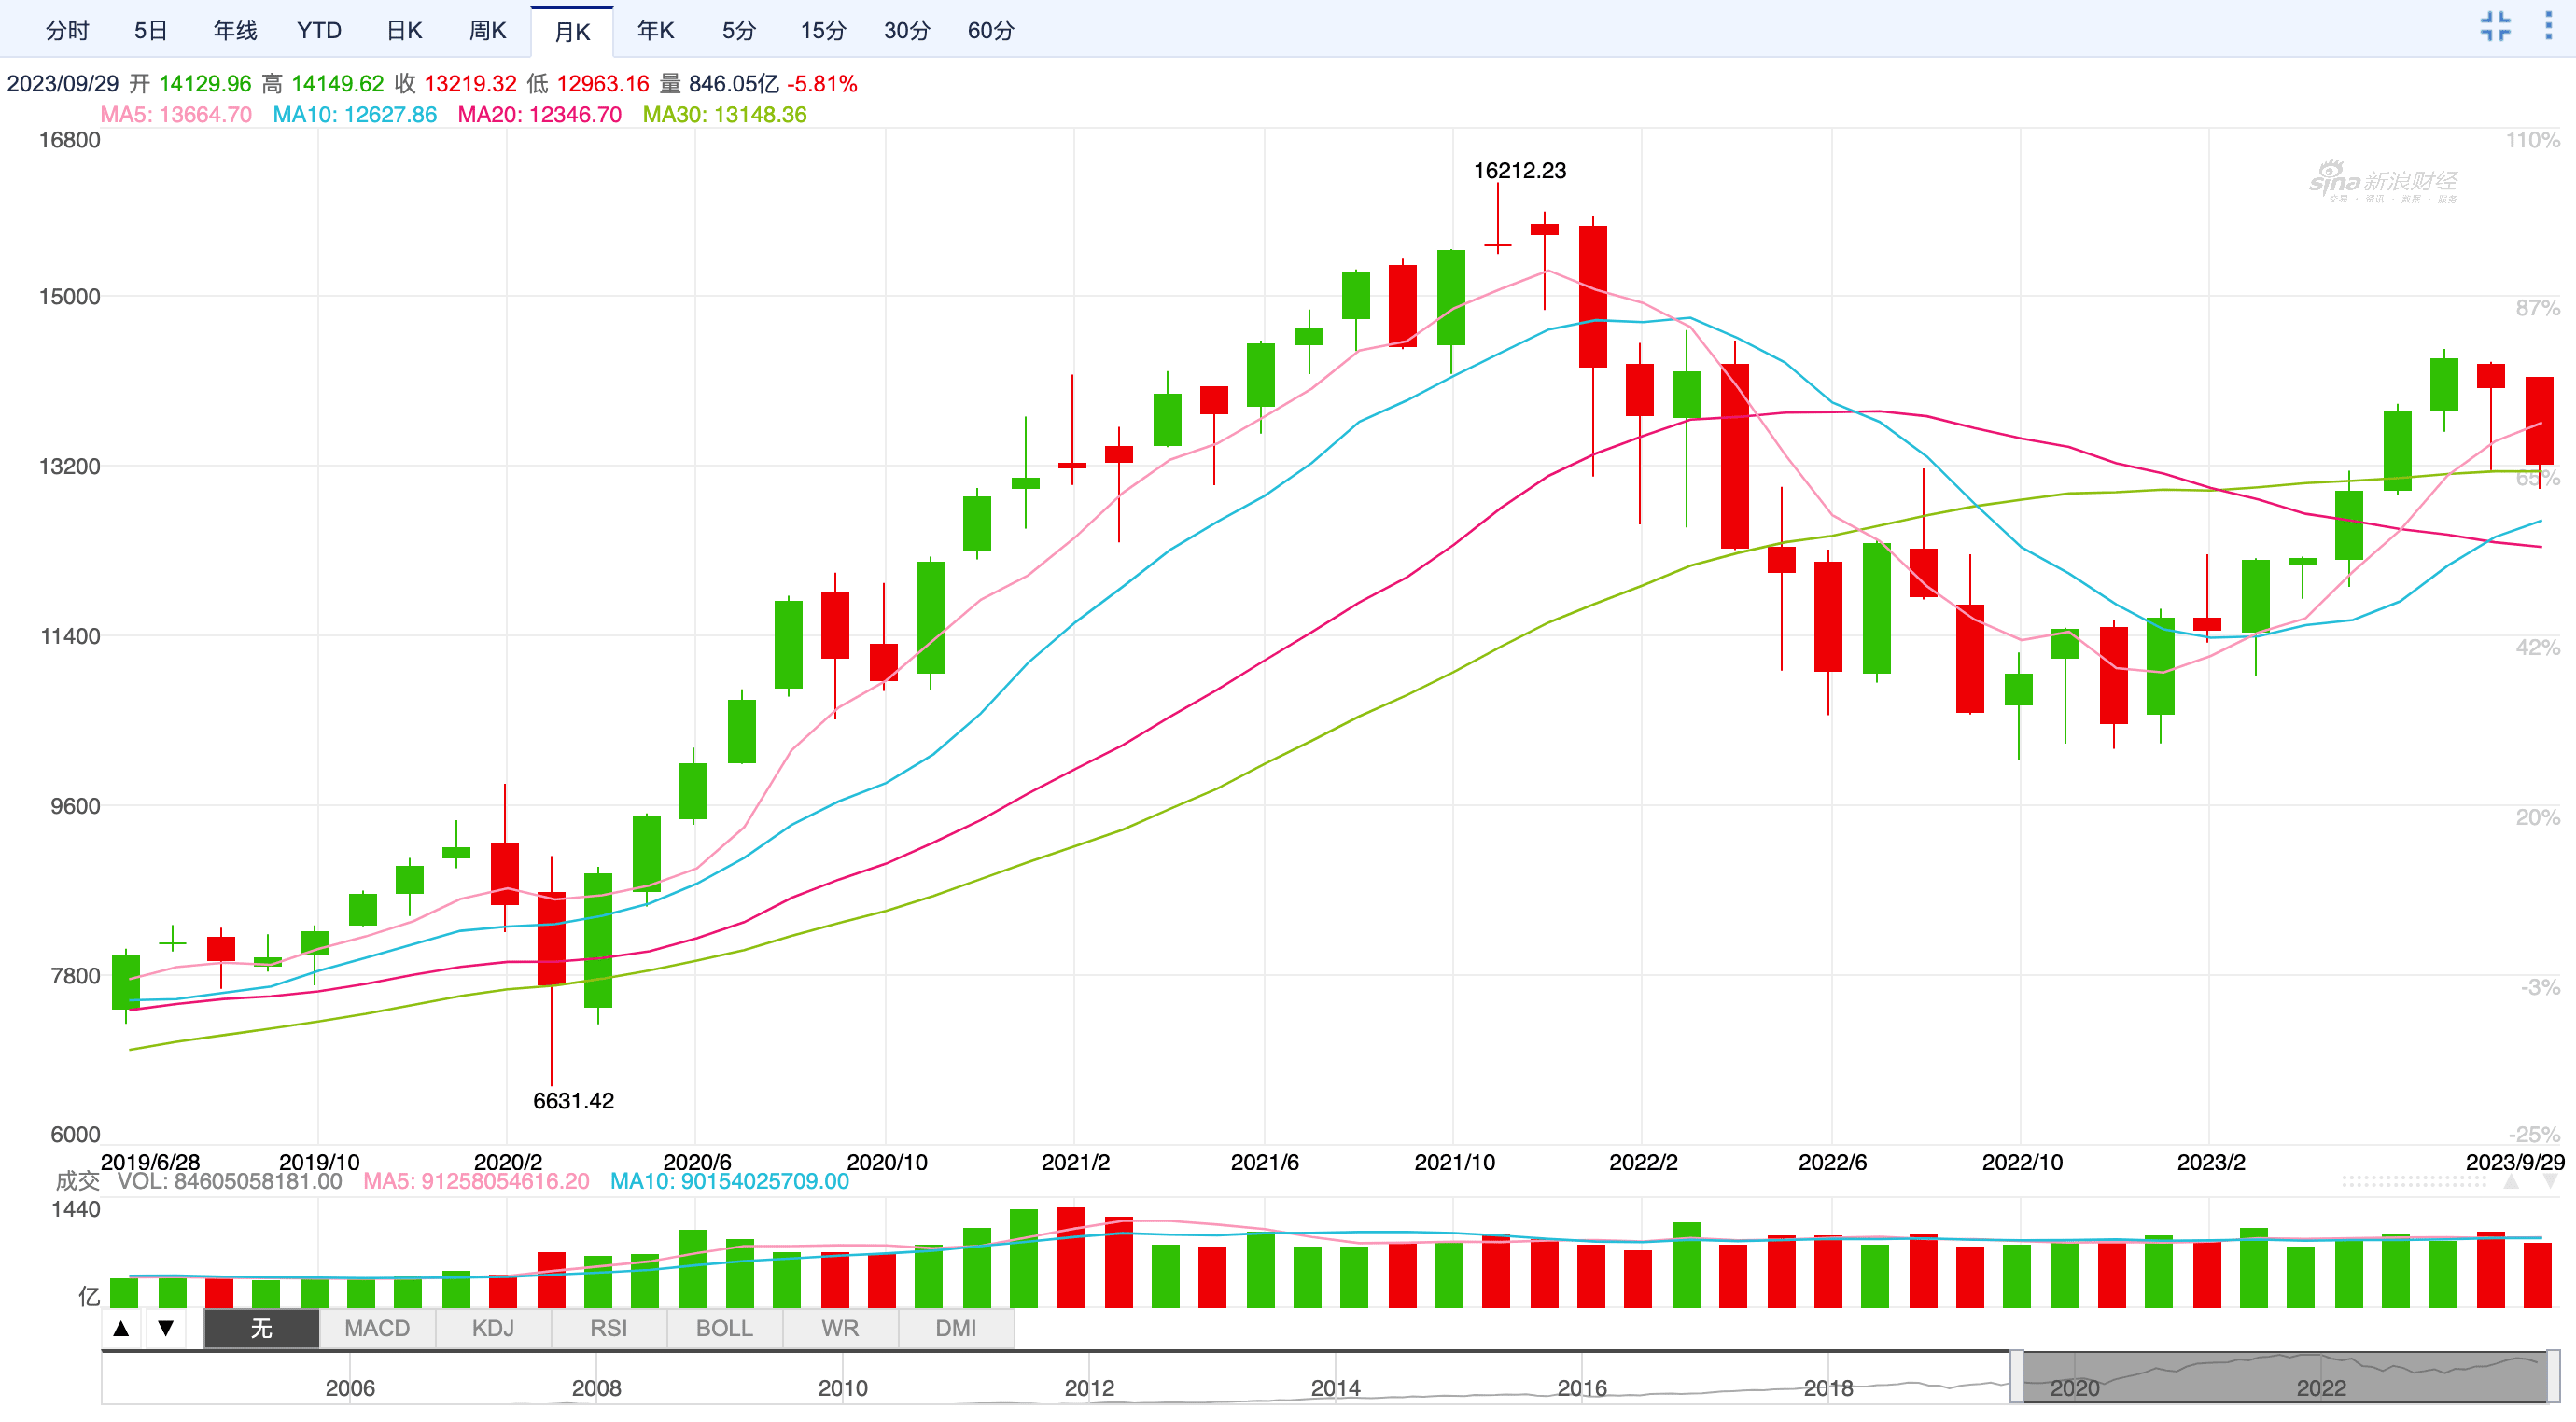 Nasdaq monthly trend
In contrast, the crypto asset market, which adjusted before Nasdaq, stabilized first. In September, the BTC amplitude dropped from 17.6% in August to 10.03%, achieving a 3.97% increase within the month.
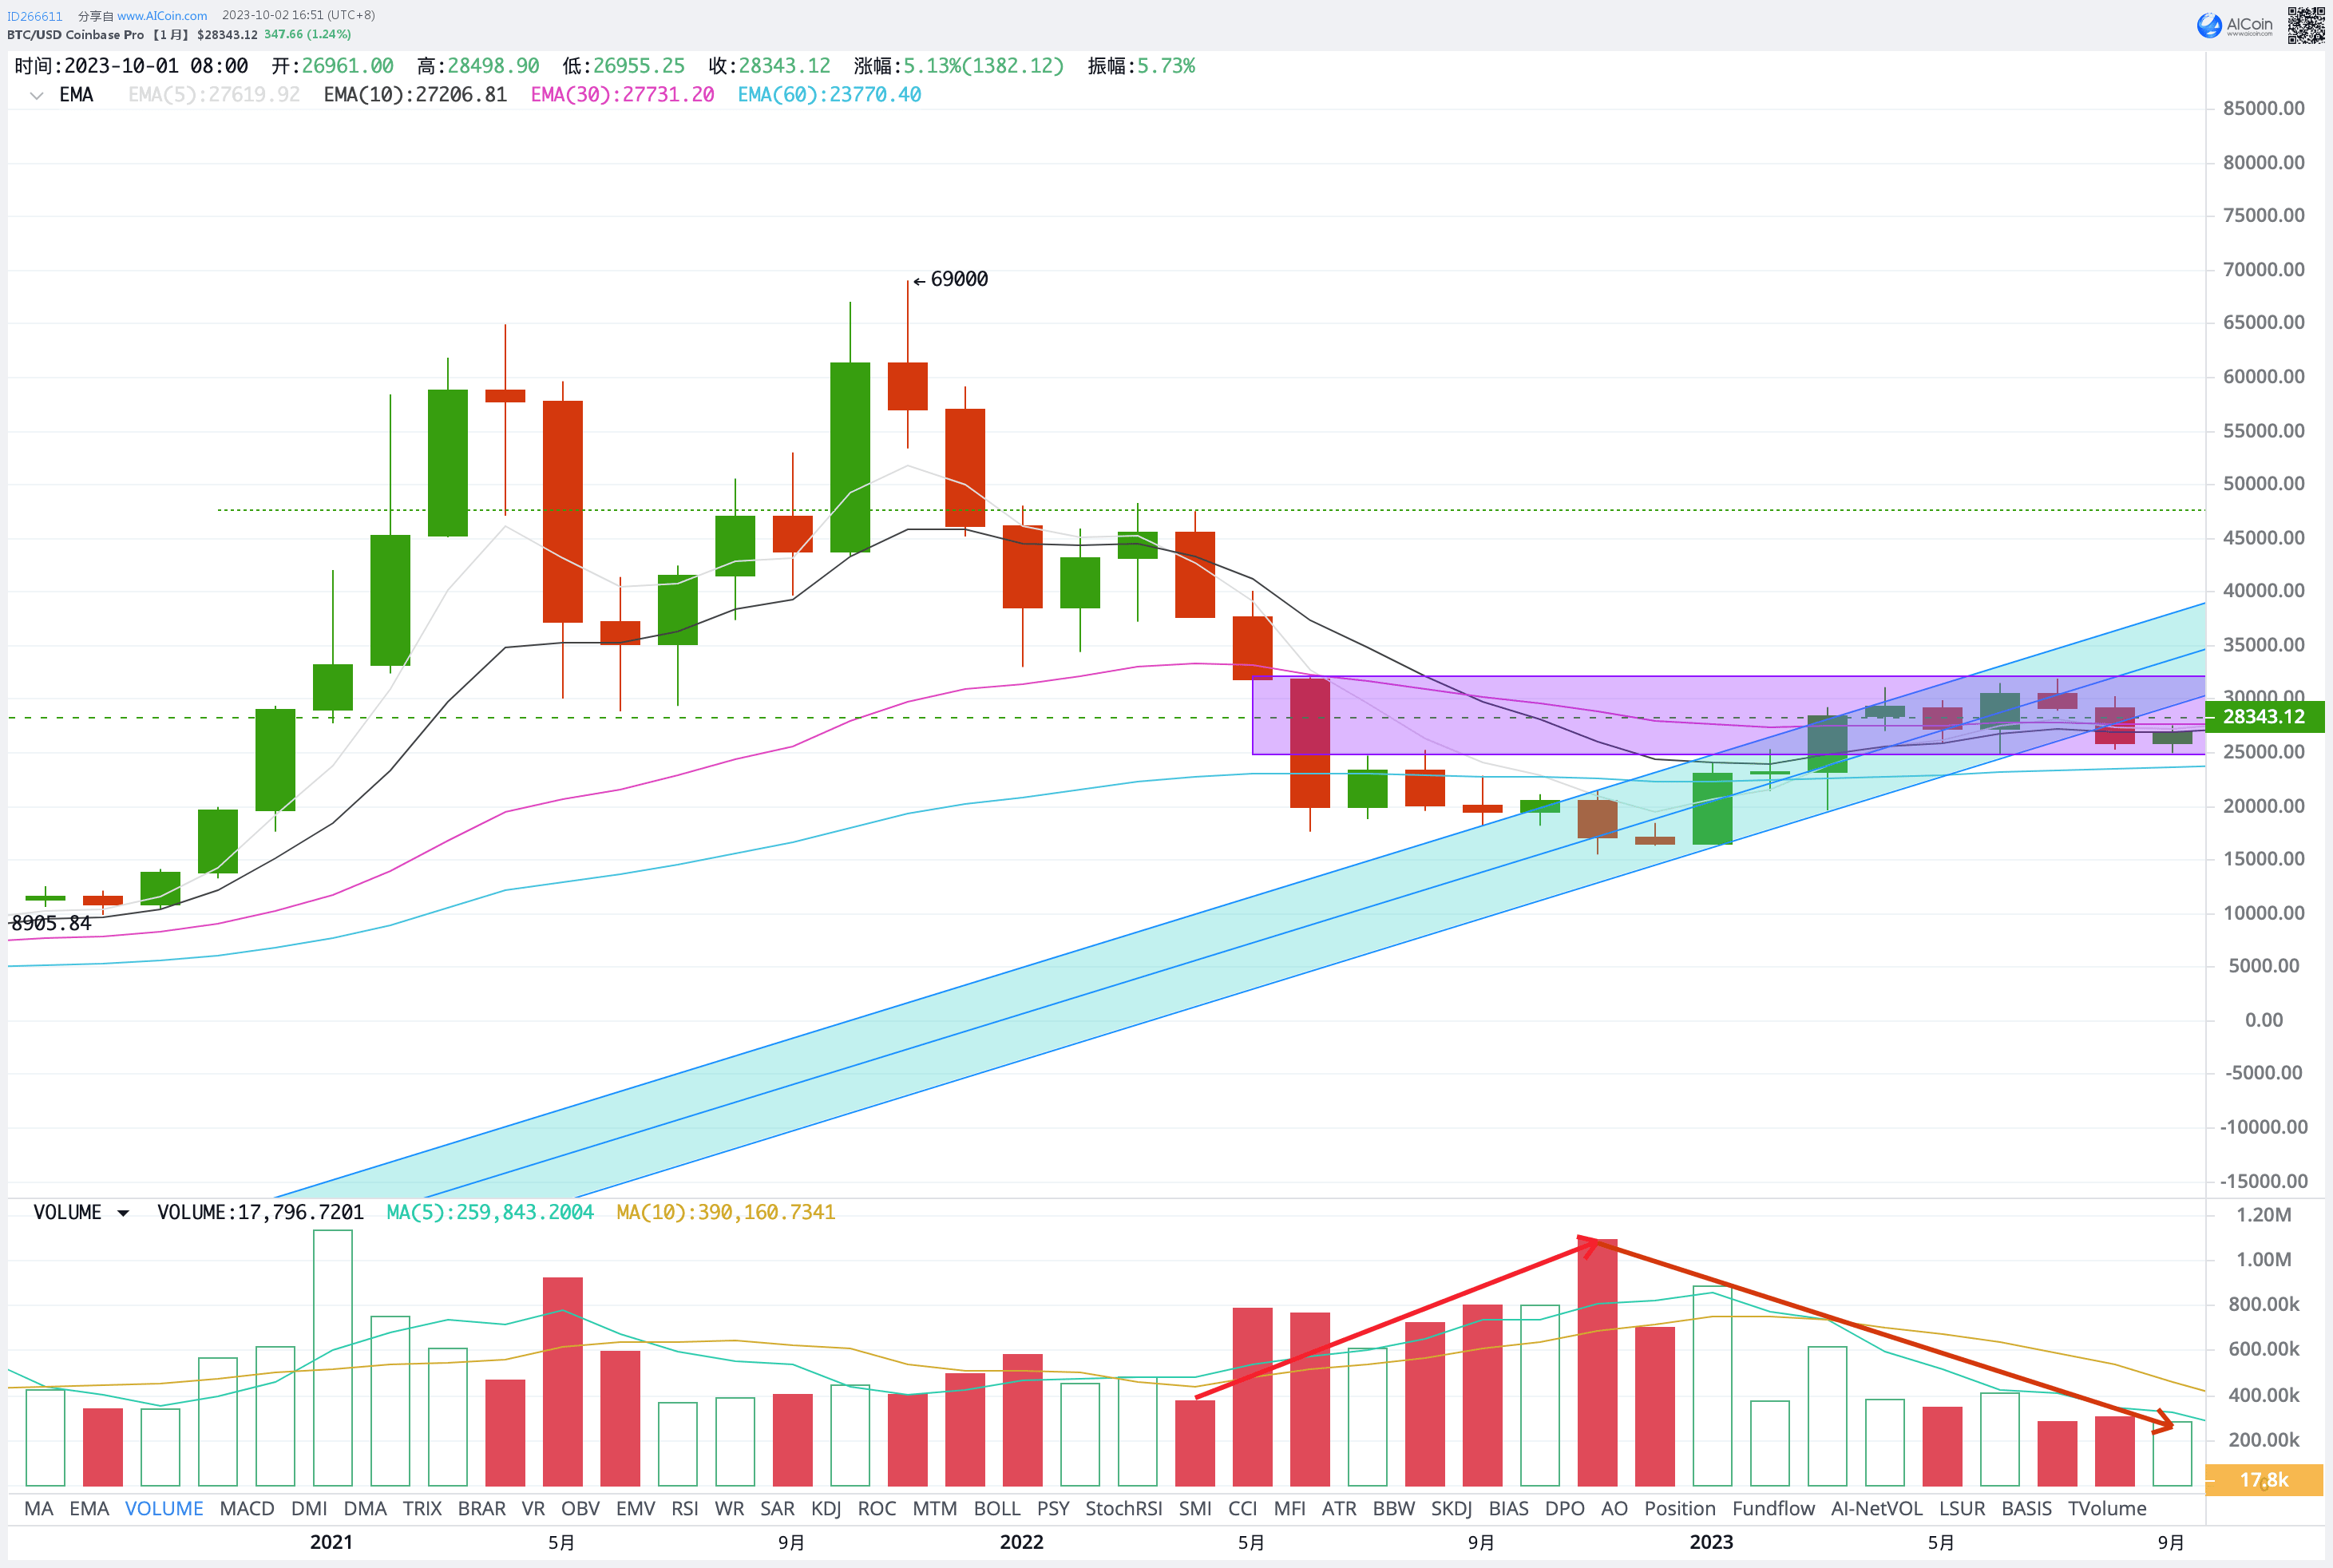 BTC monthly trend
There have been certain positive changes at the funding level. In September, the overall outflow of stablecoins was about US$900 million, a significant decrease compared to the outflow of US$1.4 billion in August, but the outflow trend has not been reversed.
On-chain data continues to show positive signs, hitting the second-highest number of new addresses in history on September 15.
The long-short game continues to "go from short to long", continuing to reduce liquidity.
Based on multi-dimensional information, EMC Labs maintains its optimistic estimate for August and judges that bulls will take active actions in Q4 to challenge the annual high of $32,000 again and are expected to win.
Crypto Market Trends
In September, BTC opened at $25,931 and closed at $26,961. On September 11, it tested the effectiveness of the lower edge support of the box through a large-volume decline. The next day, it completely recovered the lost ground with a large-volume attitude, and continued to rise in the following week. The lower edge of the box was carved on June 14, and it was strongly recovered again after a three-month decline, indicating that the funds in the market have reached a consensus that $25,000 is the mid-term bottom.
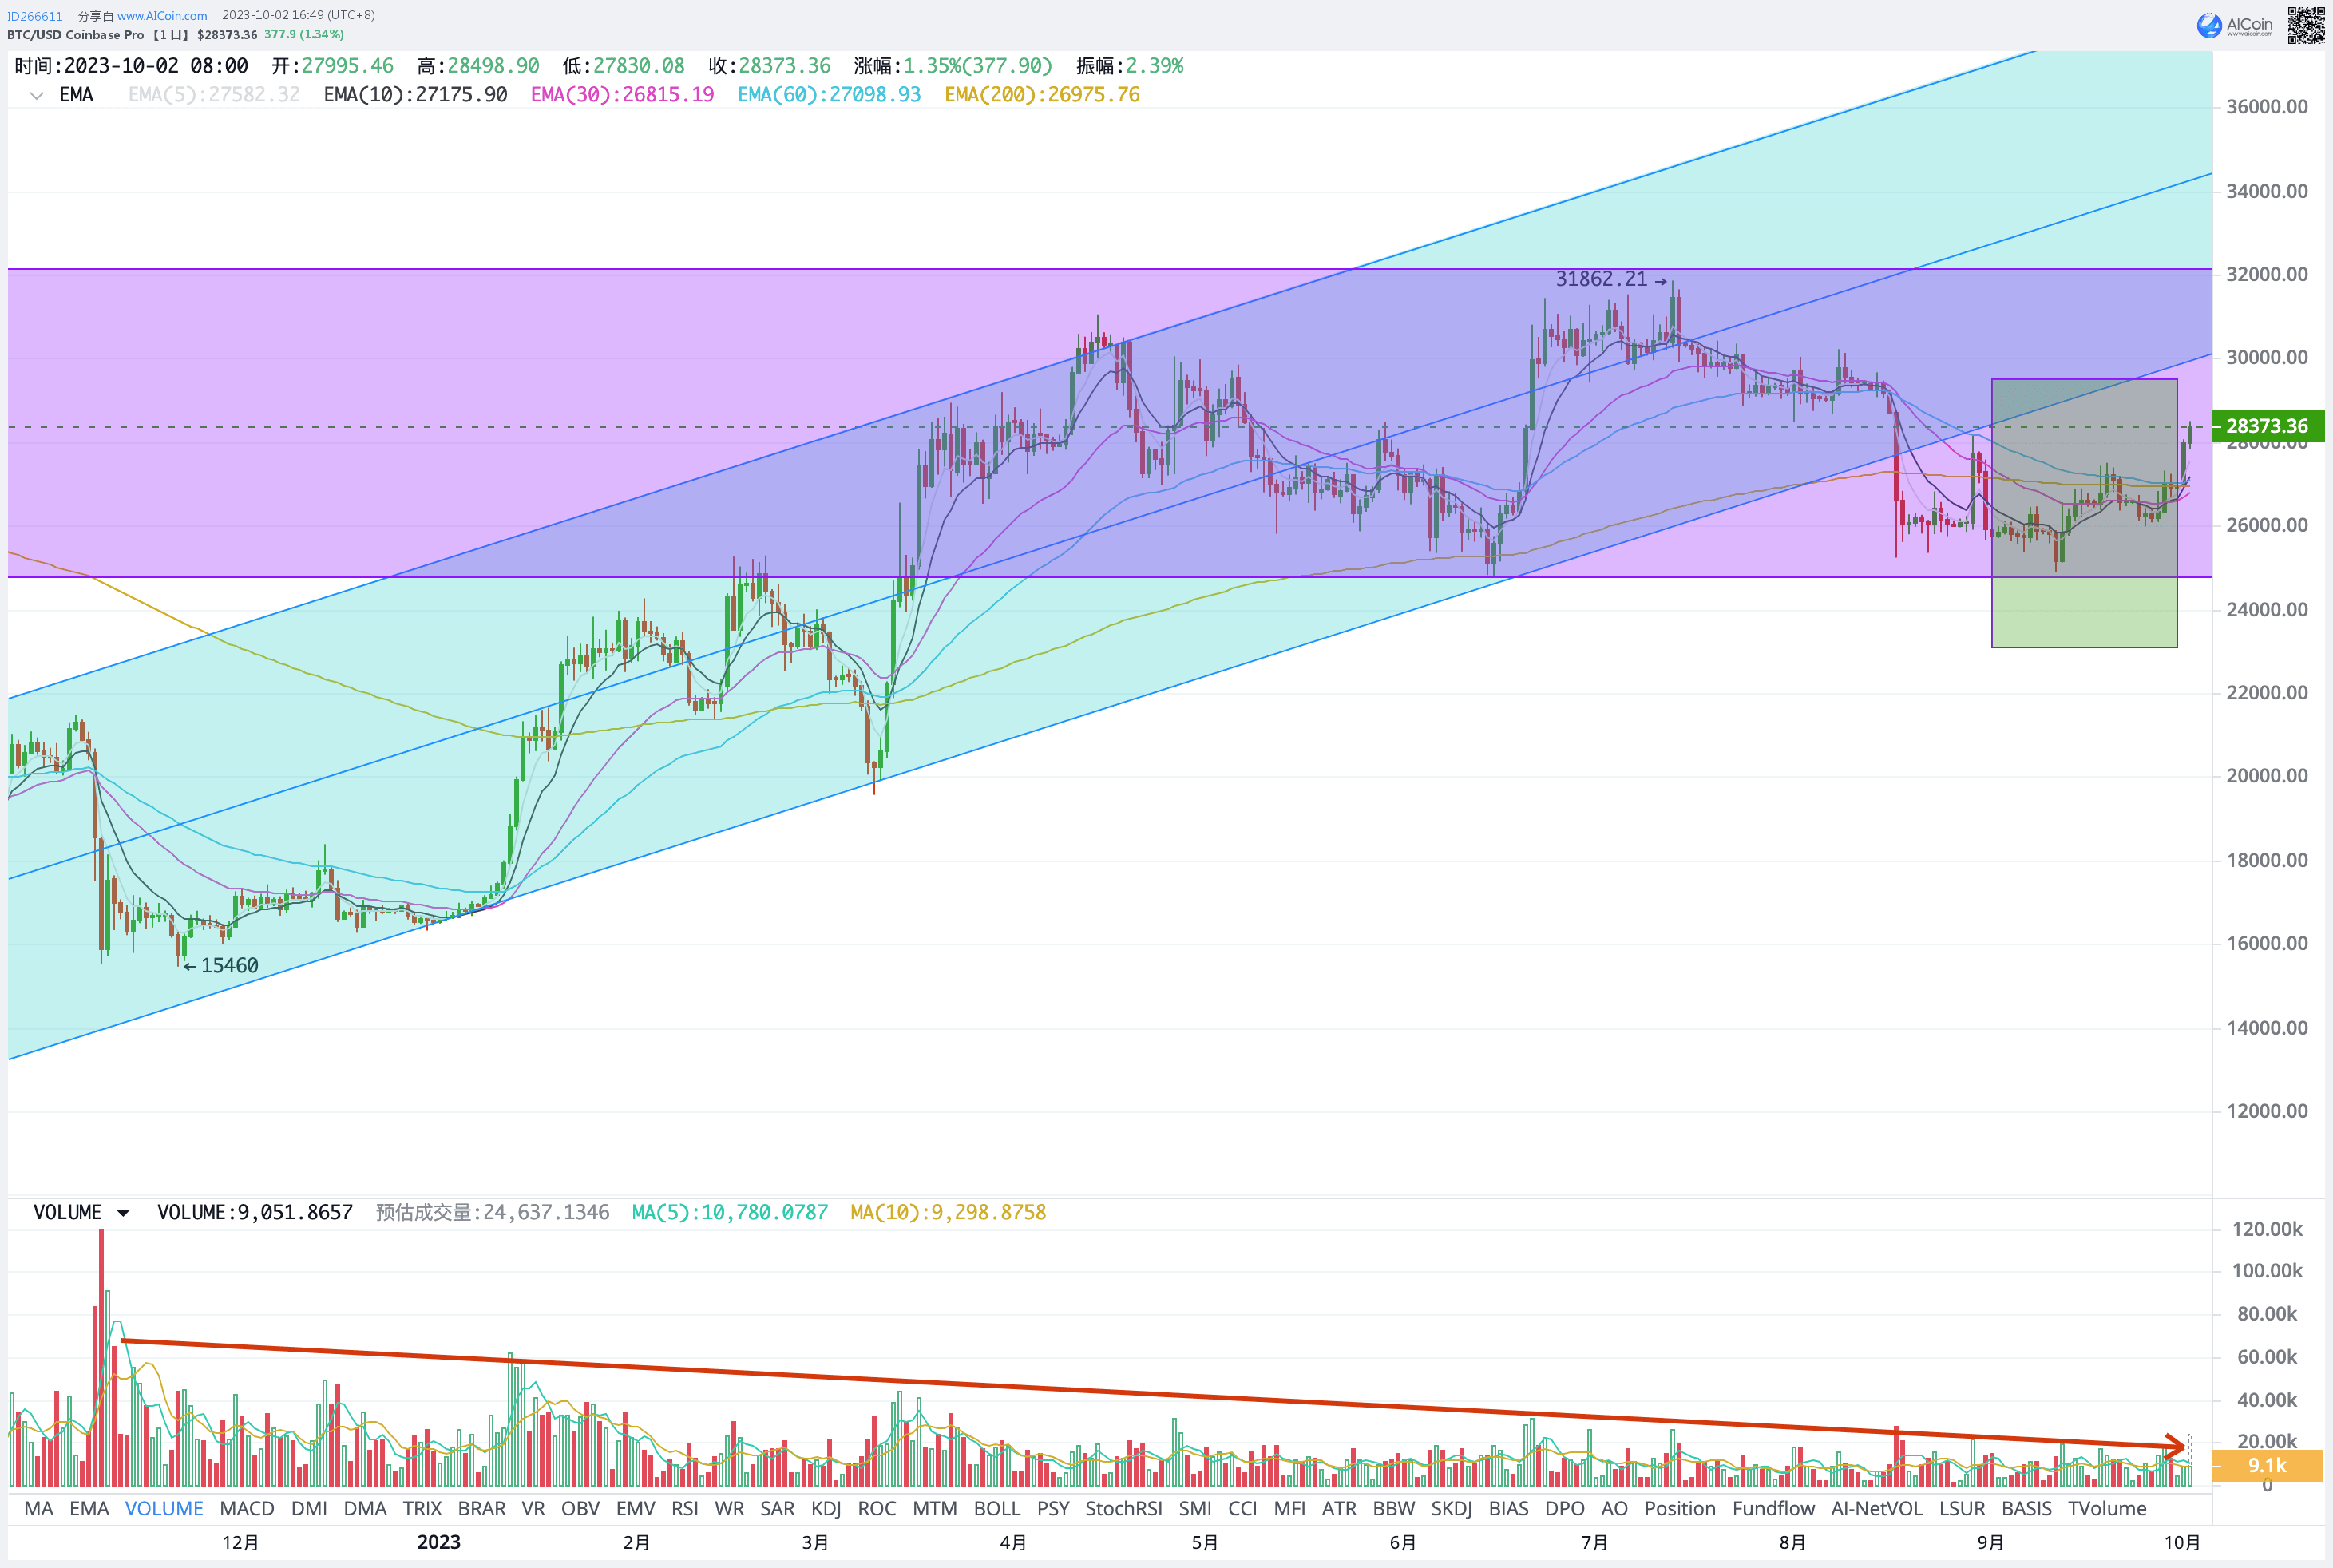 BTC daily trend
In April and June-July this year, BTC launched two rounds of attacks on the upper edge of the $32,000 box. However, under the background of macro market instability, funds continued to flow out of the market, and short-handed whales that entered the market at the beginning of the year took profits, causing BTC to be trapped in the $25,000-32,000 box for half a year.
This time, it rebounded quickly after hitting the lower edge of the box again (it had rebounded quickly to US$28,000 as of the time of writing this report), indicating that with the market fully adjusted, on-site funds are ready to take active action in Q4 and may challenge the annual high of US$32,000 in the near future.
Long-Short Game
The position structure is the mainstay of the market. To determine the long-term trend of the market, we continue to focus on the size of long and short positions.
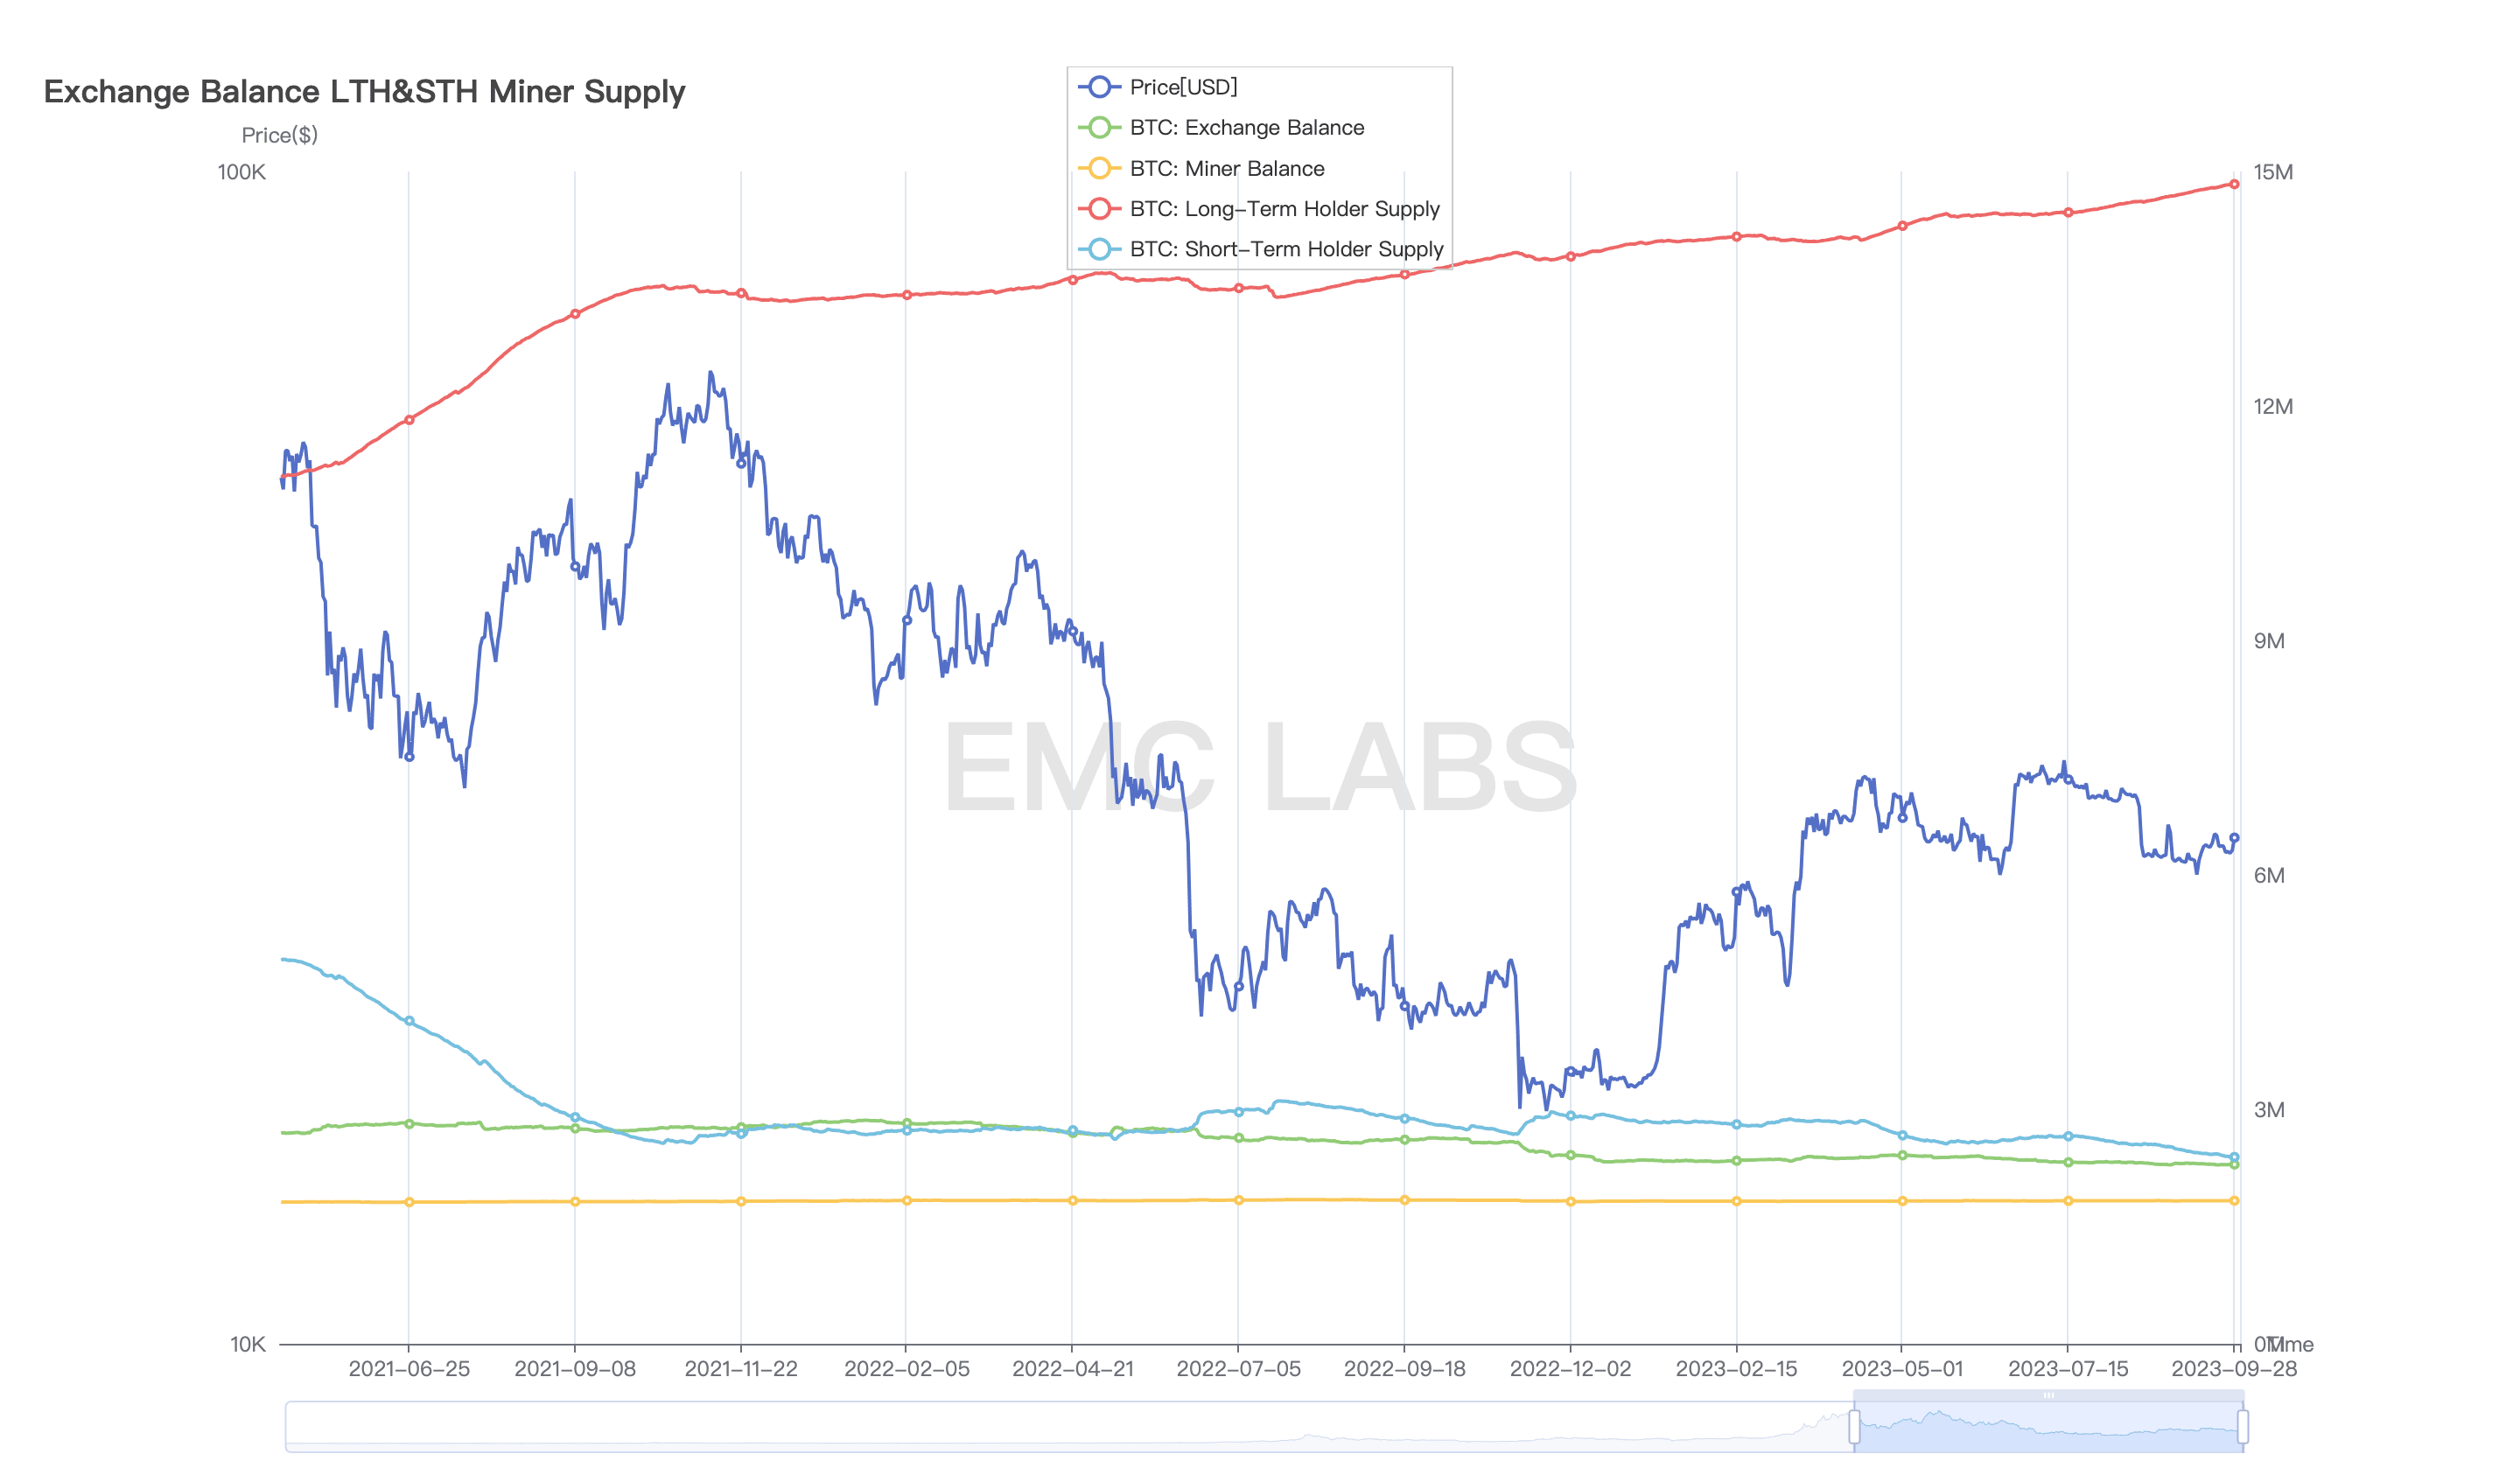 Position size of market parties
In August, long-term holdings increased from 14.69 million at the end of July to 14.84 million, a net increase of 150,000.
Short positions decreased from 2.52 million at the end of July to 2.39 million, a net reduction of 130,000.
The exchange balance decreased by 2,000, leaving 2.29 million.
In July, long positions increased by 96,000 coins, in August by 150,000 coins, and in September by another 150,000 coins. Short positions sold 130,000 coins on top of the 90,000 coins sold last month.
The comparison between the two once again shows that the essence of the repair period is that the market realizes the transition from short (hand) to long (hand) through the continuous decline in prices.
The continuous loss of liquidity is one of the driving forces behind the market's rise. The effect of going from short to long is to achieve the loss of liquidity through changes in the market's position structure.
Supply Trends
As of the end of September, the overall floating profit of the market has gradually recovered, rising from 27% to 33%. The floating profit of long-term positions has increased from 27% to 30%, while the floating loss of short-term positions has increased from 8% to 3%.
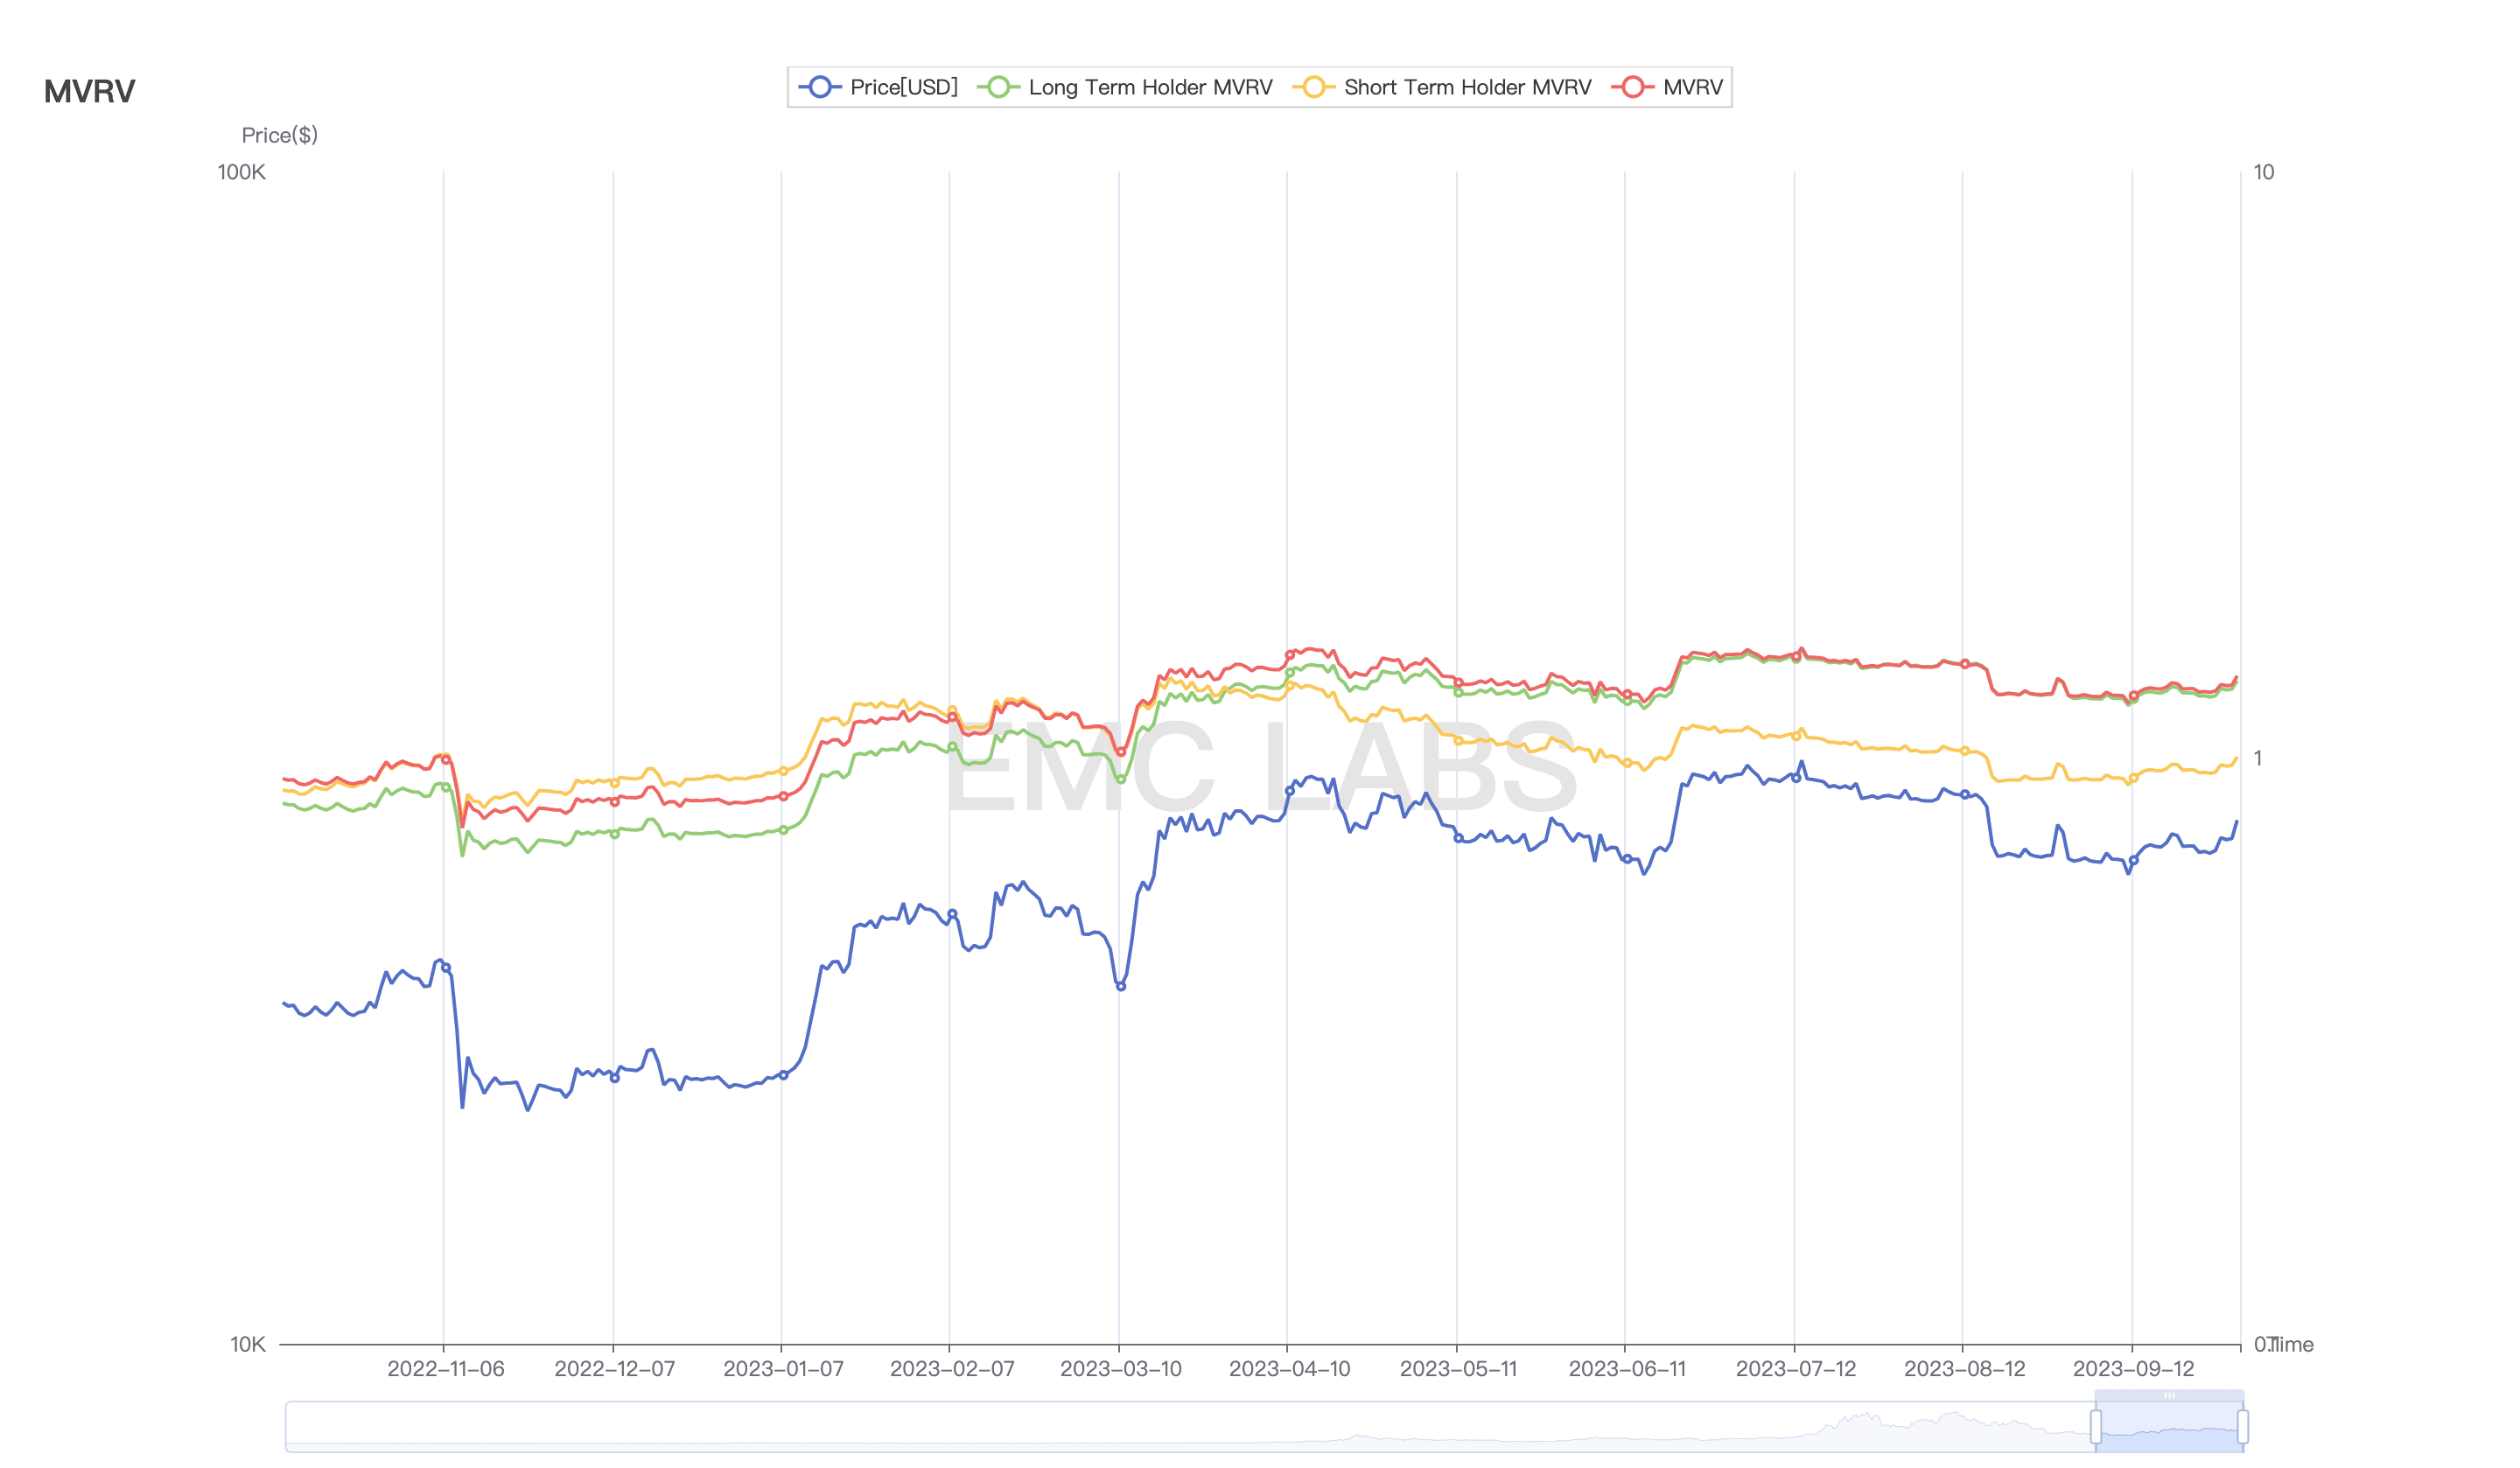 Market supply pressure
We further examine the profit or loss when selling BTC long and short.
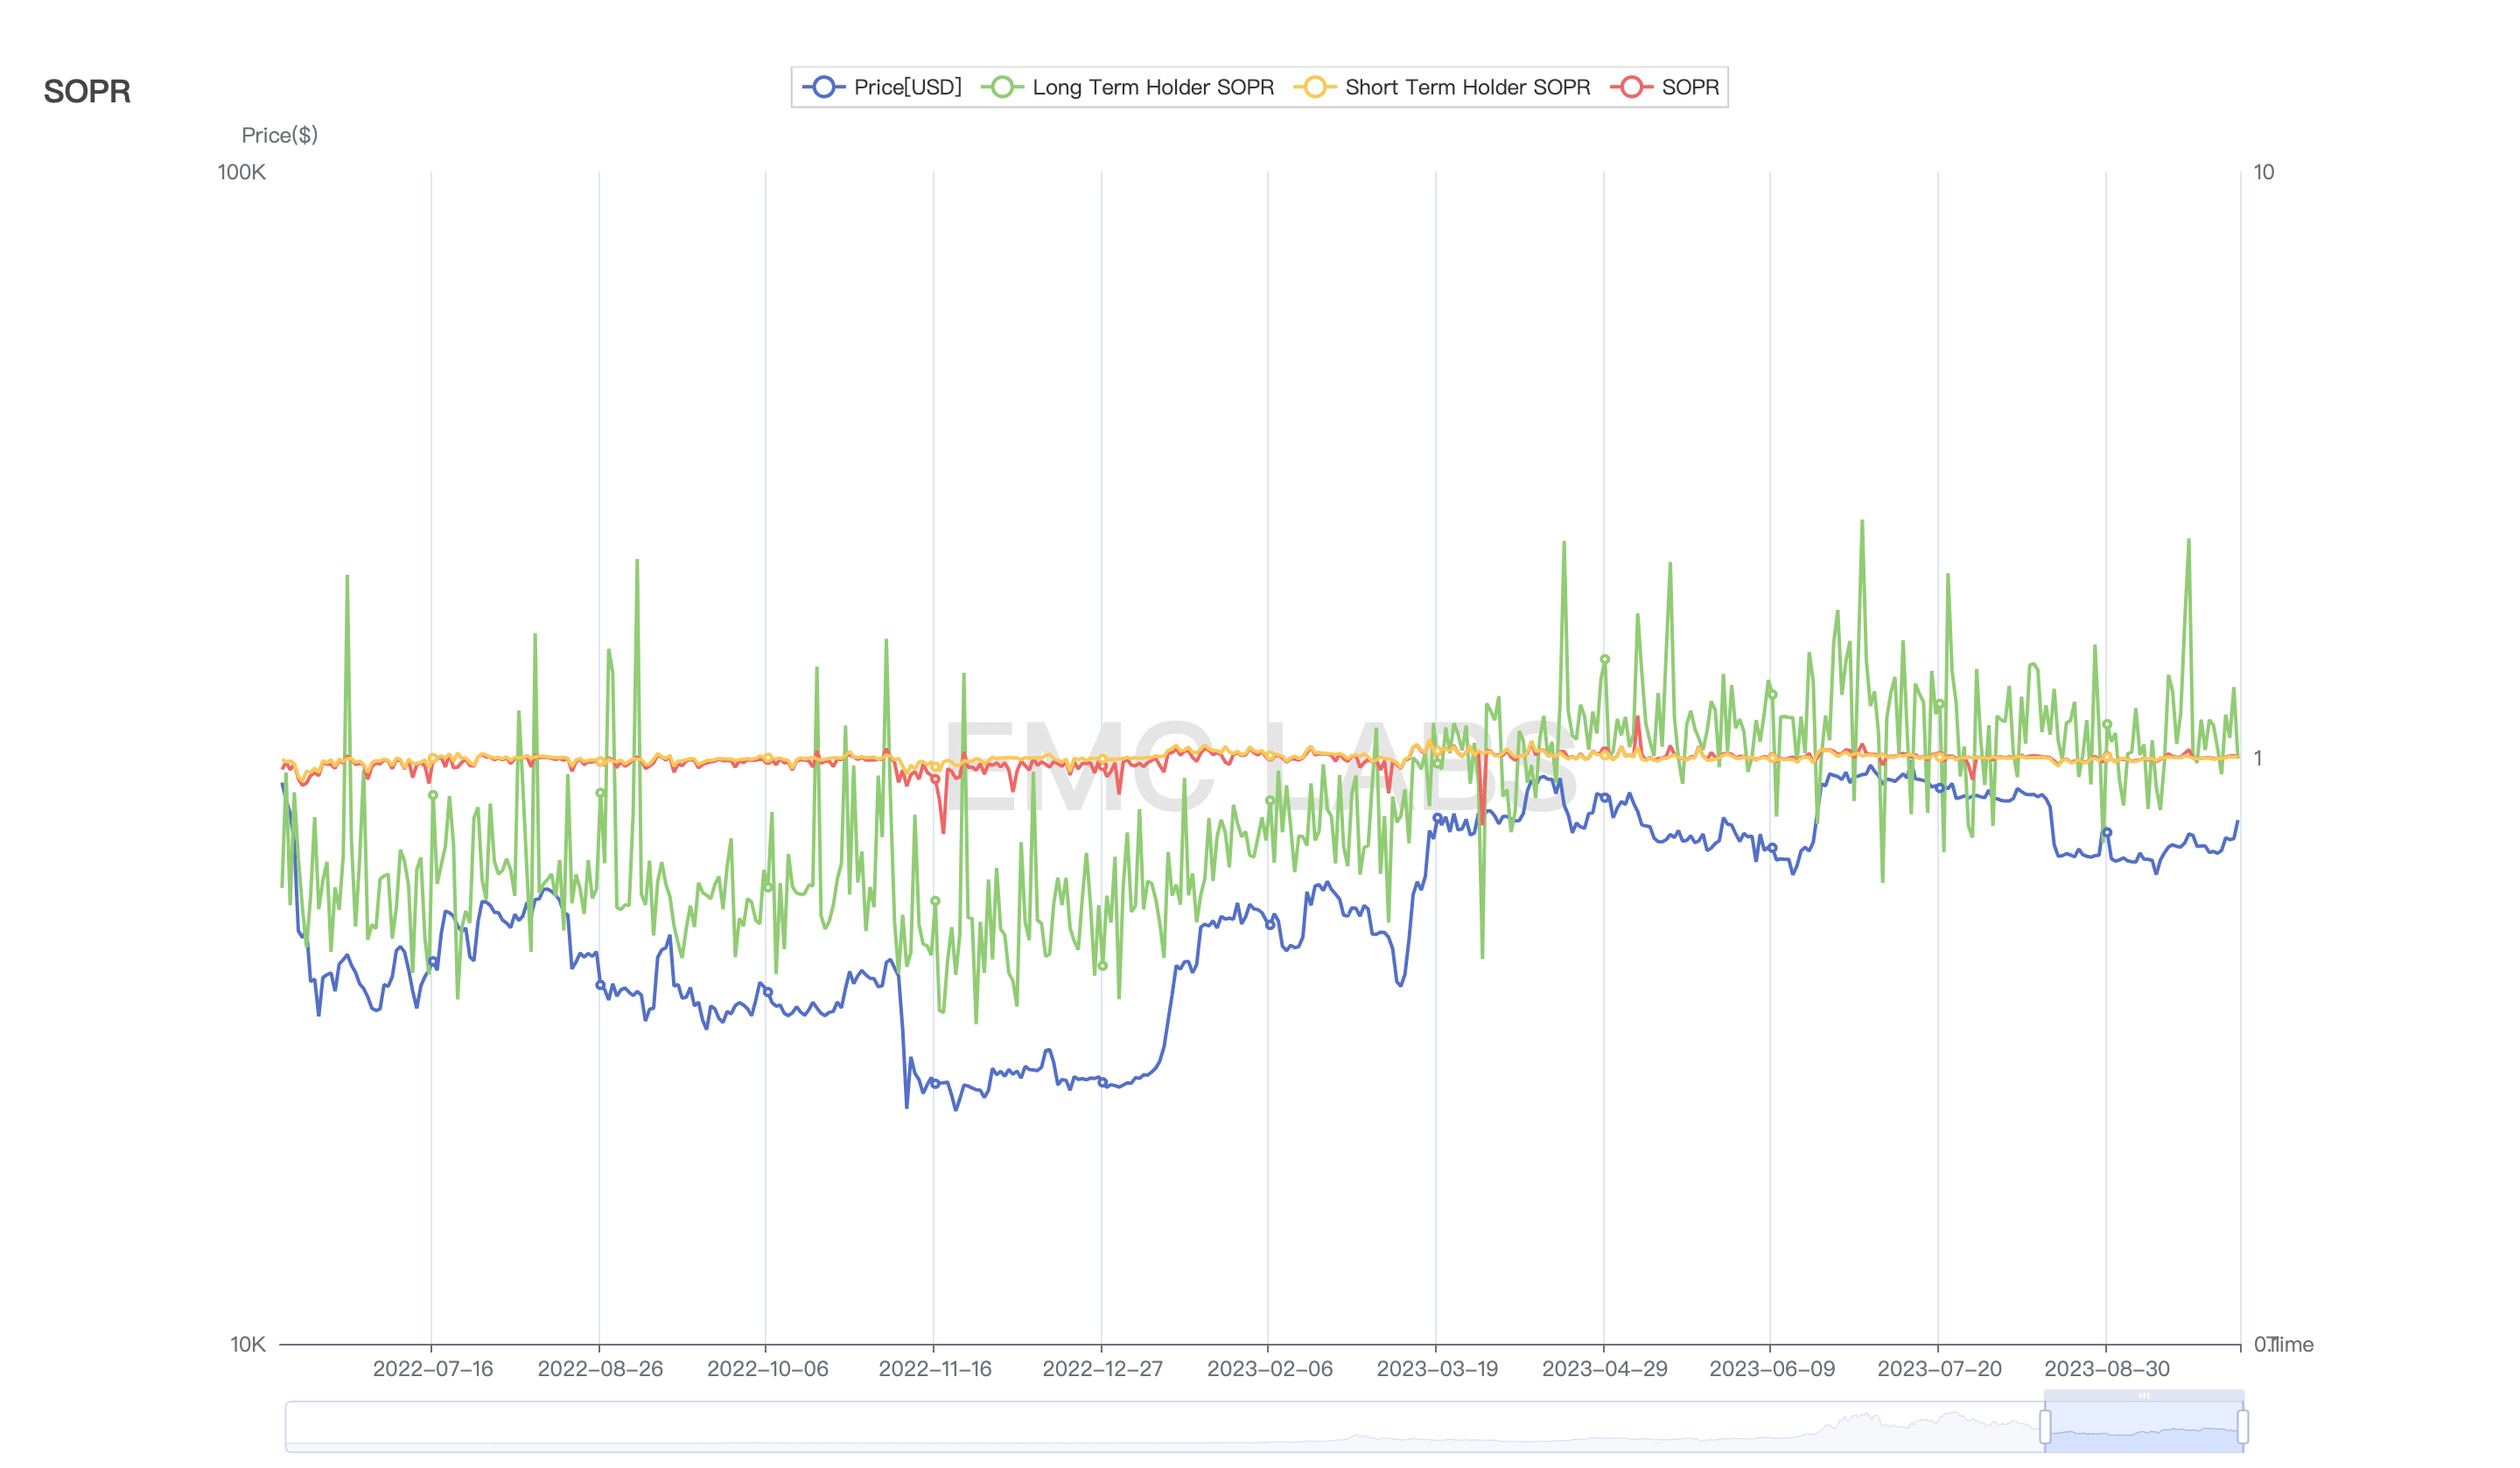 BTC sales profit and loss
In September, short-term traders traded at a loss or a small profit most of the time, while long-term traders showed differentiation. The decline in early September caused some long-term traders to sell at a loss, while in the second half of the month, most long-term traders traded at a profit.
It is worth noting that on September 19, long-term investors realized a profit of 137% in a single day. In April and July, long-term investors sold at high profits twice, and the market chose to gradually fall after that. This time in September is slightly different. So far, the market has chosen to rise rather than break.
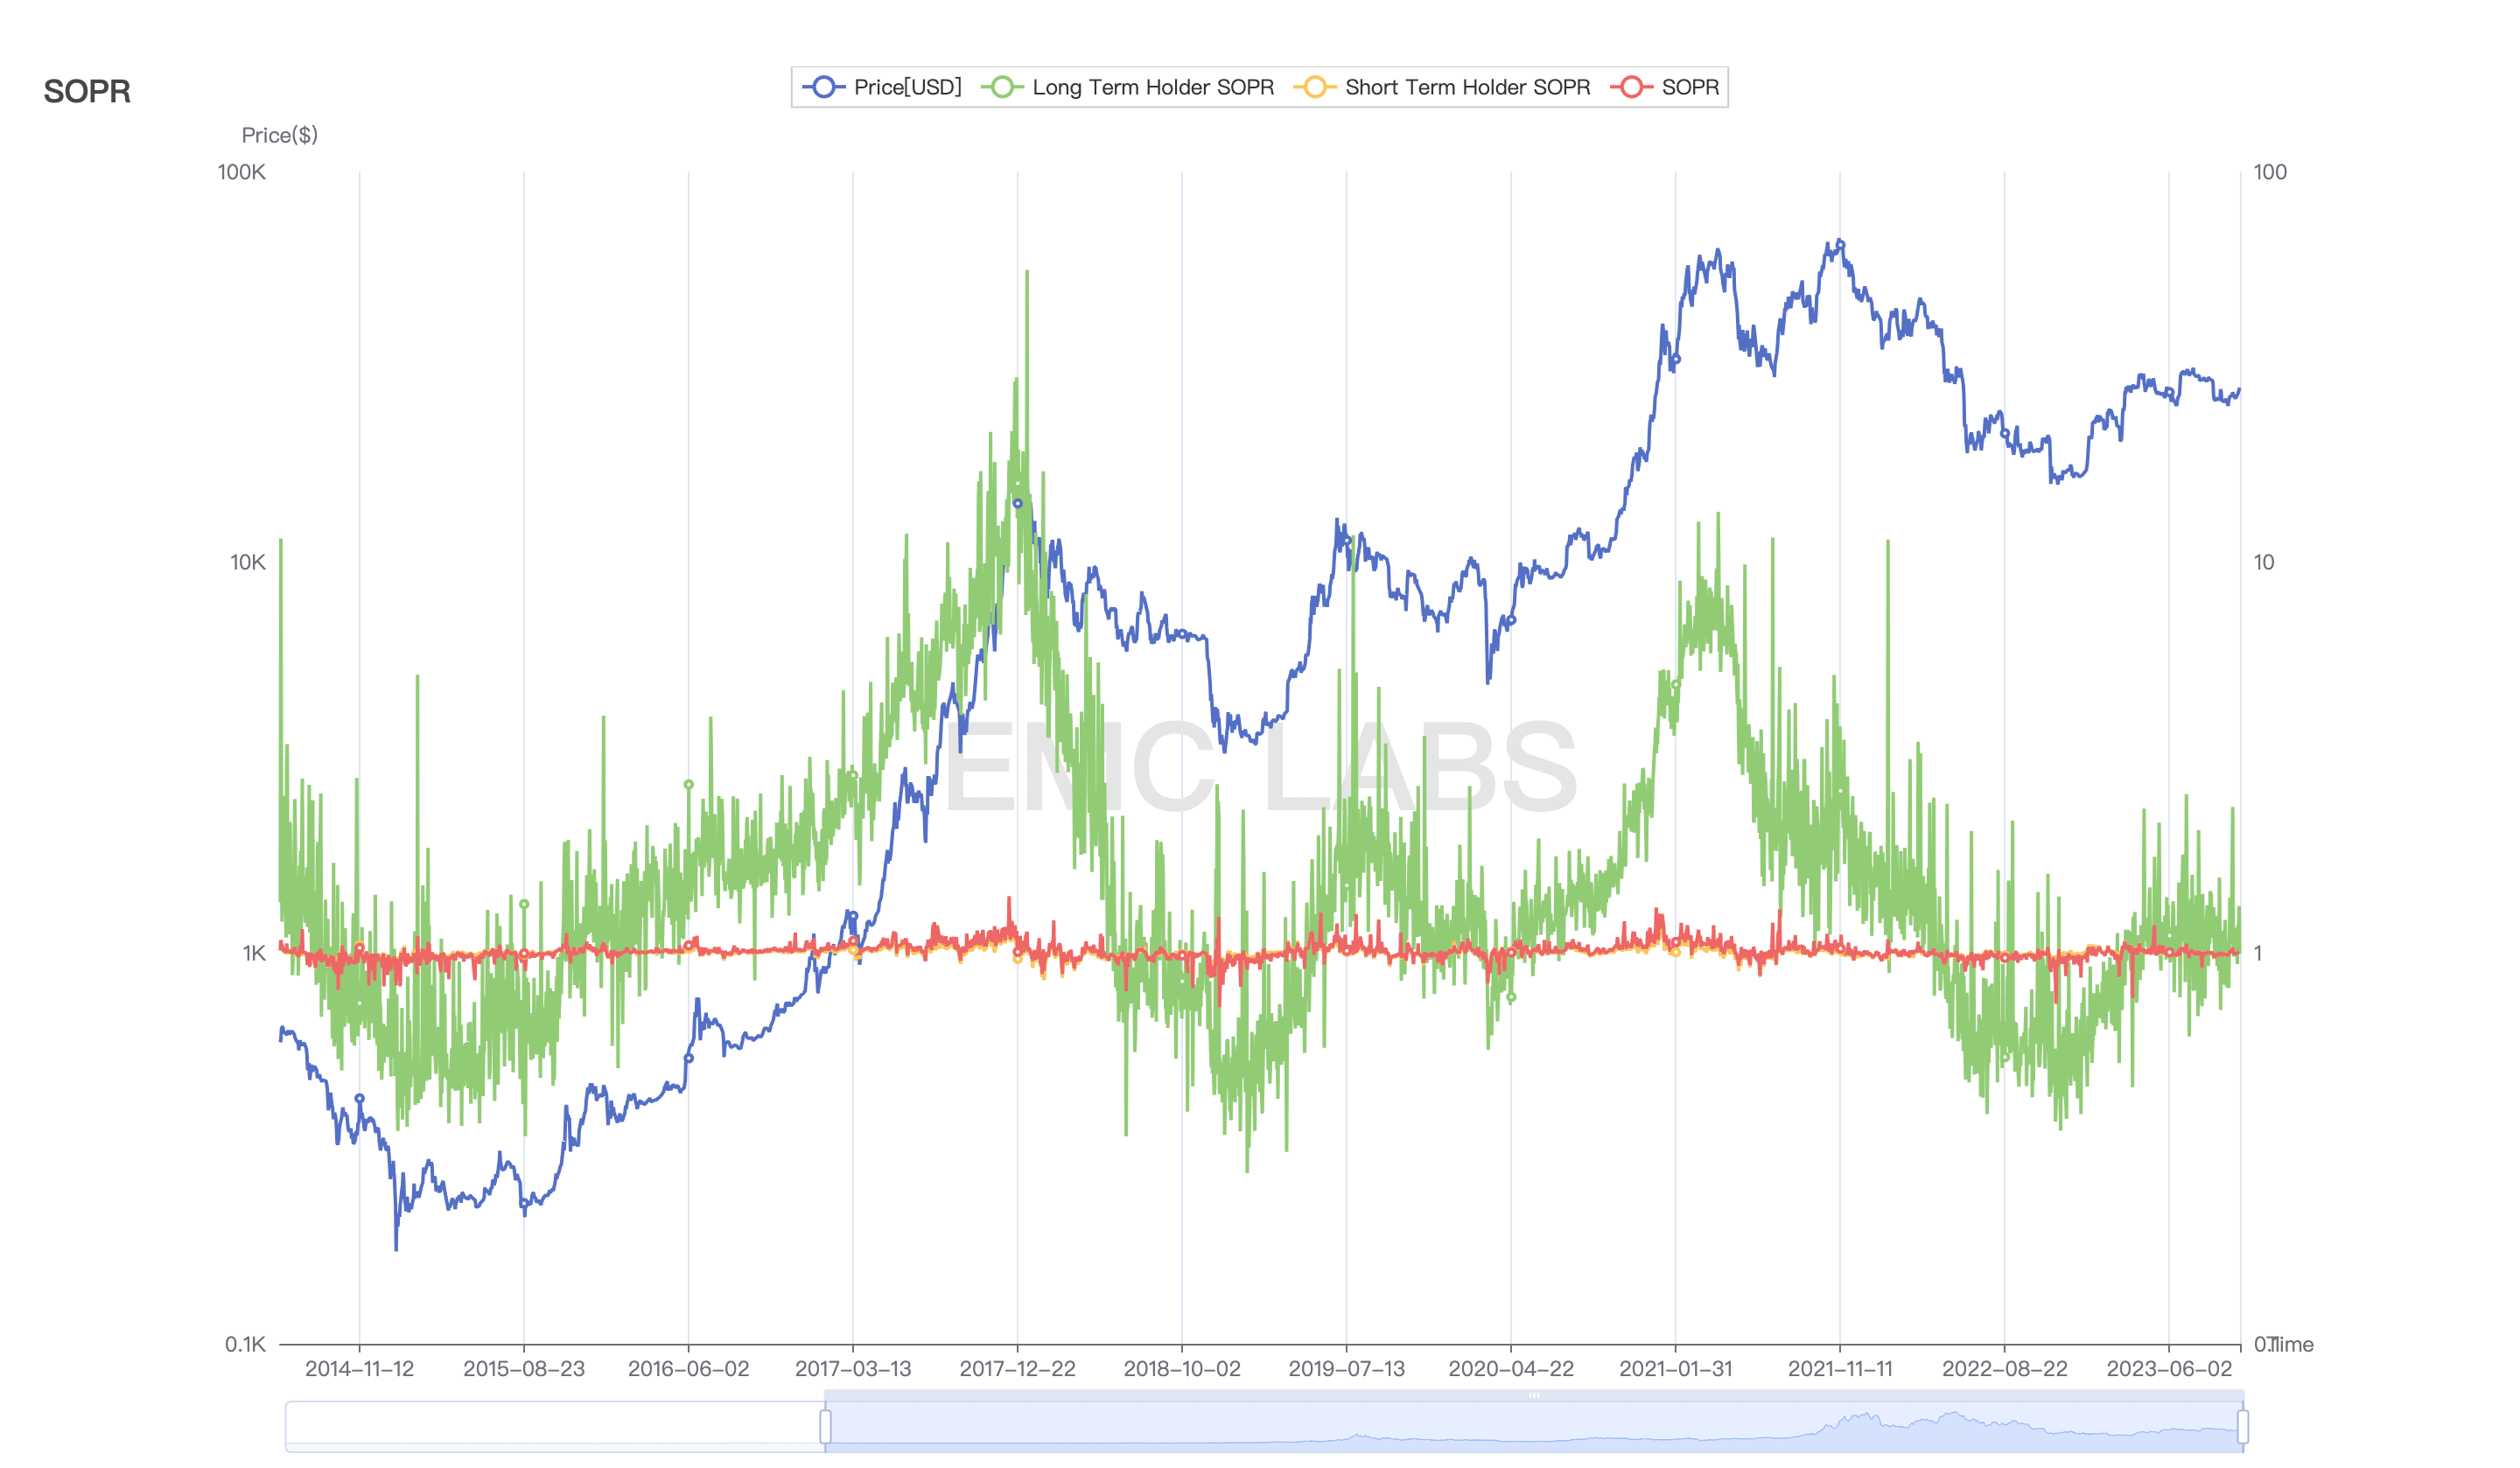 BTC Parties SOPR
During the repair period, in order to clear liquidity and prepare for the bull market, not only short-term investors need to hand over their chips, but also short-term investors in long positions need to hand over their chips. At the same time, the profit ratio of long positions is also a basis for judging the stage of the market. When the market enters the repair period from the bottom area, the SOPR (sale profit ratio) of long positions begins to turn positive. After a period of shock (even briefly turned negative in 2020), the SOPR of long positions begins to rise steadily. At this time, the market has entered the bull market range. Depending on the strength of their will, long positions begin to line up to take profits.
For now, the long-term SOPR fluctuations are within the normal range, and the rising period has not yet arrived.
Whales Sell
In the July and August briefings, we believed that the whale group (entities holding more than 1,000 coins) dominated the adjustments in July and August. After the decline in August, the whale group increased its selling power again in September, and the daily selling volume gradually approached that of July.
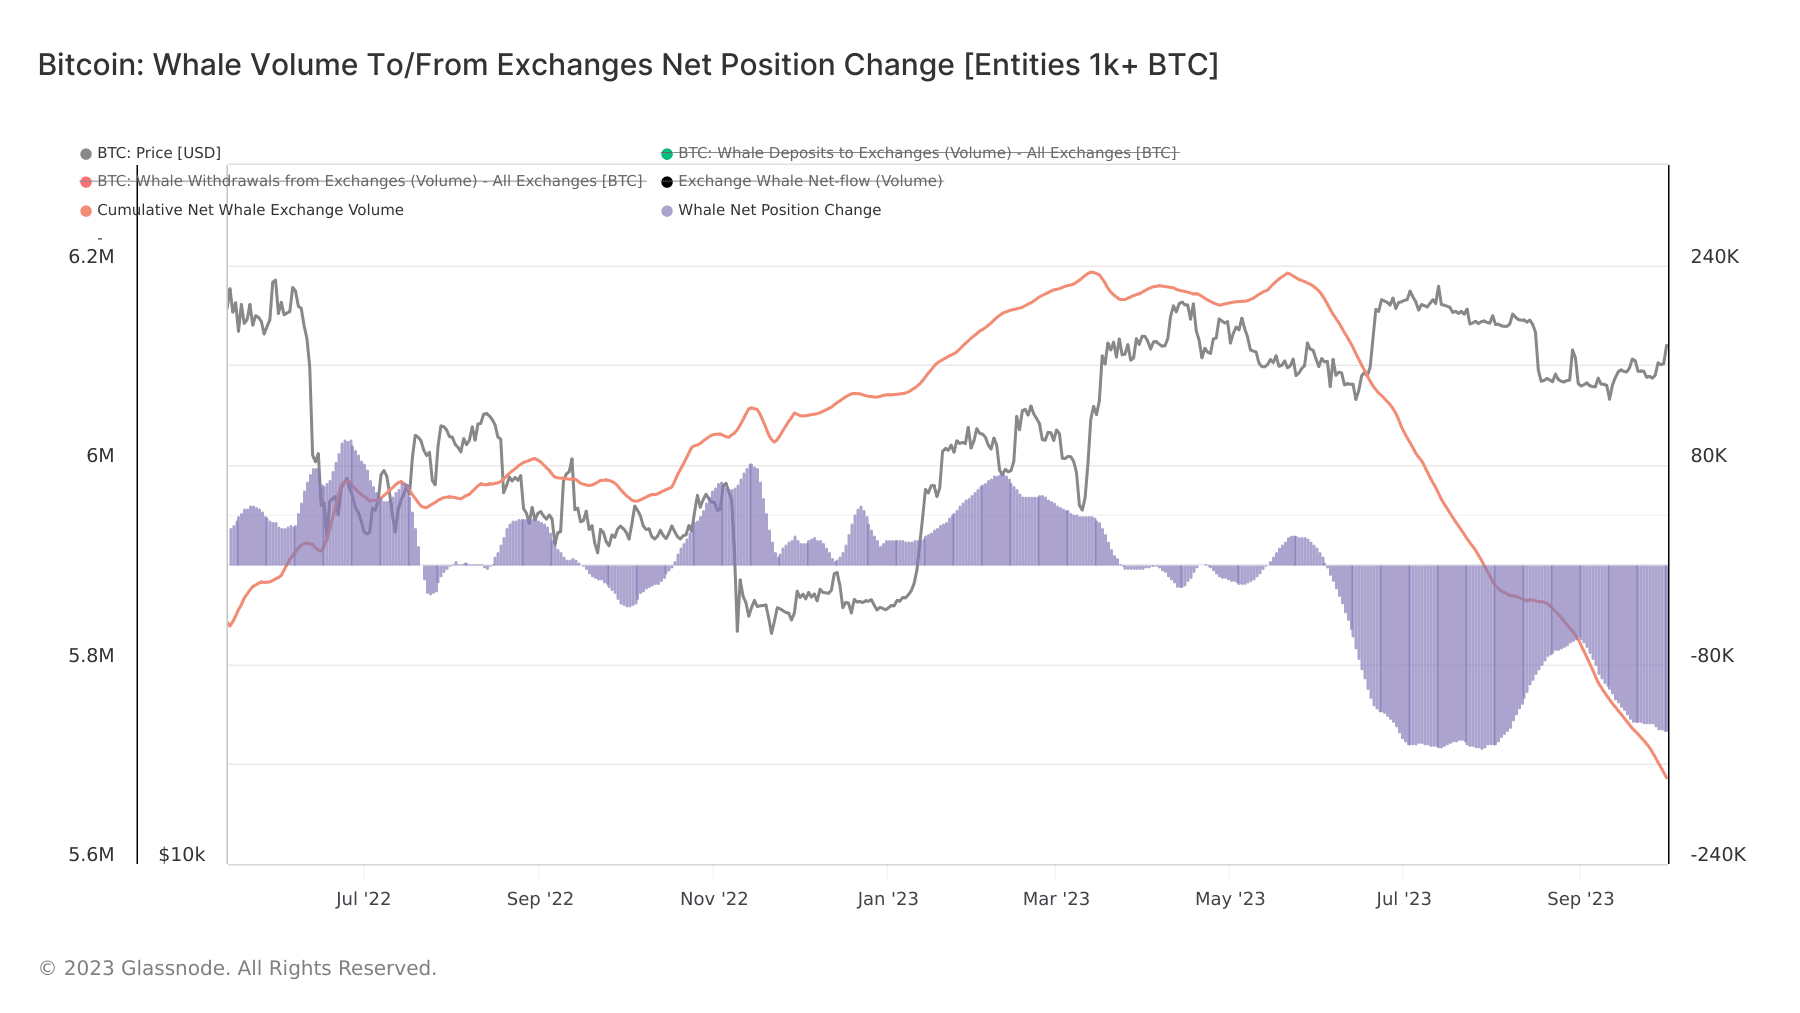 The scale of whales transferring in and out of exchanges
It is worth noting that since September 11, whales have increased their selling efforts, while the market has begun to rebound and the strength has gradually increased.
The only positive factor we observed was that stablecoin outflows shrank to $900 million in September, slowing down from the $1.4 billion outflow in August.
EMC Labs believes that with everything ready on the market, the biggest obstacle for crypto bulls to take active action in Q4 is still capital outflow and the uncertain macro-financial environment.
Just like moving from short to long, the growth of stablecoins is another important means of “reducing liquidity”.
On-chain activities
Back to the long-term market support foundation - on-chain activities. In the two dimensions of newly added addresses and Memepool queued transactions, we observed positive performance.
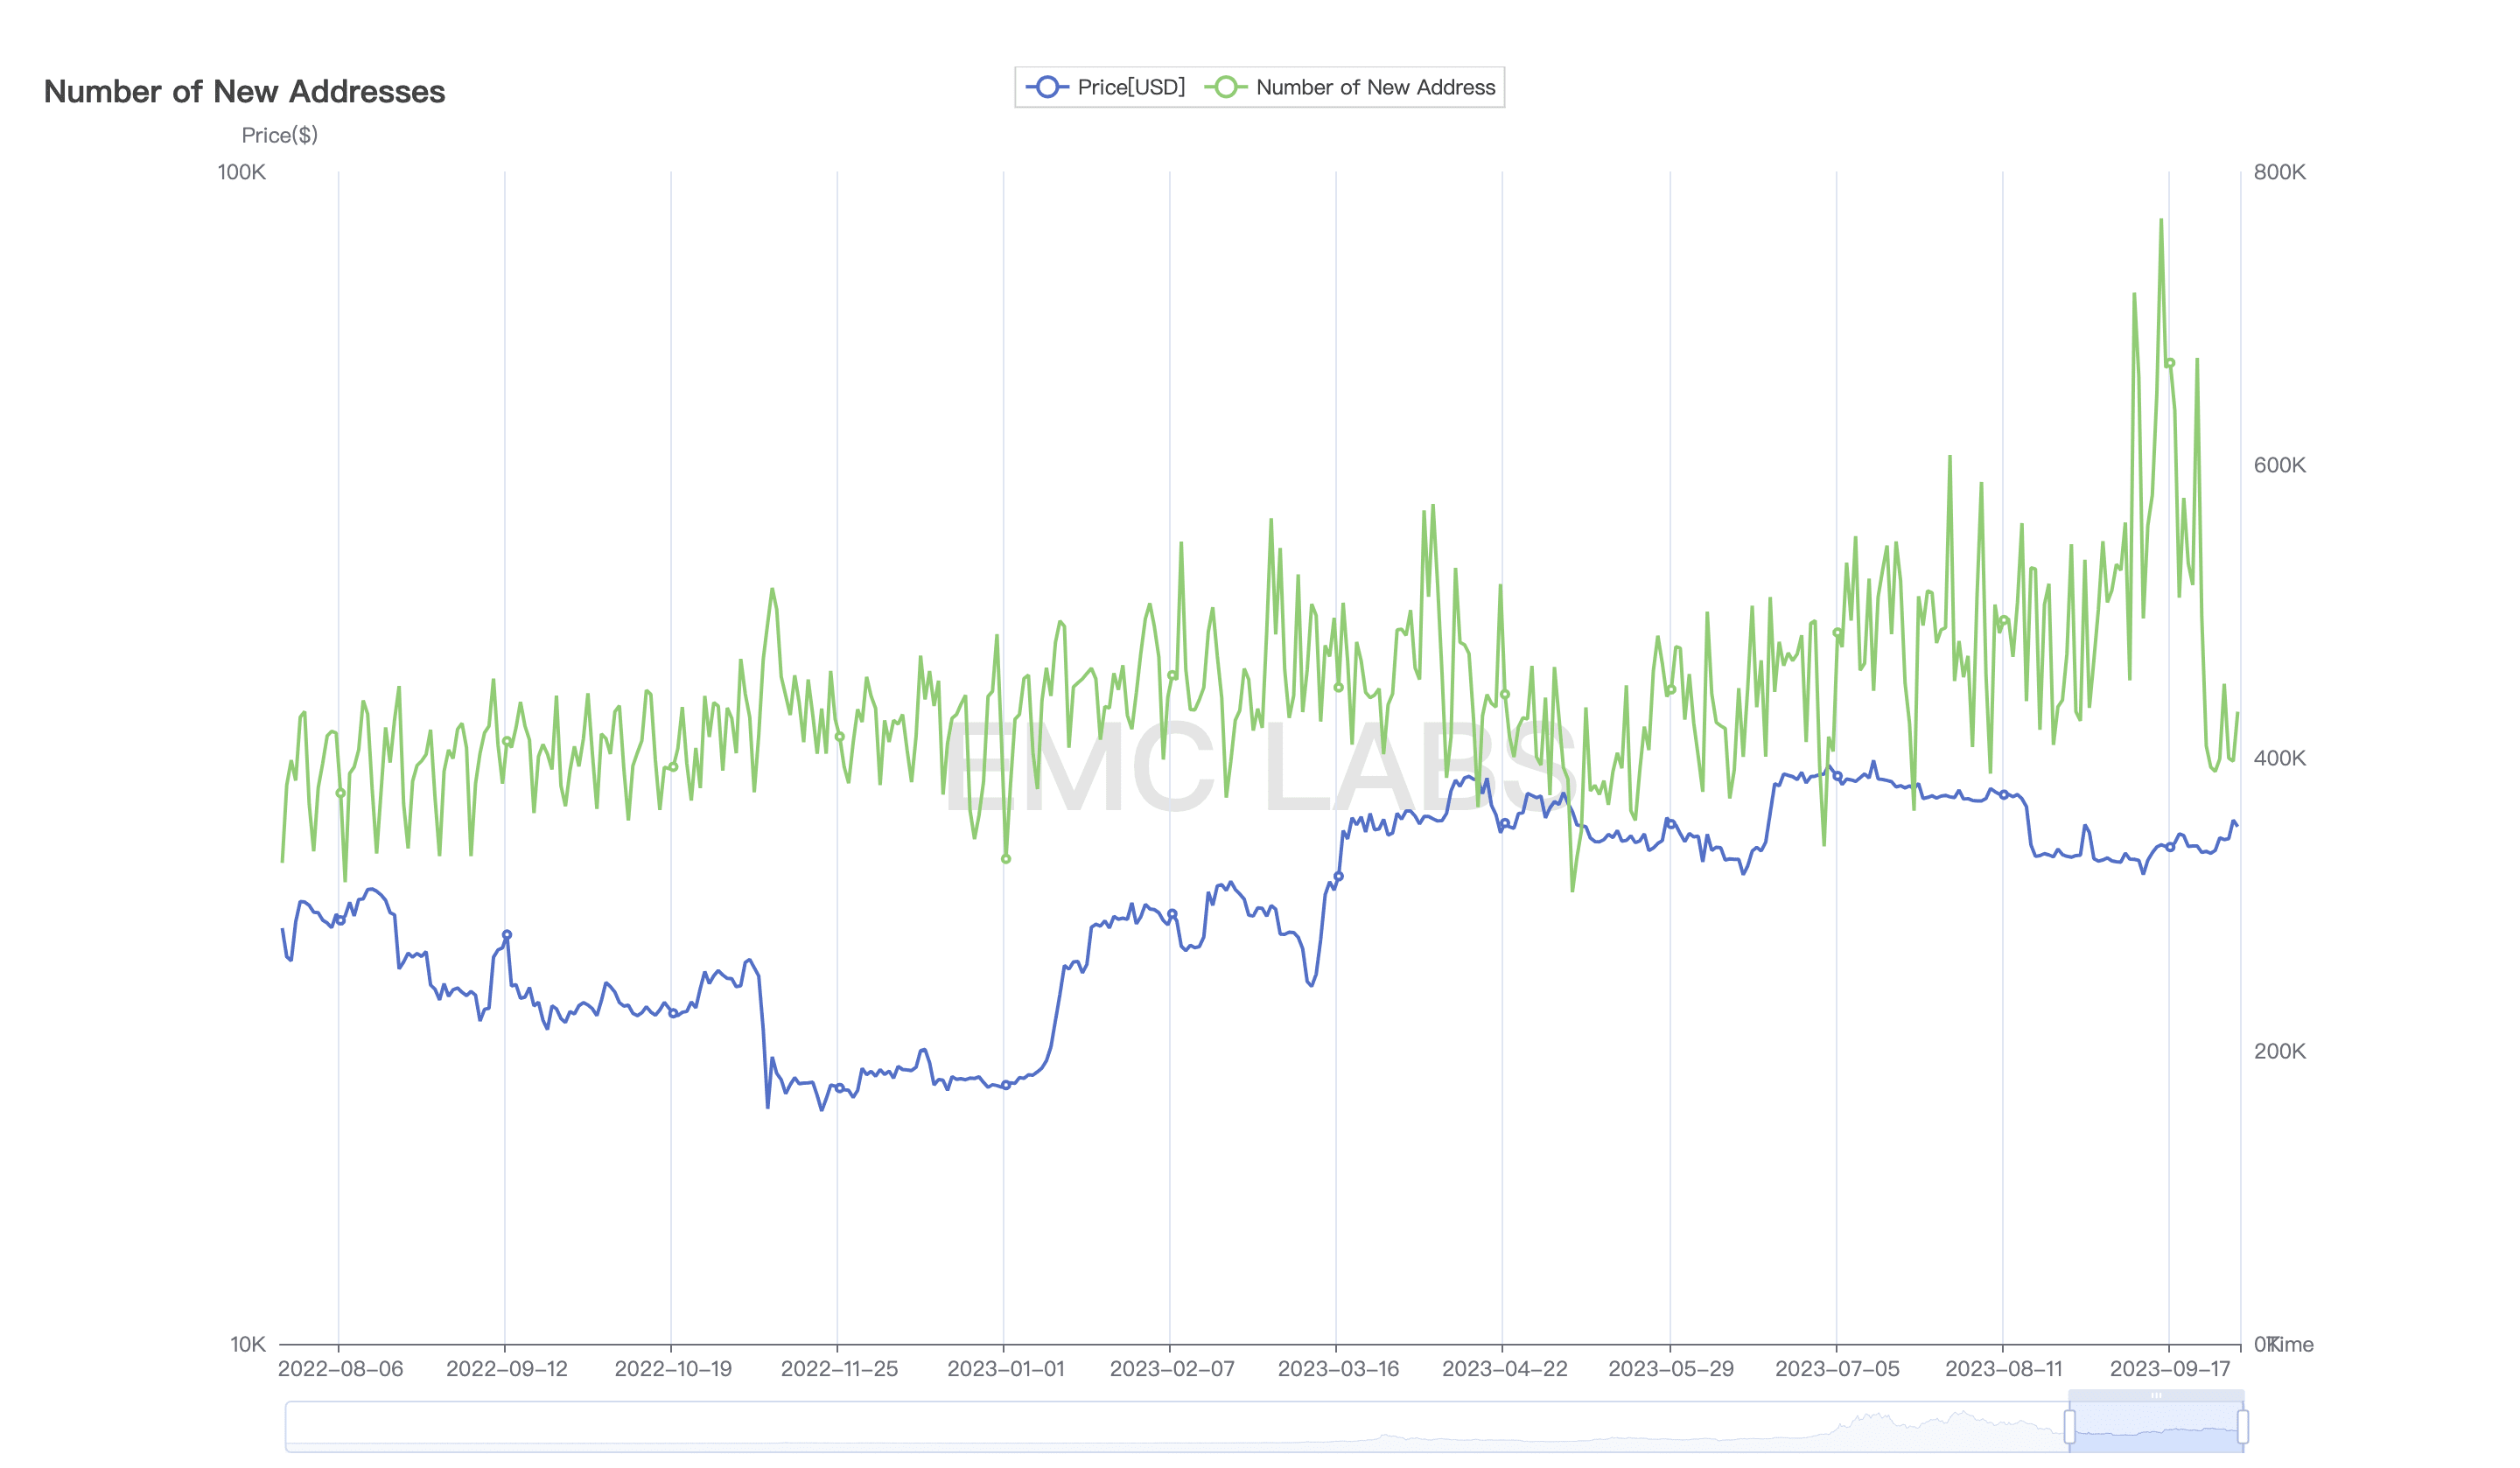 BTC daily new addresses (2022~2023)
In September, the number of newly added BTC addresses fluctuated drastically, reaching the second highest level in history on September 15, which was close to 770,000, exceeding the peak of the bull market in 2011 and second only to the historical high at the end of the bull market in 2017. However, by the end of the month, the number of newly added addresses per day dropped to 390,000, and continued to hover at that level for several days. The decline in this data may be related to the double holidays in China.
If we exclude this factor and compress the time to observe within a few years, we can find that the status of new addresses perfectly follows the historical cycle and is in a continuous recovery.
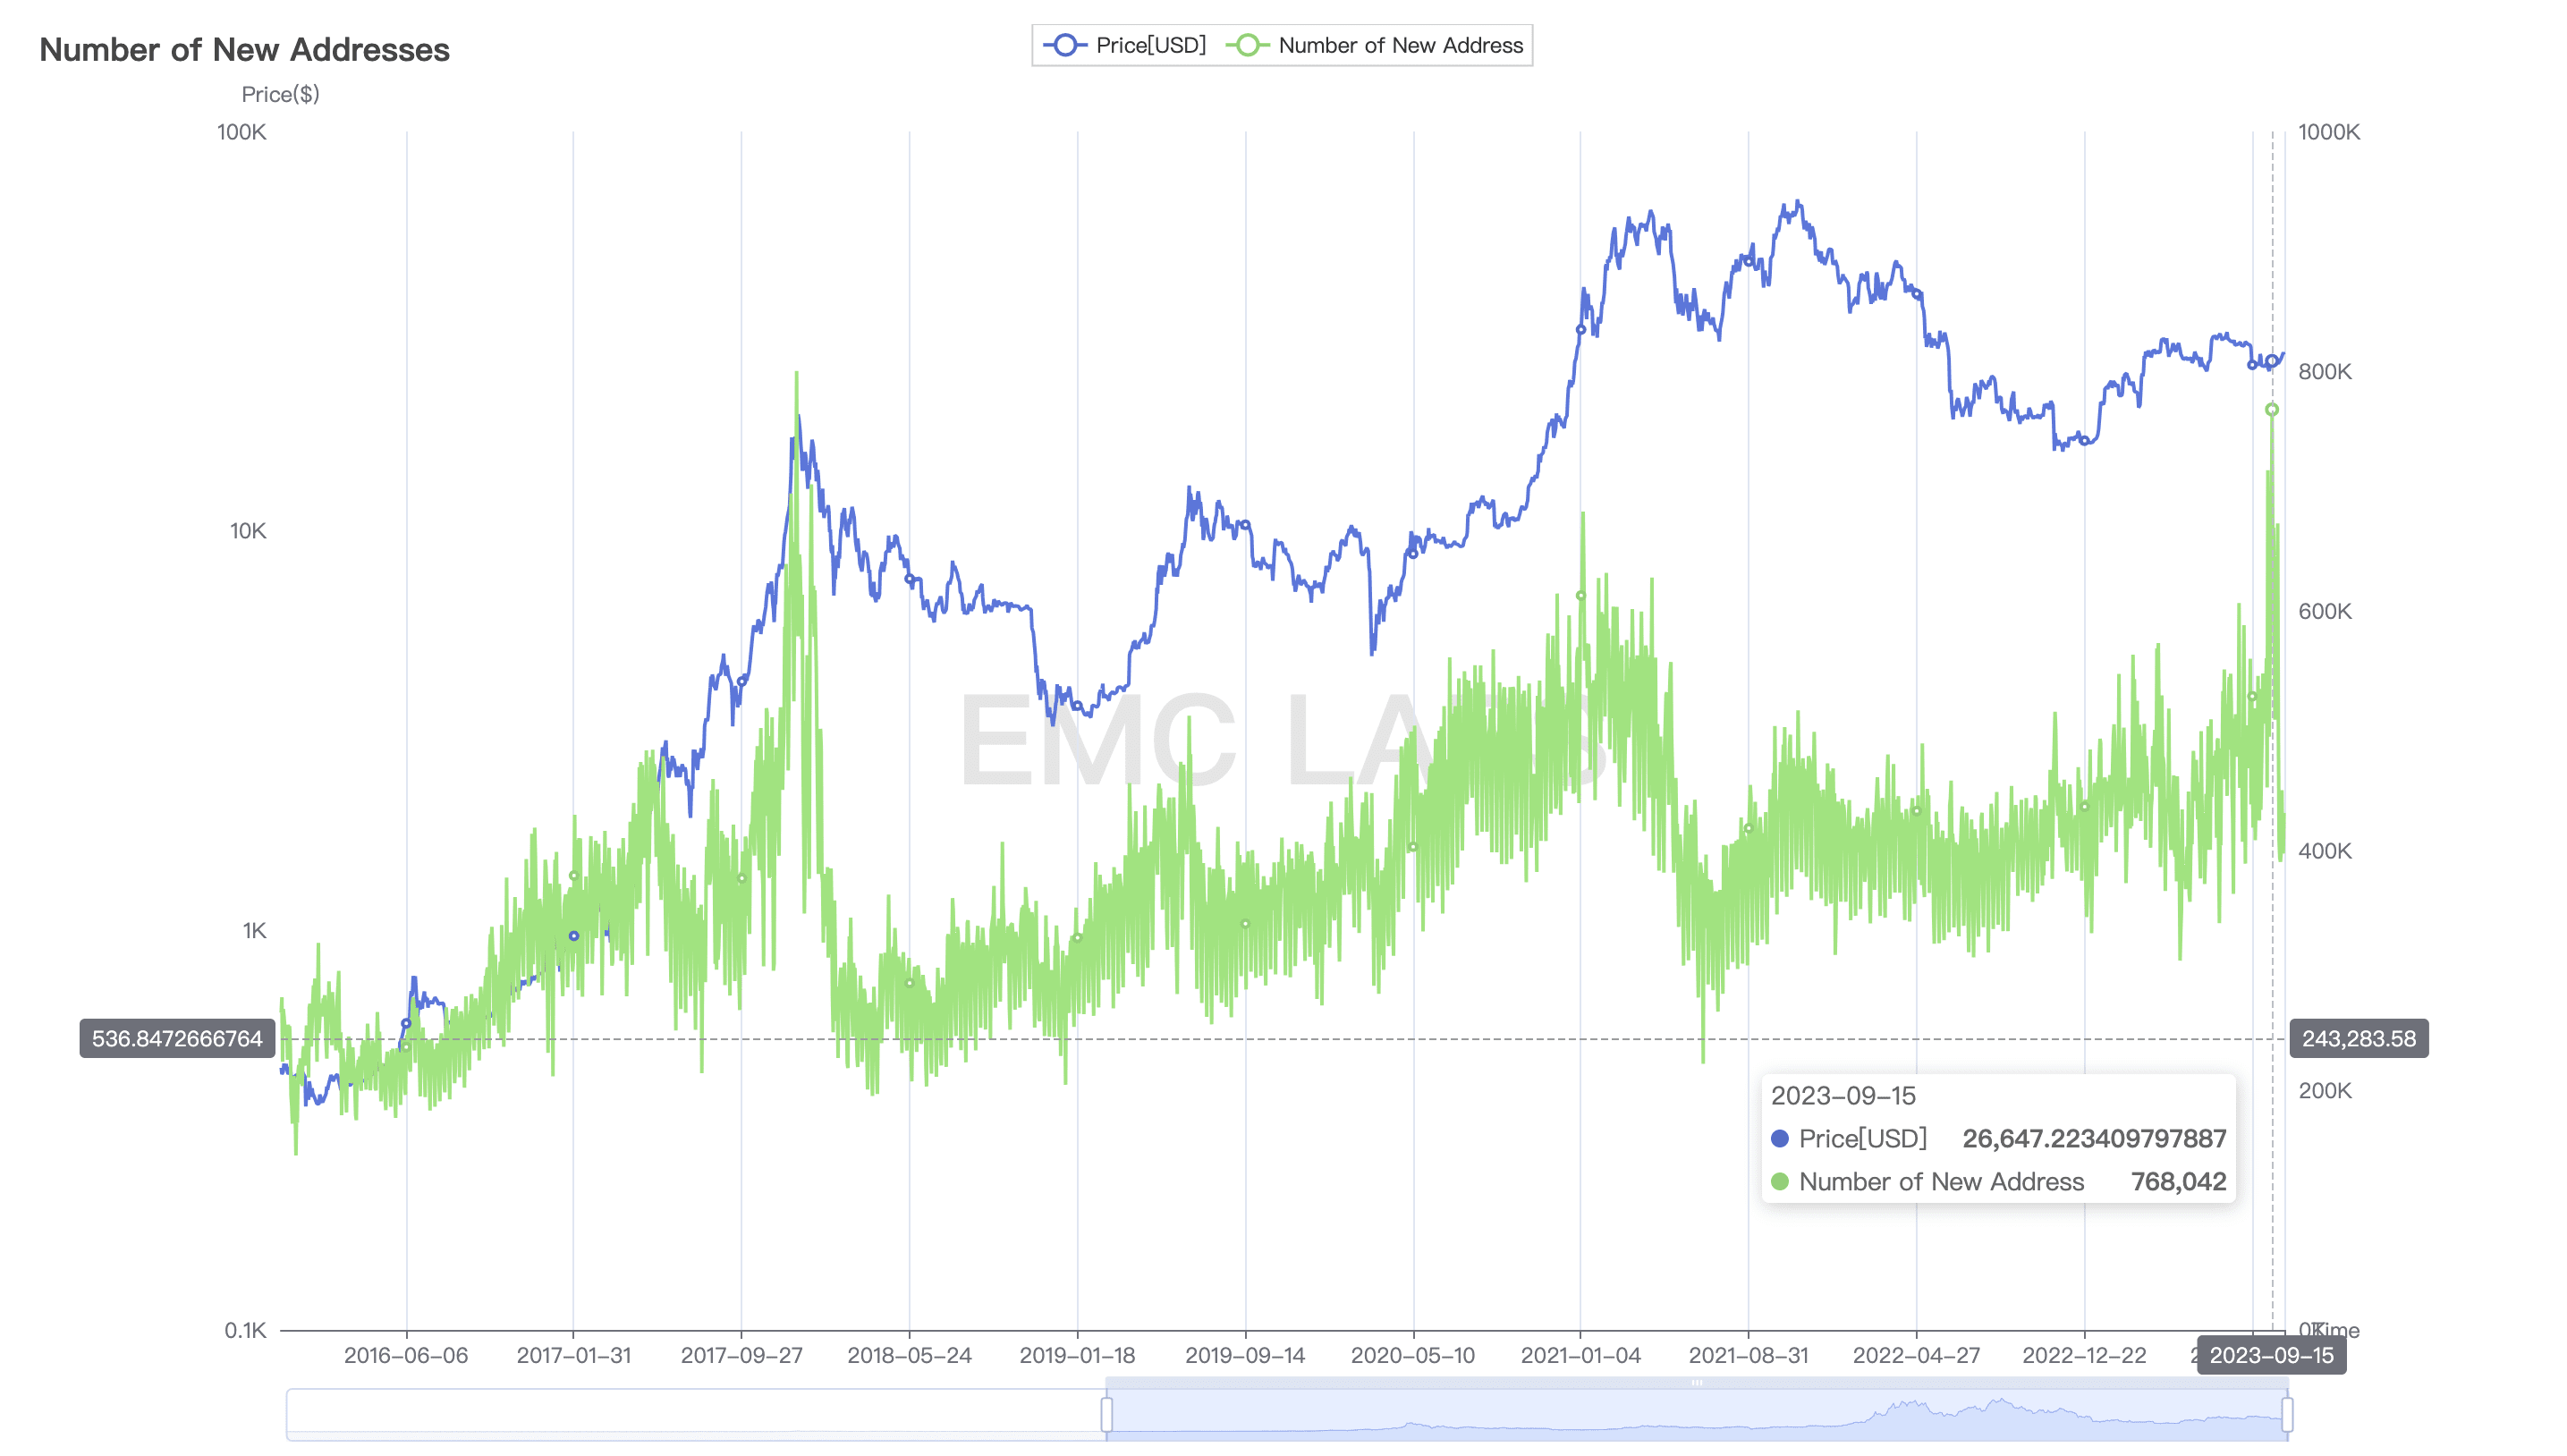 BTC daily new addresses (2016~2023)
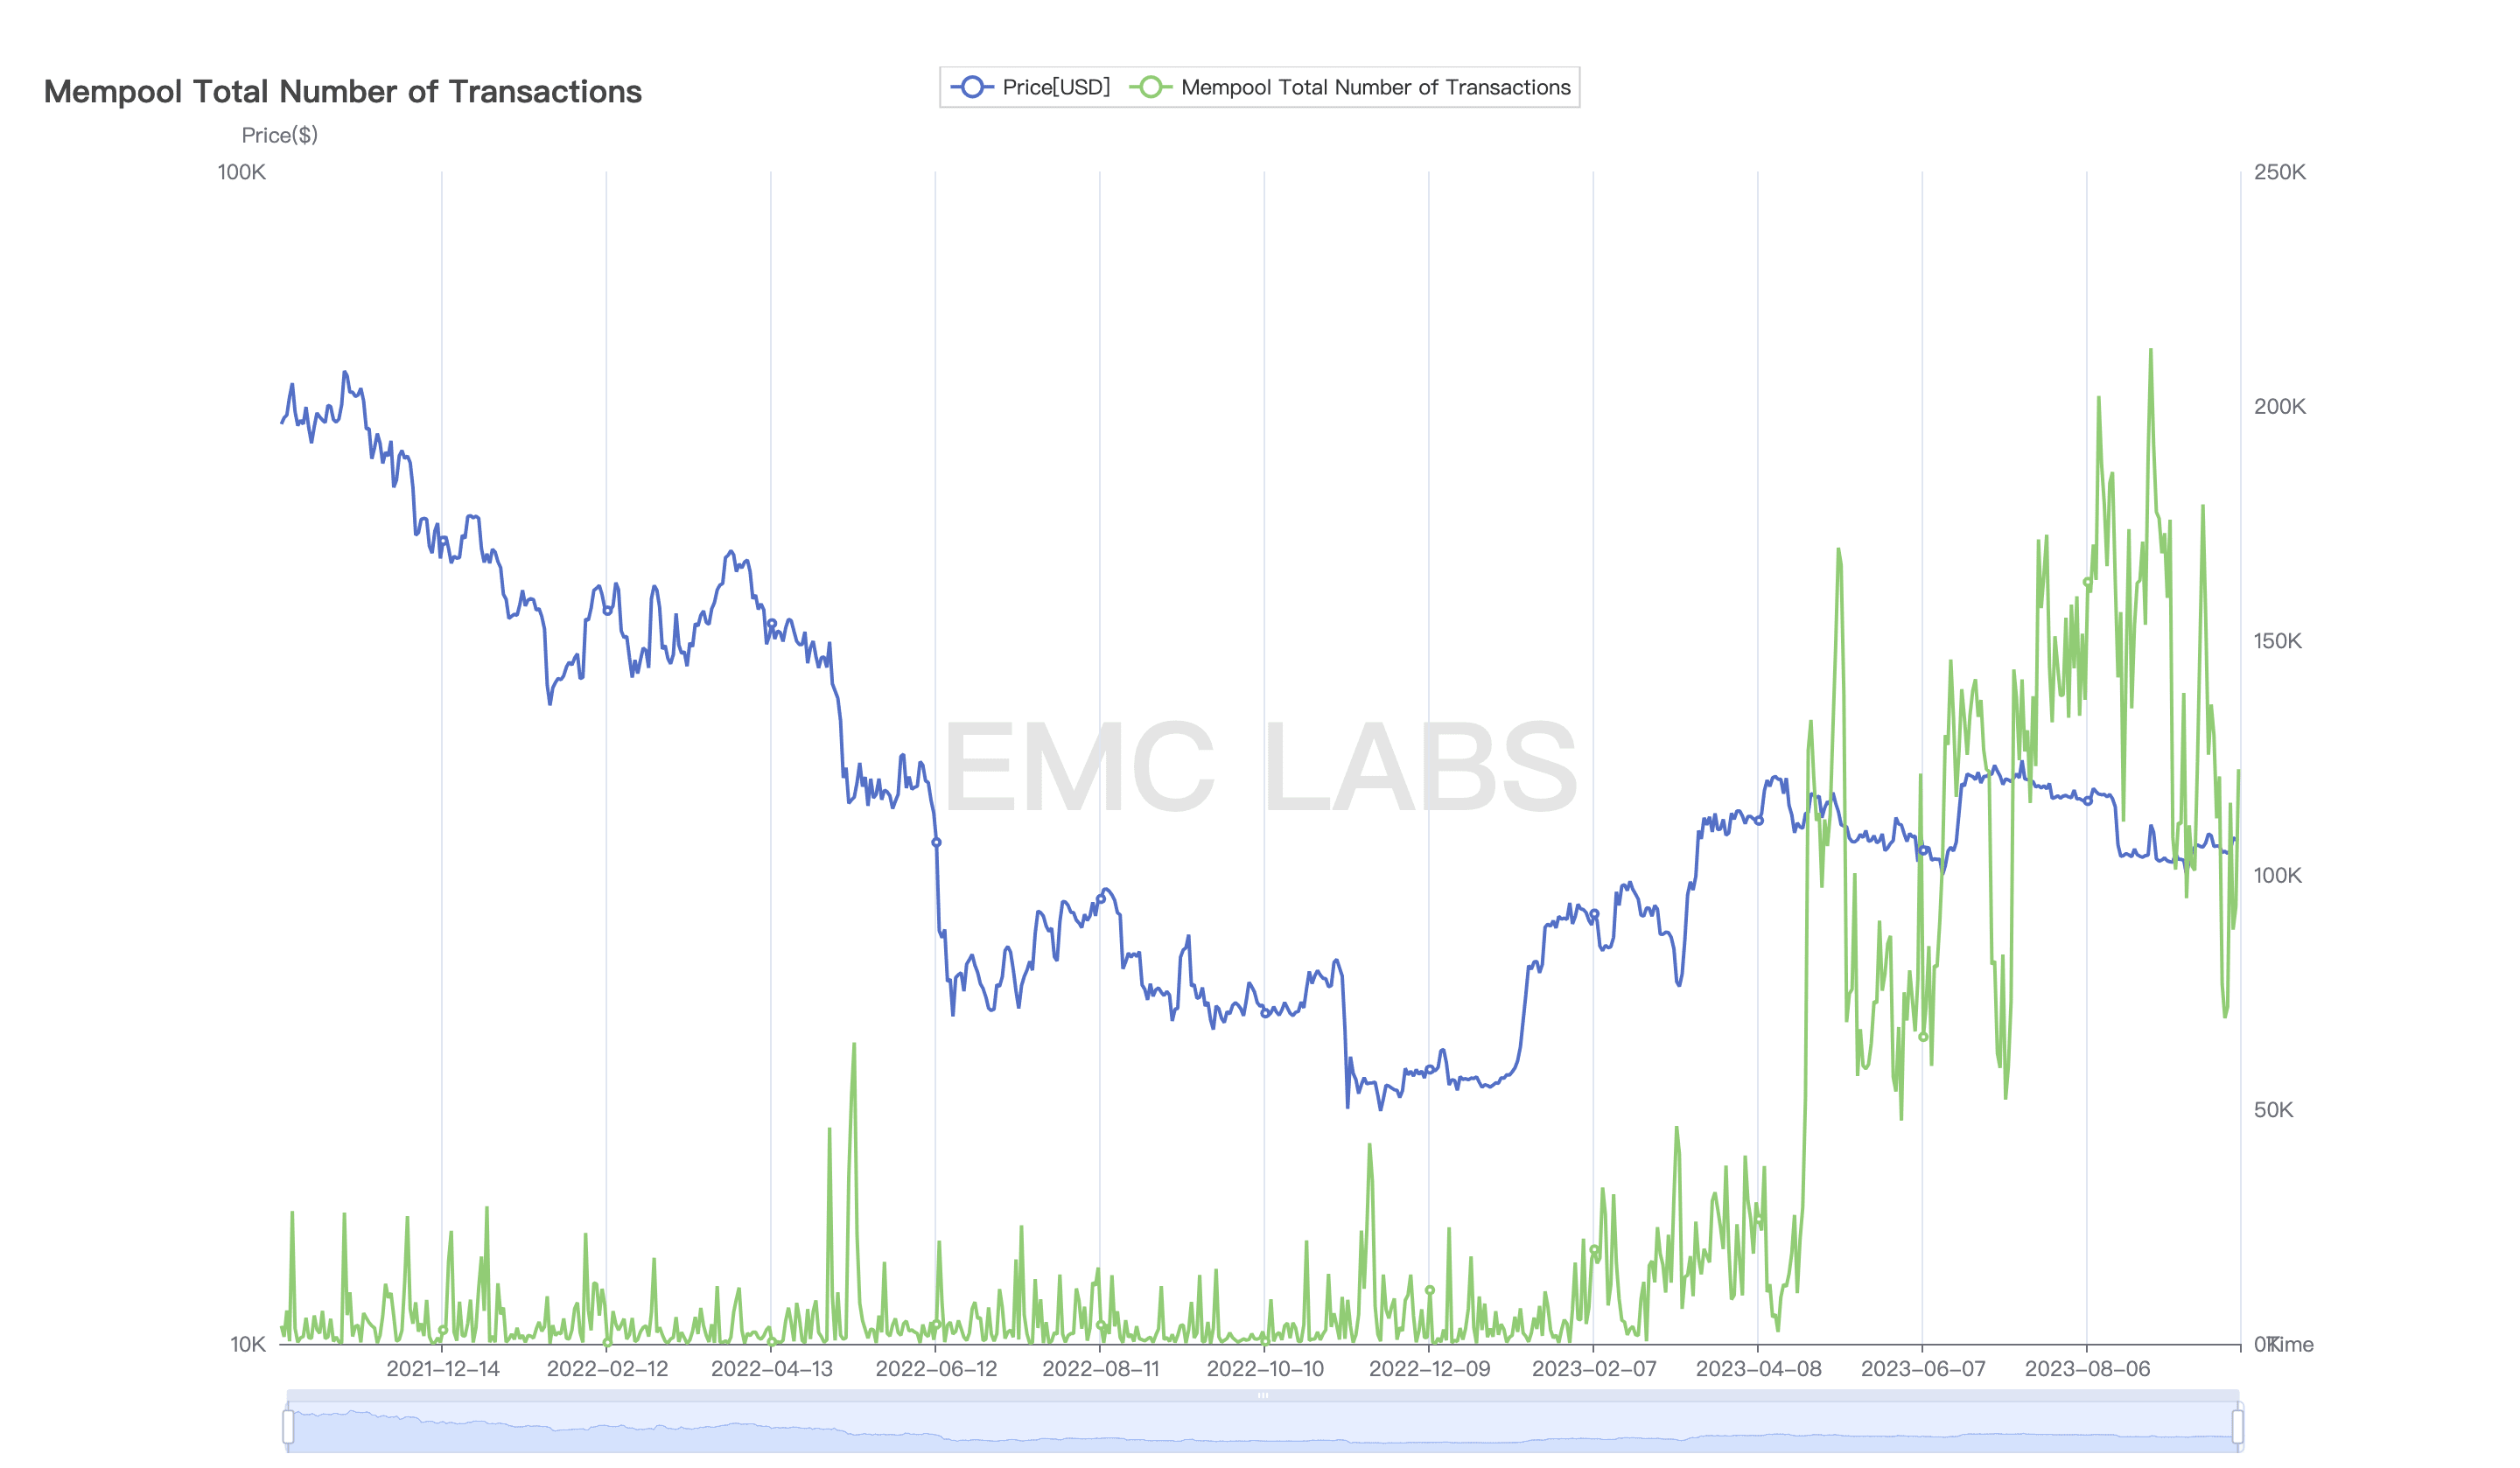 Mempool Transactions Daily Queue Size
In terms of Mempool Transactions, the data in September fell compared to August, when volatility was higher, but remained at a high level since April. This shows that on-chain activities are still in a relatively positive trend.
Conclusion
In the August briefing, EMC Labs judged that "BTC falling below $25,000 is a low-probability event, and the possibility of a rapid and sharp rebound in the short to medium term still exists, and the probability is not low."
Regarding the market in October, we maintain our previous judgment and believe that as the interest rate hike cycle comes to an end, the long forces in the market will most likely take active actions in Q4, pushing the market to challenge the annual high of $32,000 again. It is likely to make a historic breakthrough on the upper edge of the box that has besieged BTC for half a year, ending a year of recovery that has been bumpy but not easy.
This report was written at the time when the lawsuit against FTX founder and CEO SBF was first heard in court.
Thousands of ships pass by the sunken boat, and thousands of trees bloom in front of the dead tree.
This market has grown wildly and produced many heroes, but it also tempts people to fall into the abyss and become disillusioned. Only by focusing on construction, being determined and respecting common sense can we succeed.