SUN
Solana has been moving in a wide range between $14 and $27.12. The price action over the past few days has resulted in the formation of a potential inverse head and shoulders pattern.
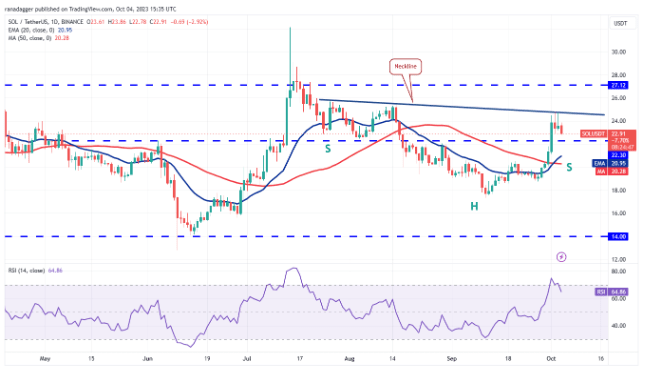
Although setups formed within a range tend to be less reliable, they still should not be ignored. If the price rises and breaks out of the neckline, the SOL/USDT pair could attempt a rally to $27.12 and eventually reach the pattern’s target of $32.81.
The key support to watch on the downside is the 20-day EMA ($20.95). If the price breaks below this level, it will suggest that the bulls have given up. This could open the doors for a possible drop to $17.33.
TON
Toncoin (TON) broke below the 20-day EMA ($2.09) on September 30 and the bears foiled the bulls’ attempt to reclaim this level on October 1.
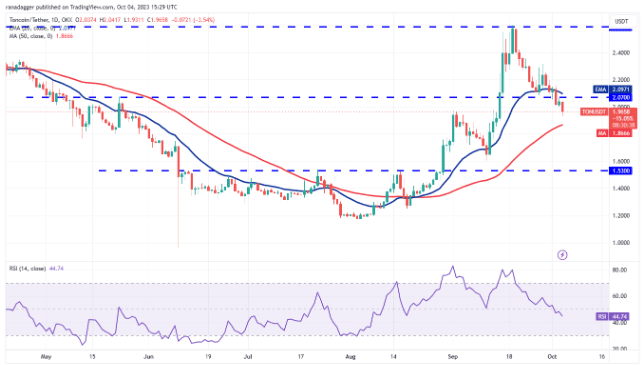
The bears will try to consolidate their position by sinking the price to the 50-day SMA ($1.86). This level might result in a bounce and it could face selling at the 20-day EMA.
If the price turns down from this resistance, it will suggest that sentiment has turned bearish and traders are selling on rallies. This will increase the possibility of a break below the 50-day moving average.
Conversely, if the price rises and breaks out of the 20-day EMA, it will indicate that the market has rejected lower levels. Subsequently, the TON/USDT pair is likely to move up to $2.32, where the bears will once again try to stall the up move.
DOT
On October 2, the US dollar index fell sharply from the 50-day moving average ($4.24) and fell below the 20-day moving average ($4.10) on October 3.
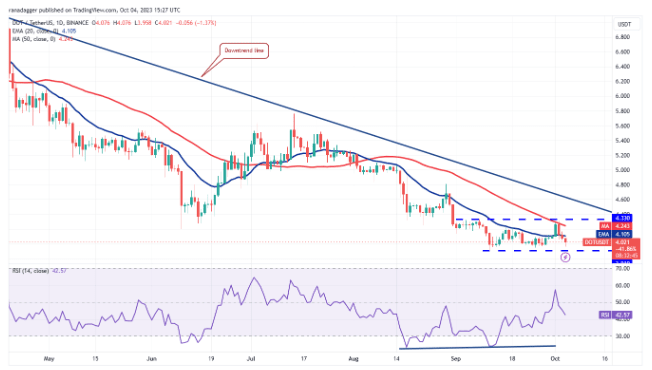
On October 4, the bears challenged the important support of $3.91, but the long tail on the candlestick showed strong buying at lower levels. The RSI has formed a bullish divergence, which suggests that the sellers may be losing control.
If the bulls push the price above the 20-day EMA, it will suggest that the DOT/USDT pair could remain range-bound for an extended period of time between $4.33 and $3.91. The bears must sink the price below $3.91 to start the next leg of the downtrend towards $3.50.
MATIC
After witnessing a tough battle between the bulls and bears near the moving averages, Polygon rebounded on October 4, suggesting that buyers are trying to take control.
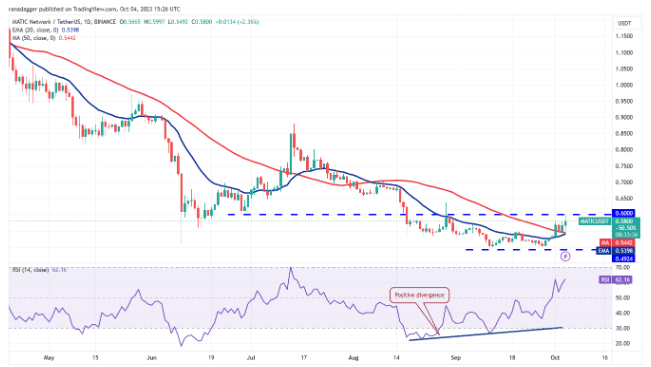
The bulls are attempting to consolidate the momentum and push the price above the overhead resistance at $0.60. If they succeed in doing so, it will signal the start of a sustained recovery. The MATIC/USDT pair could then rise to $0.70.
Contrary to this assumption, if the price turns down and breaks below the 20-day EMA, it will suggest that bears are active at higher levels. The pair is likely to retest the critical support of $0.49. This level is likely to attract heavy buying from the bulls.
Here are some potential high-return targets with low risk of going to zero:
Tenfold Watch List:
Shib (from a local dog to a mainstream dog)
IMX (10 times more likely)
ATOM (10x less likely)
ENS (decentralized domain name, a basic application)
MANA (Metaverse track. Gradually losing value)
MATIC (Expectations gradually lost)
OP (high-quality target, low possibility of zero return)
YGG (to achieve 10 times)
ETH (main warehouse)
GALA (Conflict within the team)
SEI (this public chain has very low competitiveness)
SUI (basically no retail investors)
ETHW (eth technology black swan insurance)
APT (basically no retail investors)
MAGIC (arb blockchain games are on the rise and demand is high)
XEN (decentralized, minting volume gradually reduced, high risk and high return)
ARB (high-quality target, low probability of zero return)
WEMIX (Korean blockchain game public chain)
If you like it, please follow and like it! Come to the homepage to ambush and layout together~