
I haven't updated the market analysis in the past few days, mainly because I missed the rise in this period. The reason why I dare not get on the train is because I am worried about the US stock market. The monthly line of the US stock market has a structure similar to the M top. In my opinion, it is impossible for the cryptocurrency market to rise alone when the US stock market falls, so I dare not be too aggressive.
After talking about the reasons for missing out, let's take a look at the market
The upward trend of the weekend a few days ago was brought down after the opening of the U.S. stock market this week. The U.S. stock market fell for two consecutive days, causing many currencies to fall a lot, and even fell back to the starting point of this round of rise.
Is this round of rise over?
From the daily line of BTC, it is not weak, but it is blocked after hitting the downward trend line (the downward trend line at the daily level does not need to be too extreme, it mainly expresses a trend, so when drawing the line, some shadows can be ignored)
The bottom also fell to the previous horizontal support level, and for the time being, it is above the moving average band.
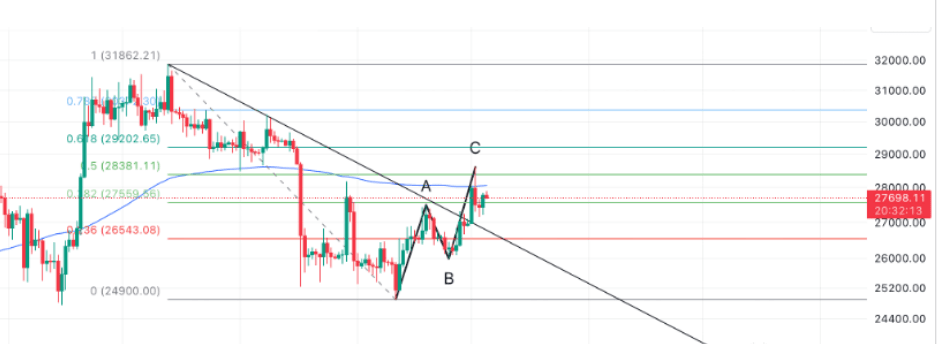
On October 2, the short-term upward spike reached 2.86w, and then fell back quickly. The subsequent daily closing lines were all below the 120-day line. Looking back at the short-term K-line, the high points of many currencies in the morning of October 2 were basically pulled up quickly within 1-3 minutes, and the high points were all generated after the short burst
This kind of rise itself is not a normal and healthy upward trend. Therefore, even if the current price breaks through the black downward trend line in the above figure, it does not constitute a reversal of the market for the time being. As mentioned in the previous article, the breakthrough of the downward trend line does not mean an immediate rise, it only means that the previous downward trend has come to an end.
Around 2.8w is the 120-day + 200-day + 200-week + Fibonacci key point. As long as it cannot break through here, it will not constitute a reversal. As for the judgment of an effective breakthrough, I have mentioned my own judgment method in the previous article. The judgment method for breaking down and breaking through is the same. For an upward breakthrough, one more thing needs to be added - the increase in trading volume
Overall, ETH is relatively weak. Previously, the E/B exchange rate had a strong trend, but the decline in the past two days was reversed. However, this is also a normal phenomenon in the current market. The outlook is unclear, and funds prefer Bitcoin. As for the narrative of Ethereum itself, it is actually relatively secondary.
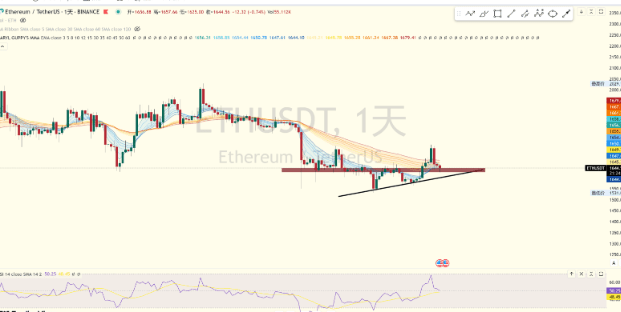
Ethereum has now reached a horizontal support position, with a potential head and shoulders bottom expected. There is also a trend line below as support. If it falls below, short-term longs should stop loss.
Macro Aspects
The JOLTS job vacancy data released yesterday (3Oct) showed the strong resilience of the US economy. The US Treasury yields continued to rise, and the US 10-year and 30-year Treasury yields once again hit multi-year highs. The three major US stock indices closed down collectively, with the Nasdaq index falling by 1.87%, and the SP500 and Dow Jones falling by 1.37%/1.29% respectively. After the data was released, the market's expectations for the Federal Reserve's November rate hike increased, and the probability of a 25bp increase in expected interest rates rose to 30.2%.
Tonight, the market will focus on the release of the US September ADP employment data (4Oct 08:15pm UTC+8) and the ISM non-manufacturing index (4Oct 10:00pm UTC+8).
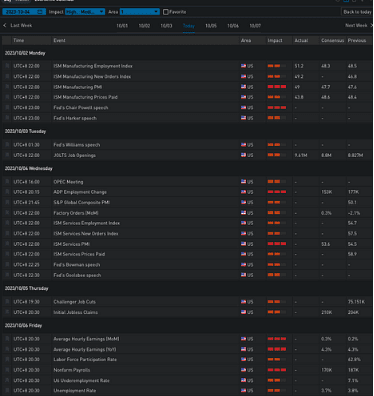
In general, the current macro sentiment, including the recent remarks of Fed officials, is not friendly to the risk market. The SEC asked the judge to dismiss Coinbase's lawsuit, while the judge dismissed Ripple's quick appeal. However, due to the pursuit of Coinbase and the failure of short-term expectations for spot ETFs, the investment sentiment of BTC and ETH was still affected.
The Fed’s recent statements are all hawkish, and for the cryptocurrency market, with the continued extension of the BTC spot ETF, there is almost no game to be seen this year.
As we have said before, ETH futures ETF has been anticipated by the market and will not cause too much emotional fluctuations. Futures ETF, whether BTC or ETH, cannot change the current liquidity shortage, market makers leaving the market, and capital fleeing.
Of course, this does not mean that we are bearish on the market. Before there is more negative news, $26,000 may still be a relatively solid support.
at last
There are too many fake bear market moves. It's okay to wait for two more days. If the real bull market comes, is there still a small increase at the beginning? It's not too late to join after it effectively breaks through 2.8w. Similarly, when it falls below 2.5w again, shorting is also an opportunity provided by the chart.
Today's sharing ends here. Thank you very much for taking the time to read this article in your busy schedule. I hope the article is helpful to you. You can follow me and leave me comments to communicate with me.