

September Digital Asset Review
LTP Research
Table of contents
● September 2023 Summary
● Market Comments
● News
● October Volatility Day
● Appendix
Summary of September 2023
In September, major assets retreated as the US dollar index soared to its yearly high in 2023. The S&P 500 fell 5.3%, the Nasdaq fell 6.4%, and gold fell 4.7%. However, Bitcoin recorded a 4% gain. The de-correlation between Bitcoin's performance and these major assets deserves continued attention. Generally speaking, a stronger dollar leads to a decline in market risk appetite, resulting in poor performance of stocks and risky assets (including cryptocurrencies).
The market correction was accompanied by a rise in long-term Treasury yields, with 10-, 20-, and 30-year Treasury yields reaching their highest levels since 2008. The Fed kept interest rates at 5.25% to 5.5% at its September FOMC meeting, and markets have begun to price in a rate cut as early as the second half of 2024. The rise in the Consumer Price Index (CPI) to 3.7% in August, coupled with rising energy prices to a new high in 2023, has raised recent concerns about the effectiveness of efforts to fight inflation.
Against this macroeconomic backdrop, commercial traders on CME maintain an aggressive net short position on Bitcoin. Volume and trading activity across the cryptocurrency market declined in September. Total open interest in Bitcoin perpetual futures has not recovered since the last sell-off. In addition, after the launch of FDUSD on the Binance exchange, trading volumes shifted from BTCTUSD to BTCFDUSD, which could bring new trading opportunities to market participants.
Regarding cryptocurrency performance, both first- and second-layer tokens generally outperformed GameFi/Metaverse tokens in September. Among first-layer cryptocurrencies, LINK was the standout performer, with a 40% price increase throughout the month.
In regulatory developments, the U.S. Securities and Exchange Commission (SEC) recently delayed its decision on spot Bitcoin ETF applications, including those from BlackRock and Fidelity, while the SEC warned more cryptocurrency exchanges, traders, and brokers that they could face charges for insufficient disclosure or failure to register with the agency.
Market Comments
1. Macroeconomics
1.1 As inflation concerns grow, long-term U.S. bond yields reach their highest level since 2008
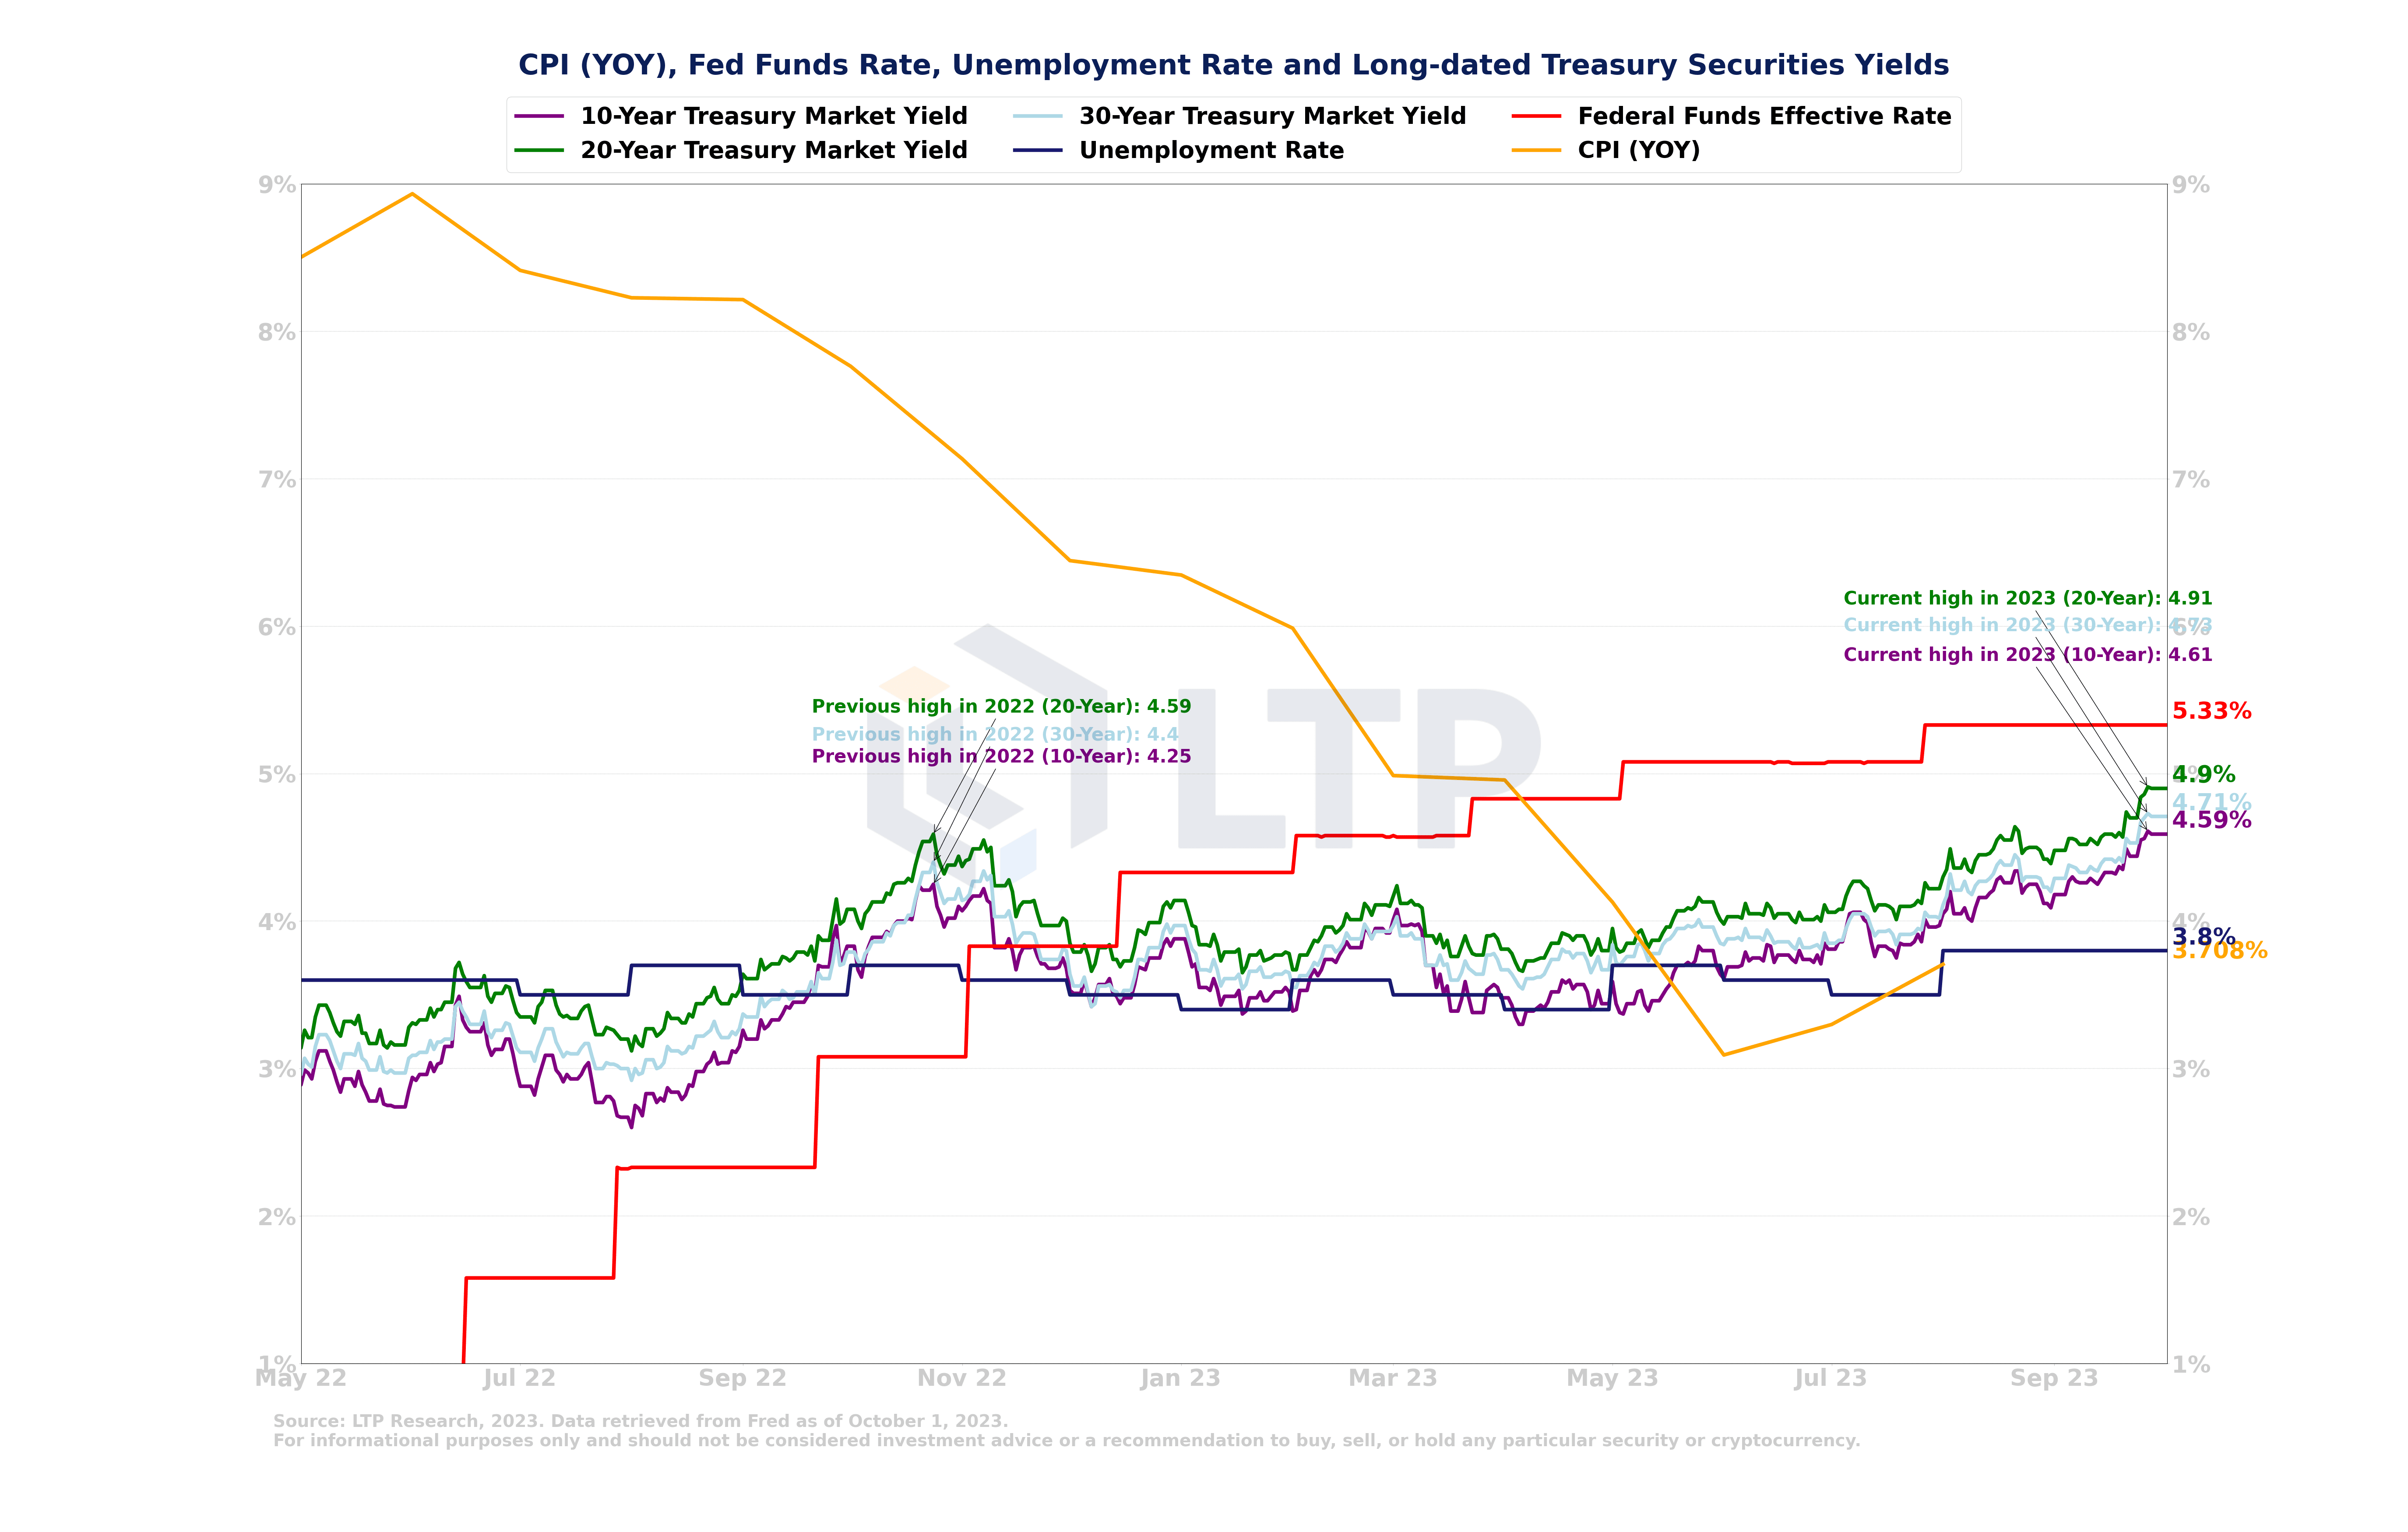
The consumer price index (CPI) year-on-year inflation rate in August reached 3.7%, exceeding expectations and raising concerns about continued inflationary pressures. At the same time, long-term Treasury bond yields (including 10-year, 20-year and 30-year bonds) have continued to rise, and these yields have reached record highs since 2008. The surge in Treasury yields suggests investors are increasingly uneasy about the prospect of rising interest rates and inflation in the medium to long term. Meanwhile, energy prices continue to climb, with oil and gasoline prices reaching annual highs. The Federal Reserve held interest rates at 5.25% to 5.5% in September.
1.2 September saw a broad market correction
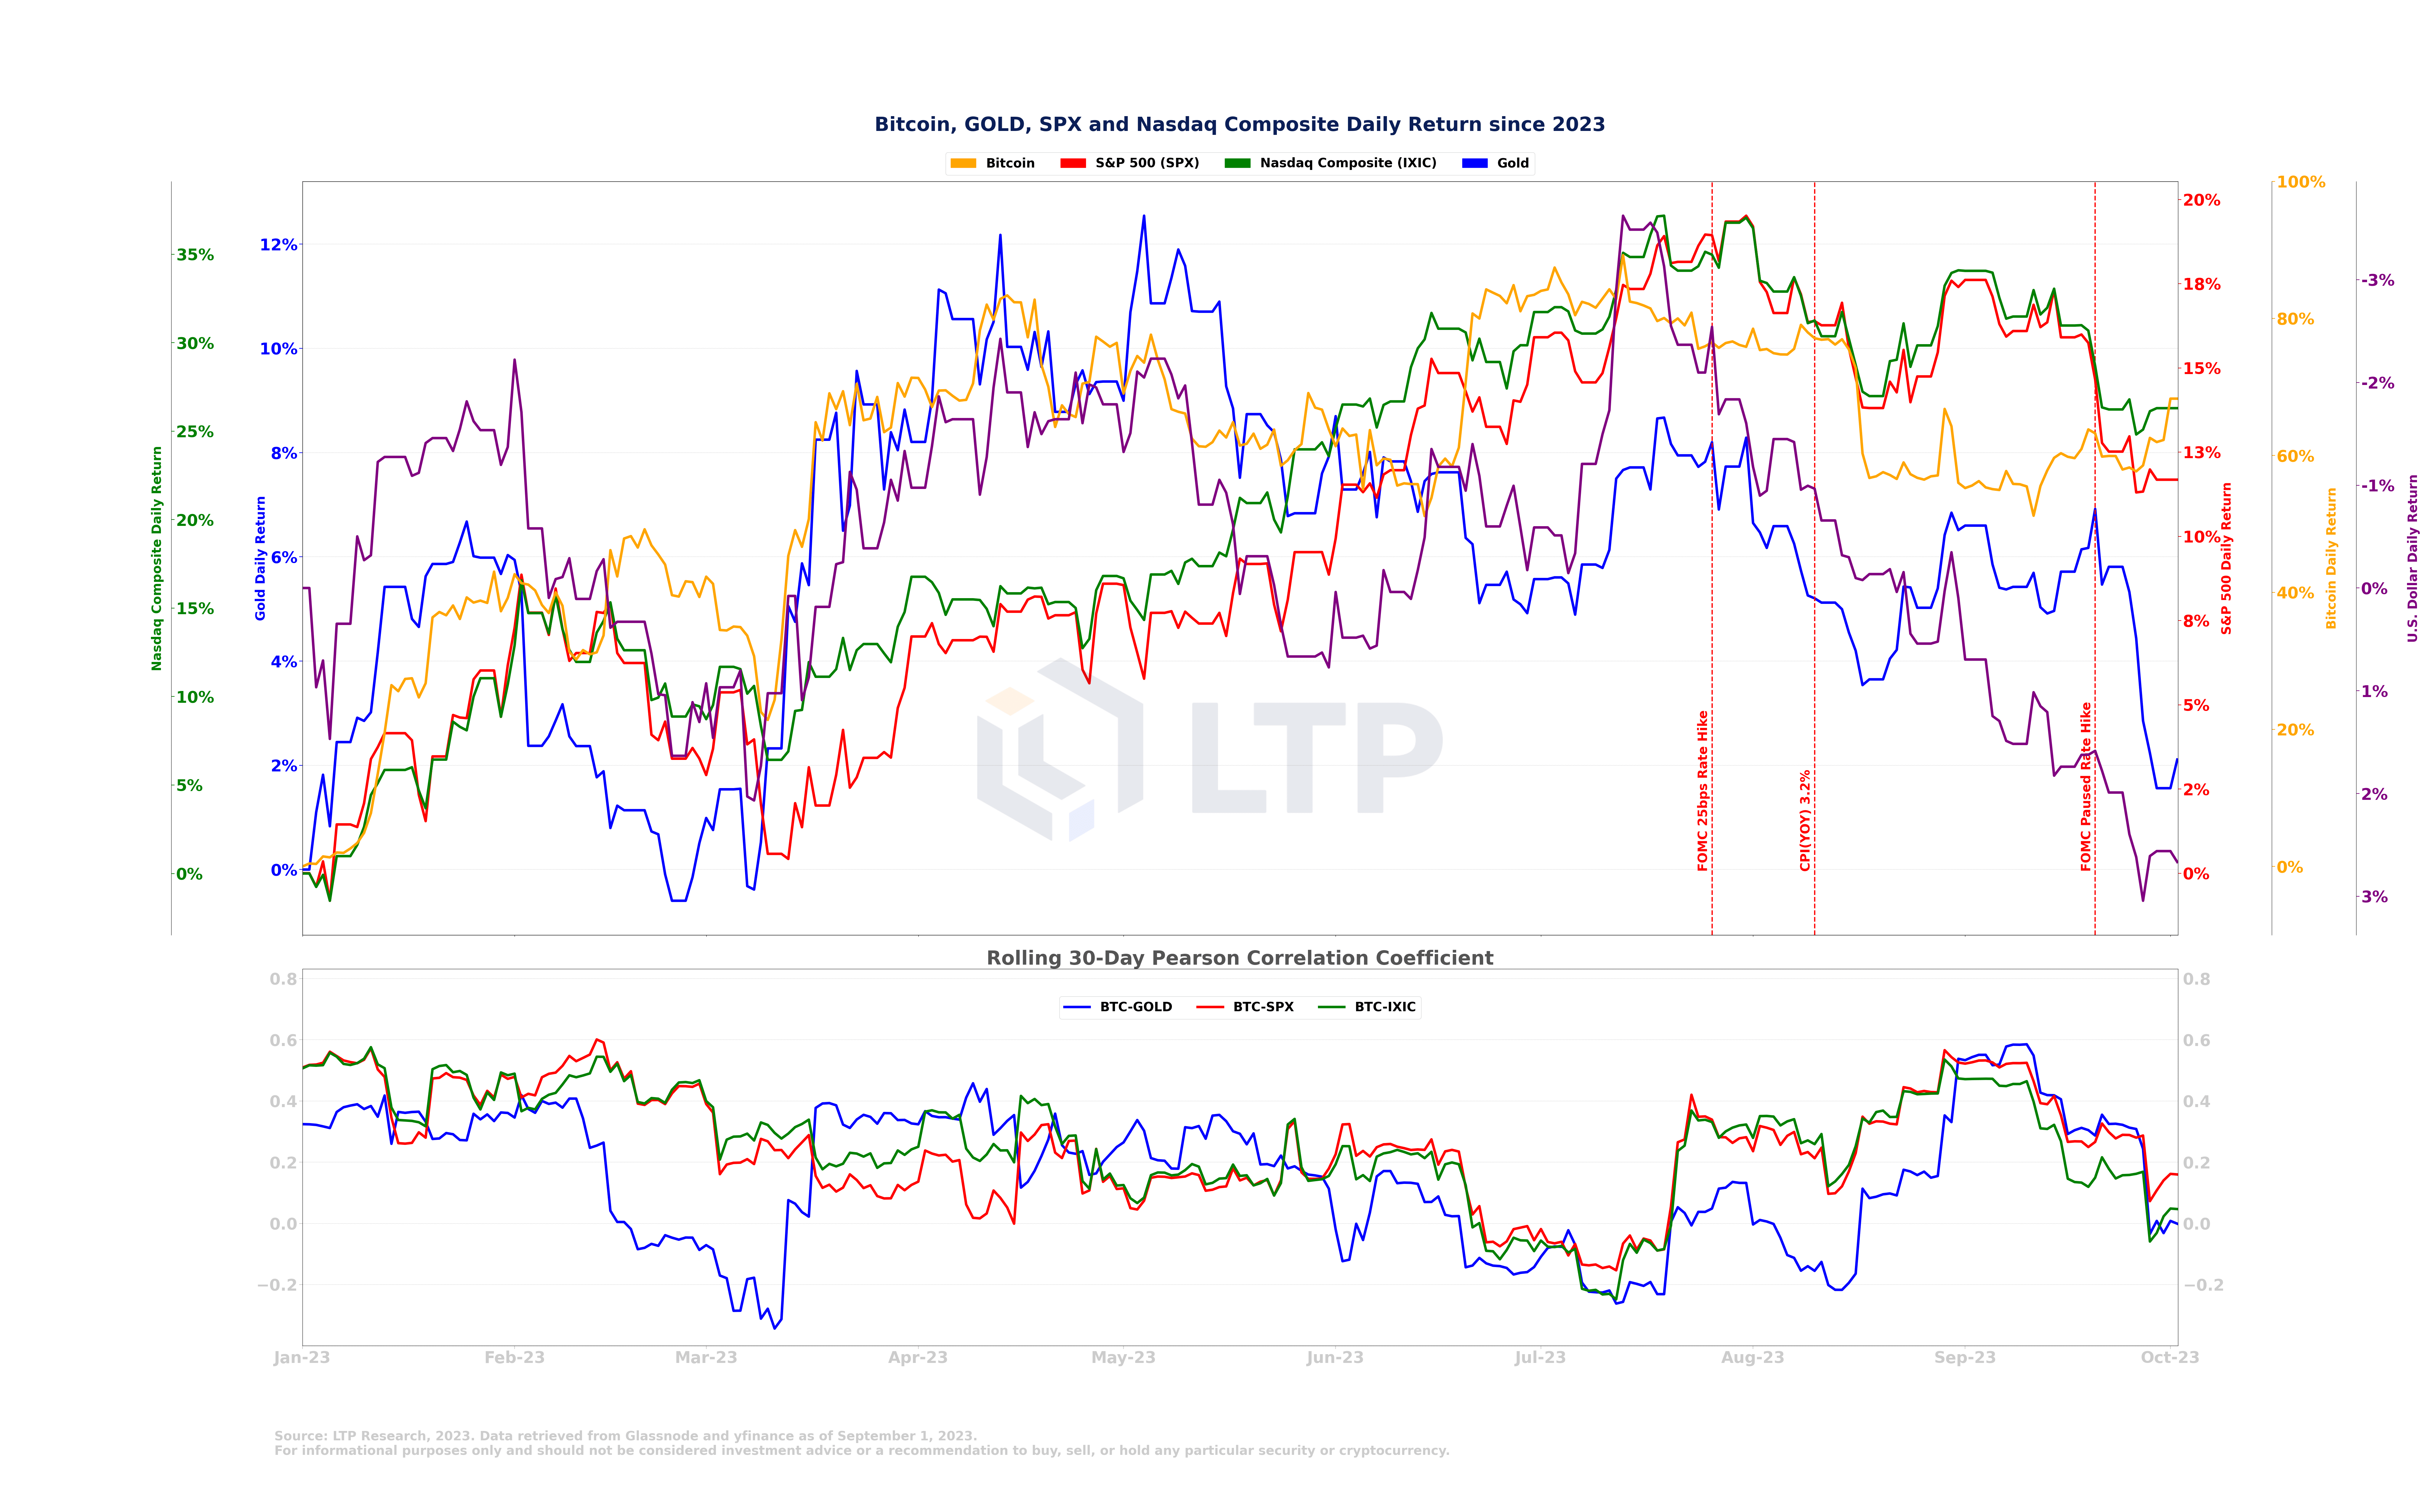
In September, the dollar performed strongly, leading to a broad correction in major asset classes. The S&P 500, Nasdaq Composite, and gold all saw declines, which coincided with the recovery of the US dollar index. The S&P 500 fell 5.3% during the month, while the Nasdaq fell 6.4%. Gold also faced challenges, losing 4.7%. However, Bitcoin recorded a 4% increase in September. Bitcoin's reduced correlation with the S&P 500, Nasdaq, and gold indicates that Bitcoin's movements are more independent. This raises the question of whether Bitcoin's gains in September can be sustained in October amid the strength of the US dollar.
2. Cryptocurrency Market Review
2.1 Commercial institutions continue to maintain a net short position in the Bitcoin CME futures market
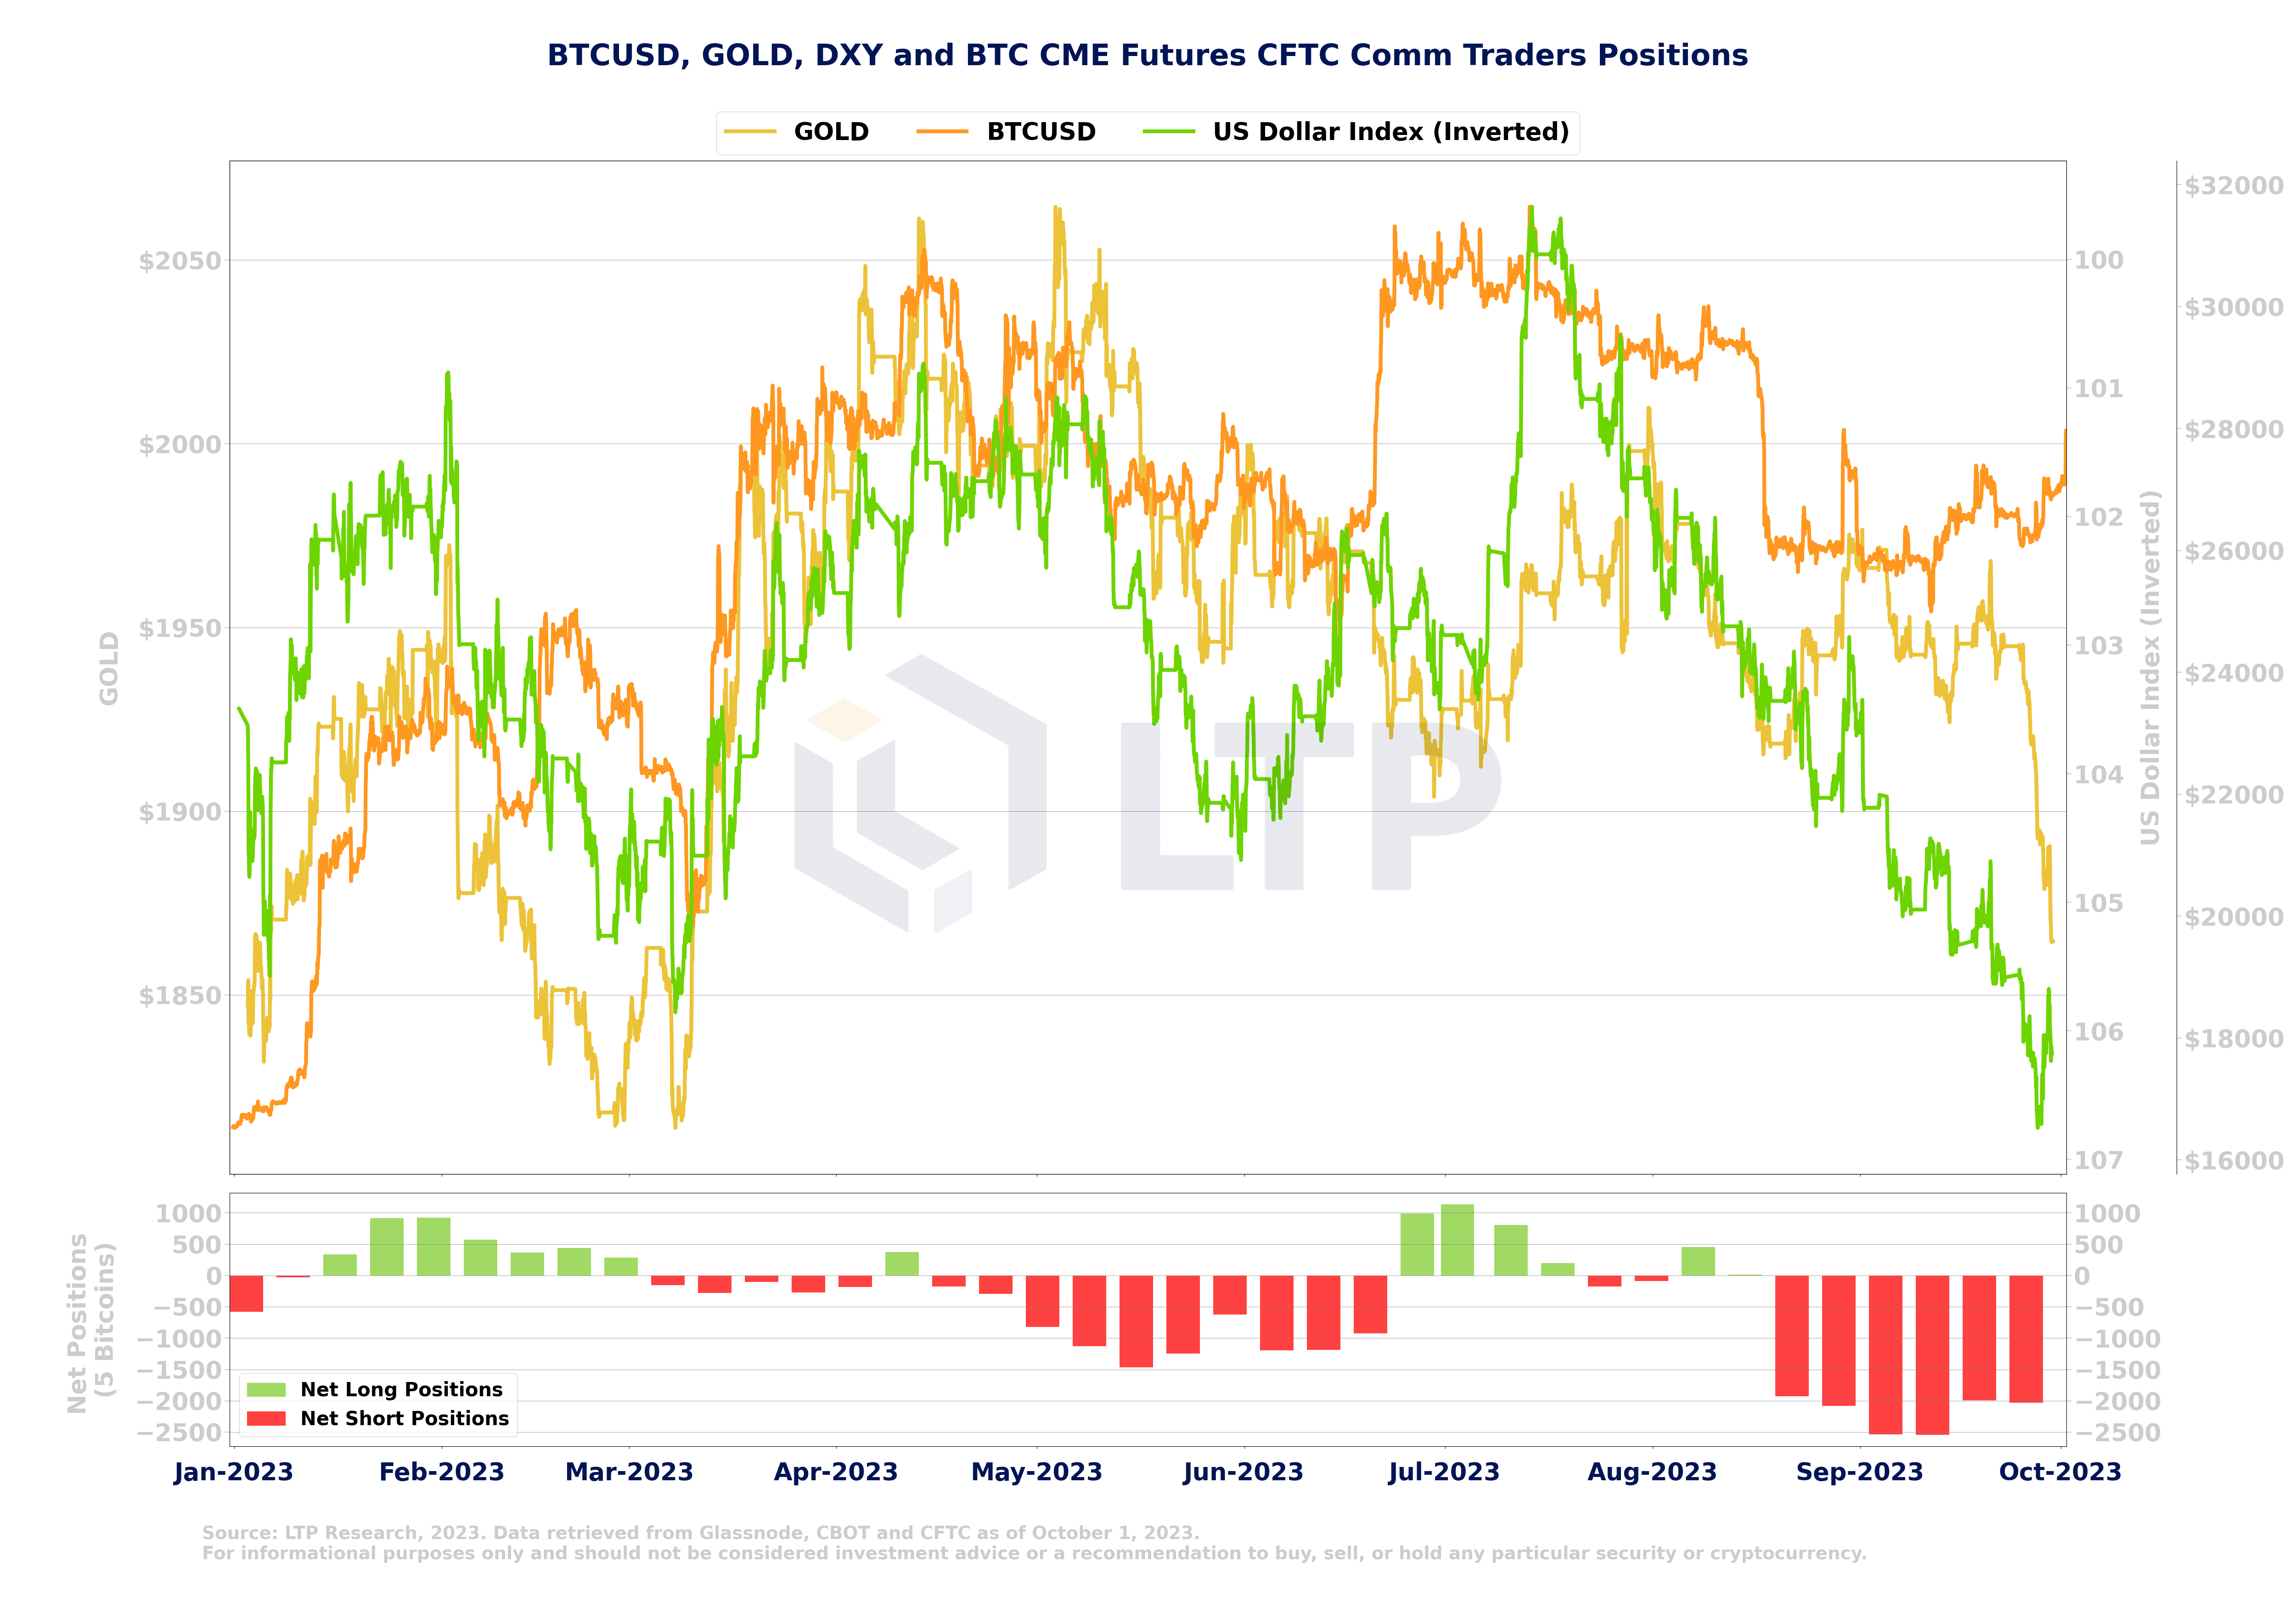
Chicago Mercantile Exchange (CME) commercial traders maintained an aggressive net short position in September amid a stronger dollar and weakening risk appetite, according to the latest COT report.
2.2 Bitcoin price backtests short-term holder cost benchmark price and 200-week moving average
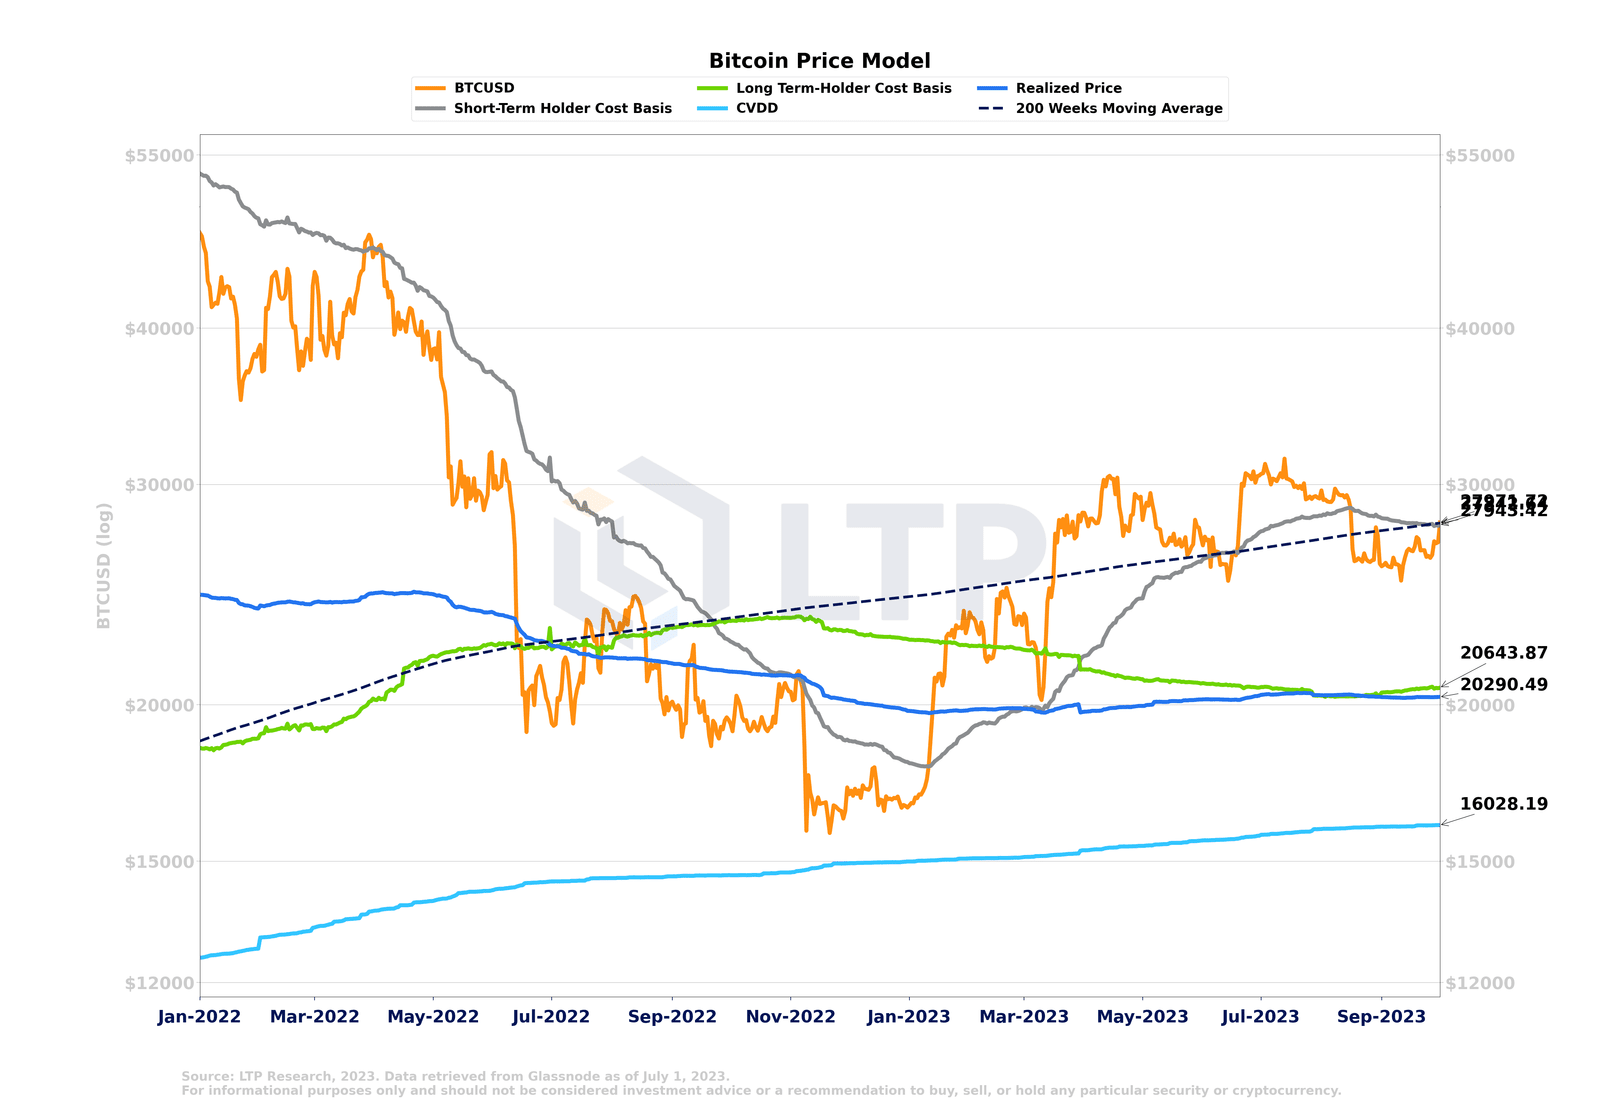
In September, Bitcoin price consolidated below the 200-week moving average and short-term holders’ cost basis. The 200-week moving average is a commonly used trend indicator that is considered significant because prices below this level may signal that Bitcoin is likely to shift into a downtrend. Currently, the price is retesting this level. Additionally, the realized price and cost basis for long-term holders is located at $20,600.
2.3 The total circulating supply of the top 4 stablecoins continues to decline, and the number of ETH staked increases
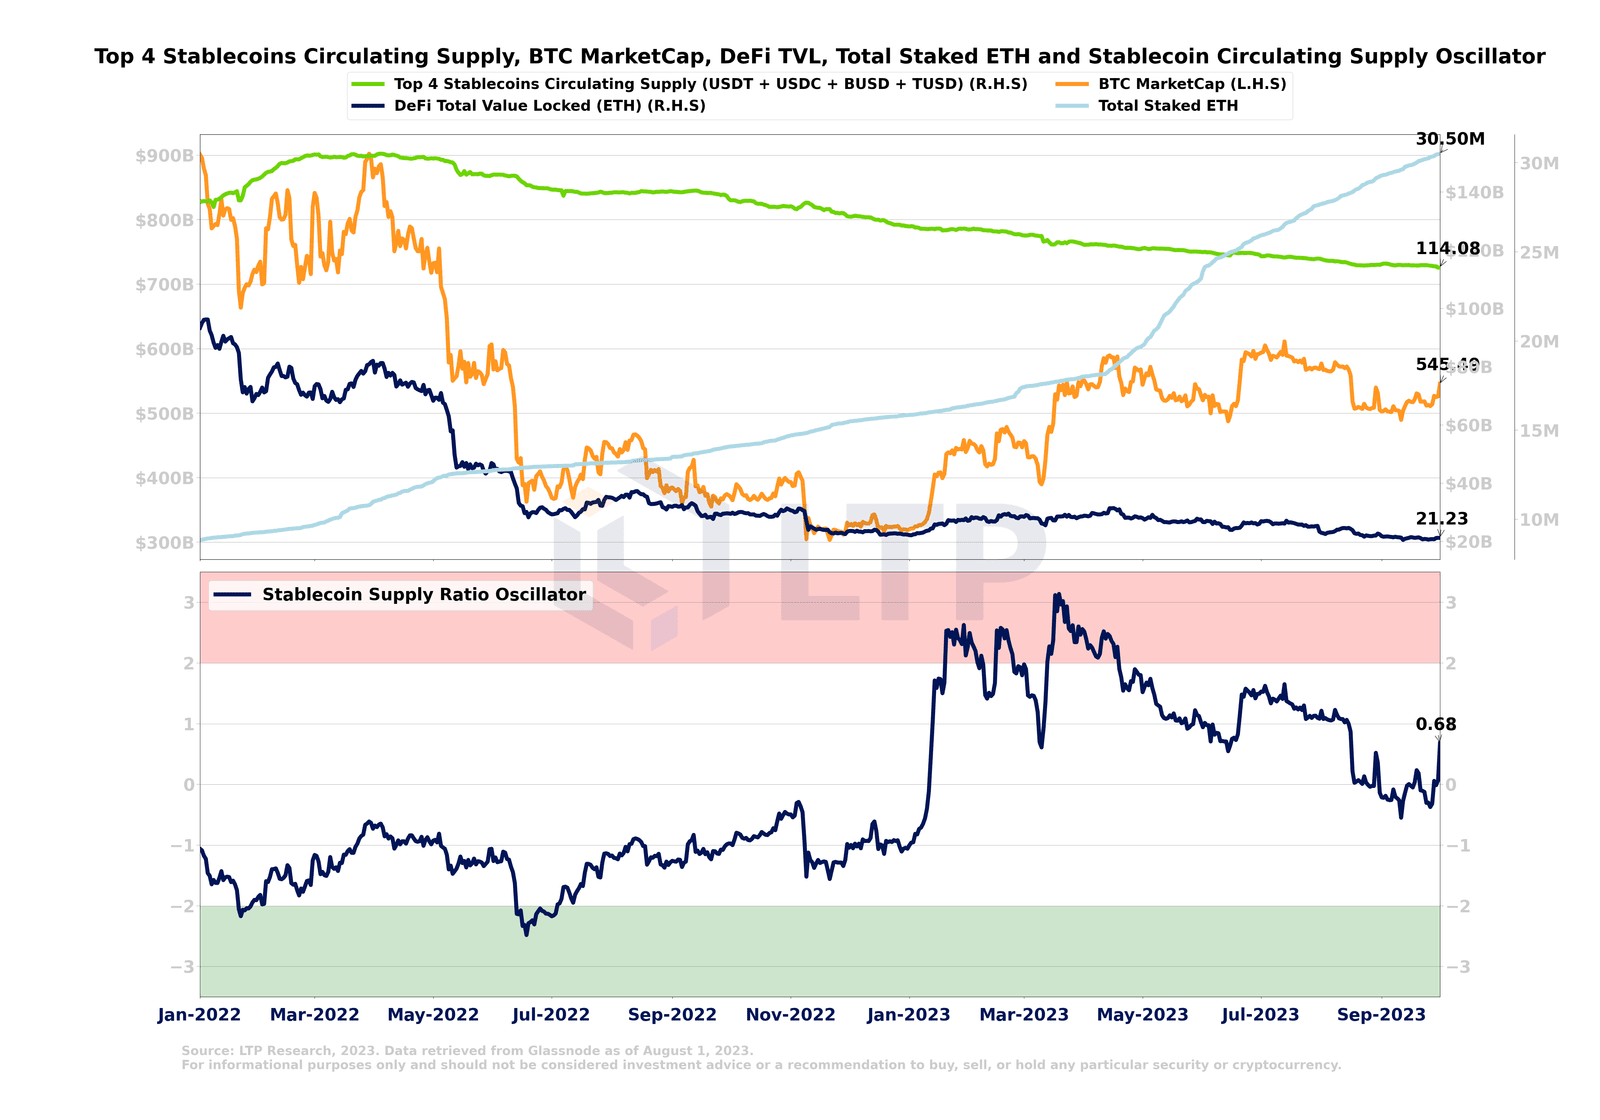
Bitcoin’s market cap remained stable in September as prices consolidated throughout the month. Meanwhile, the number of Ethereum staked continued to increase, reaching 30.5 million, with more Ethereum holders staking Ethereum to earn staking rewards. According to StakingRewards, the current staking yield is 3.5%. Additionally, DeFi’s total locked value (TVL) remains subdued, at $21.2 billion at the end of the month. The circulating supply of the top four stablecoins continued to decline, reaching $114 billion.
2.4 Cryptocurrency exchange trading volume in September
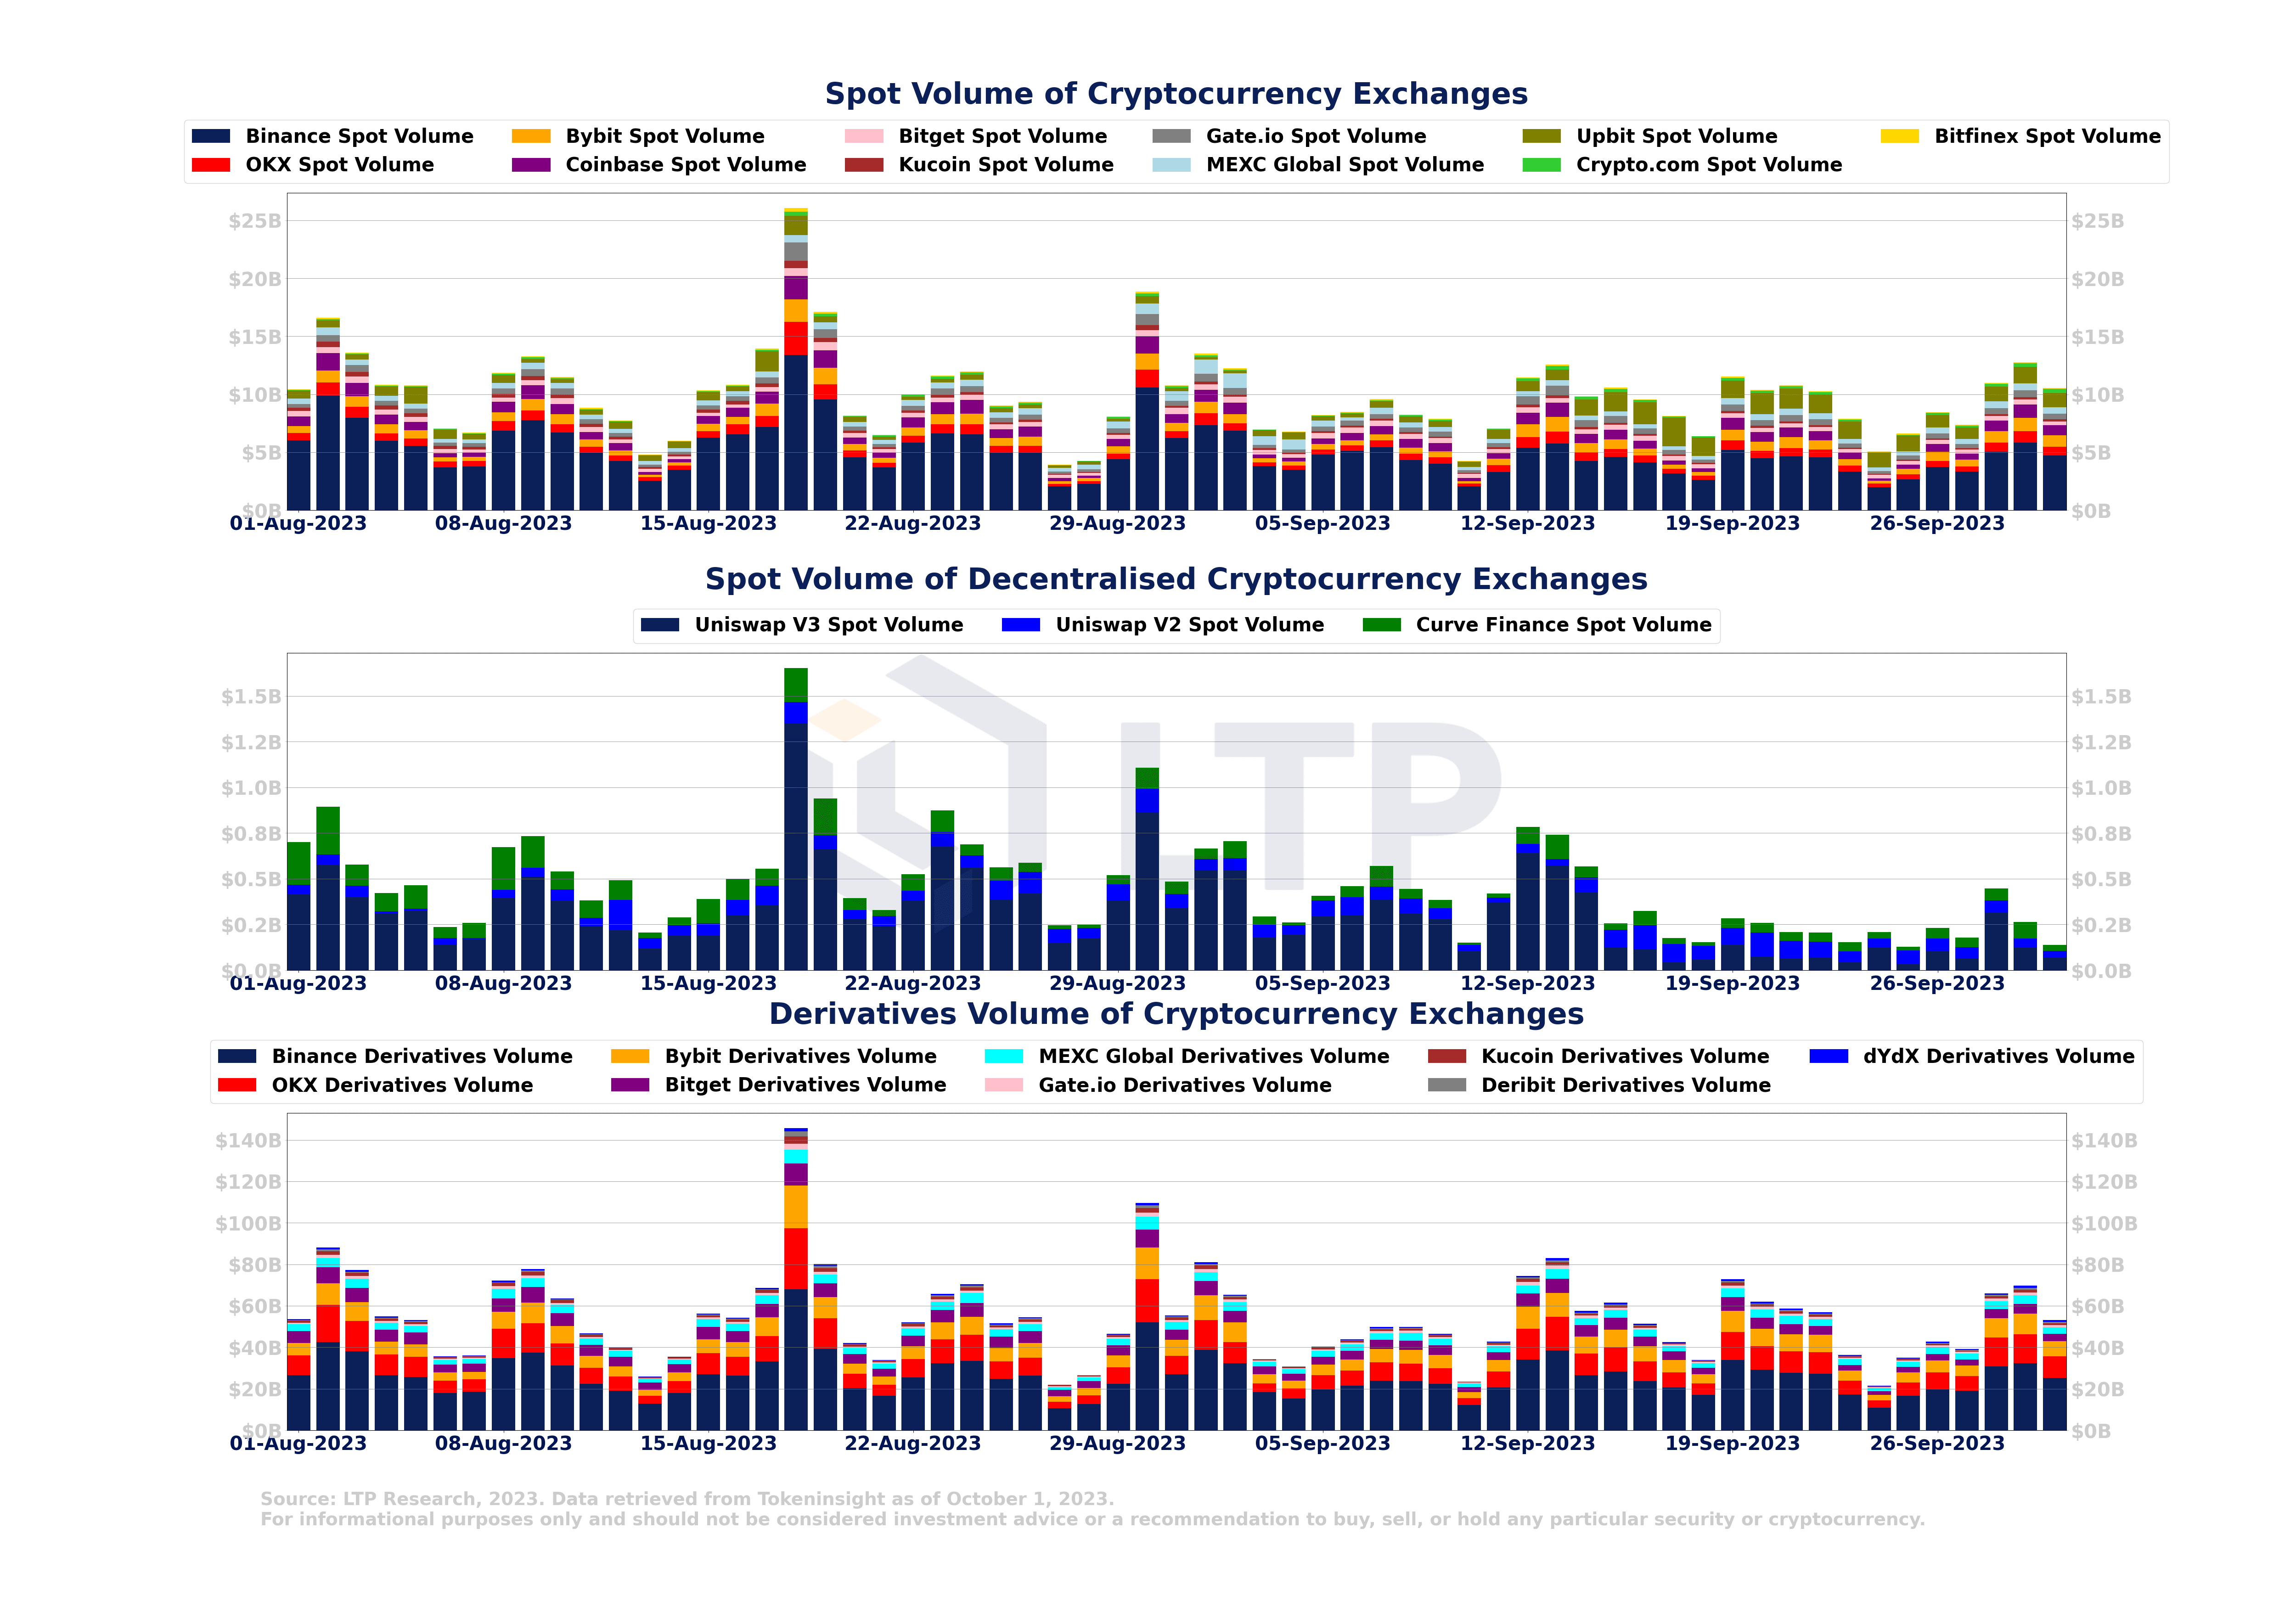
In September, spot trading volumes on centralized exchanges remained relatively stable compared to August. However, Upbit saw a significant increase in trading volumes. On the other hand, spot trading volumes on decentralized exchanges declined in September. In terms of derivatives, trading volumes on major centralized exchanges did not change much compared to August.
2.5 Binance 20 major futures trading pairs
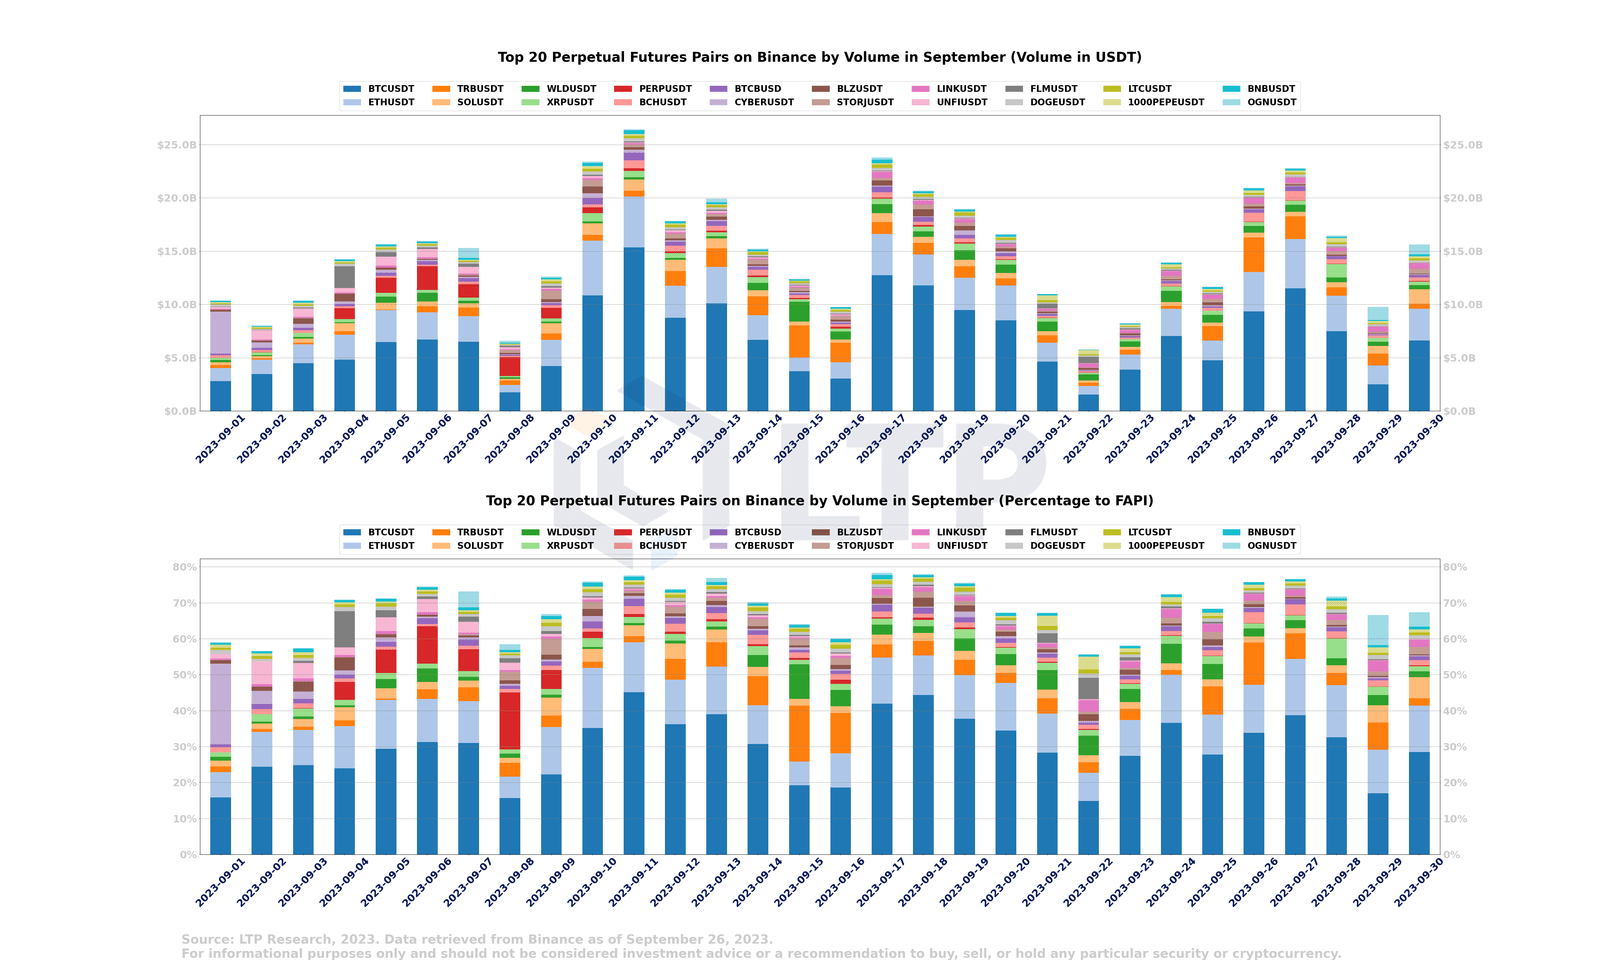
In early September, CYBER and PERP trading volumes increased significantly. Likewise, TRB’s trading volume increased significantly in mid-September.
Weekend trading volume is generally sluggish for Bitcoin and Ethereum. However, certain altcoins such as PERP, TRB, and WLD see more active trading activity during the weekend.
2.6 Binance 20 major transactions COIN-MARGINED trading pairs
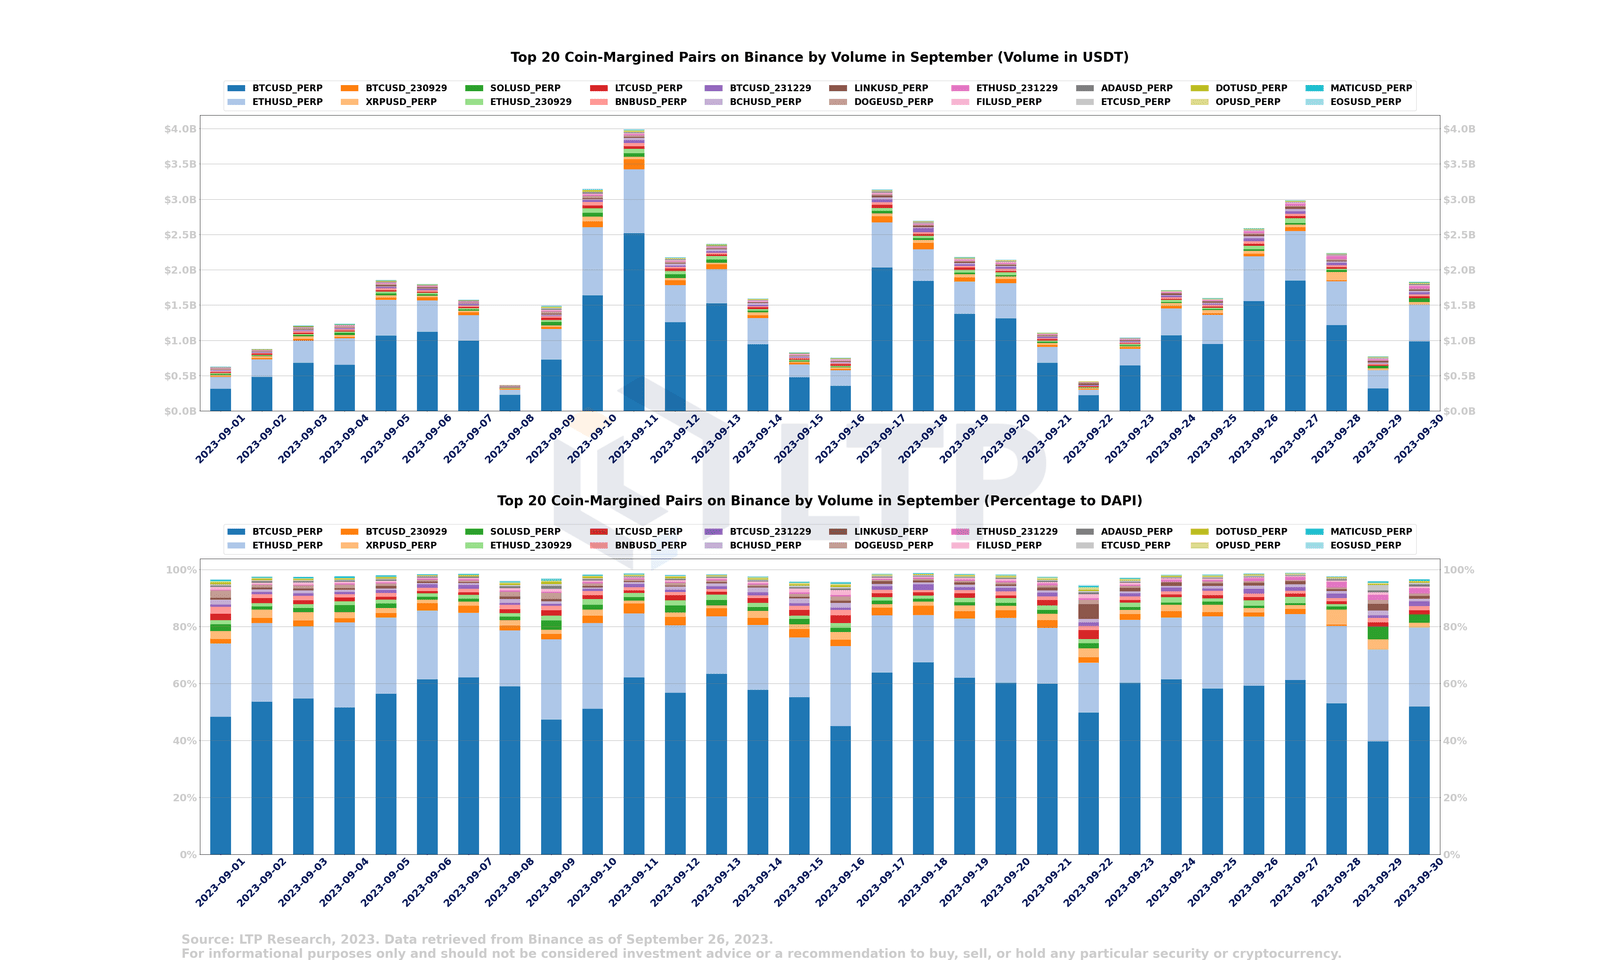
BTCUSD_PERP and ETHUSD_PERP account for nearly 80% of the total Coin-Margined trading volume. In contrast, trading volume tends to be relatively low on weekends. In addition to Bitcoin and Ethereum, the most actively traded Coin-Margined trading pairs include SOL, LTC, LINK and BNB.
2.7 Binance Bitcoin and Ethereum Spot/Perpetual Futures Trading Volume
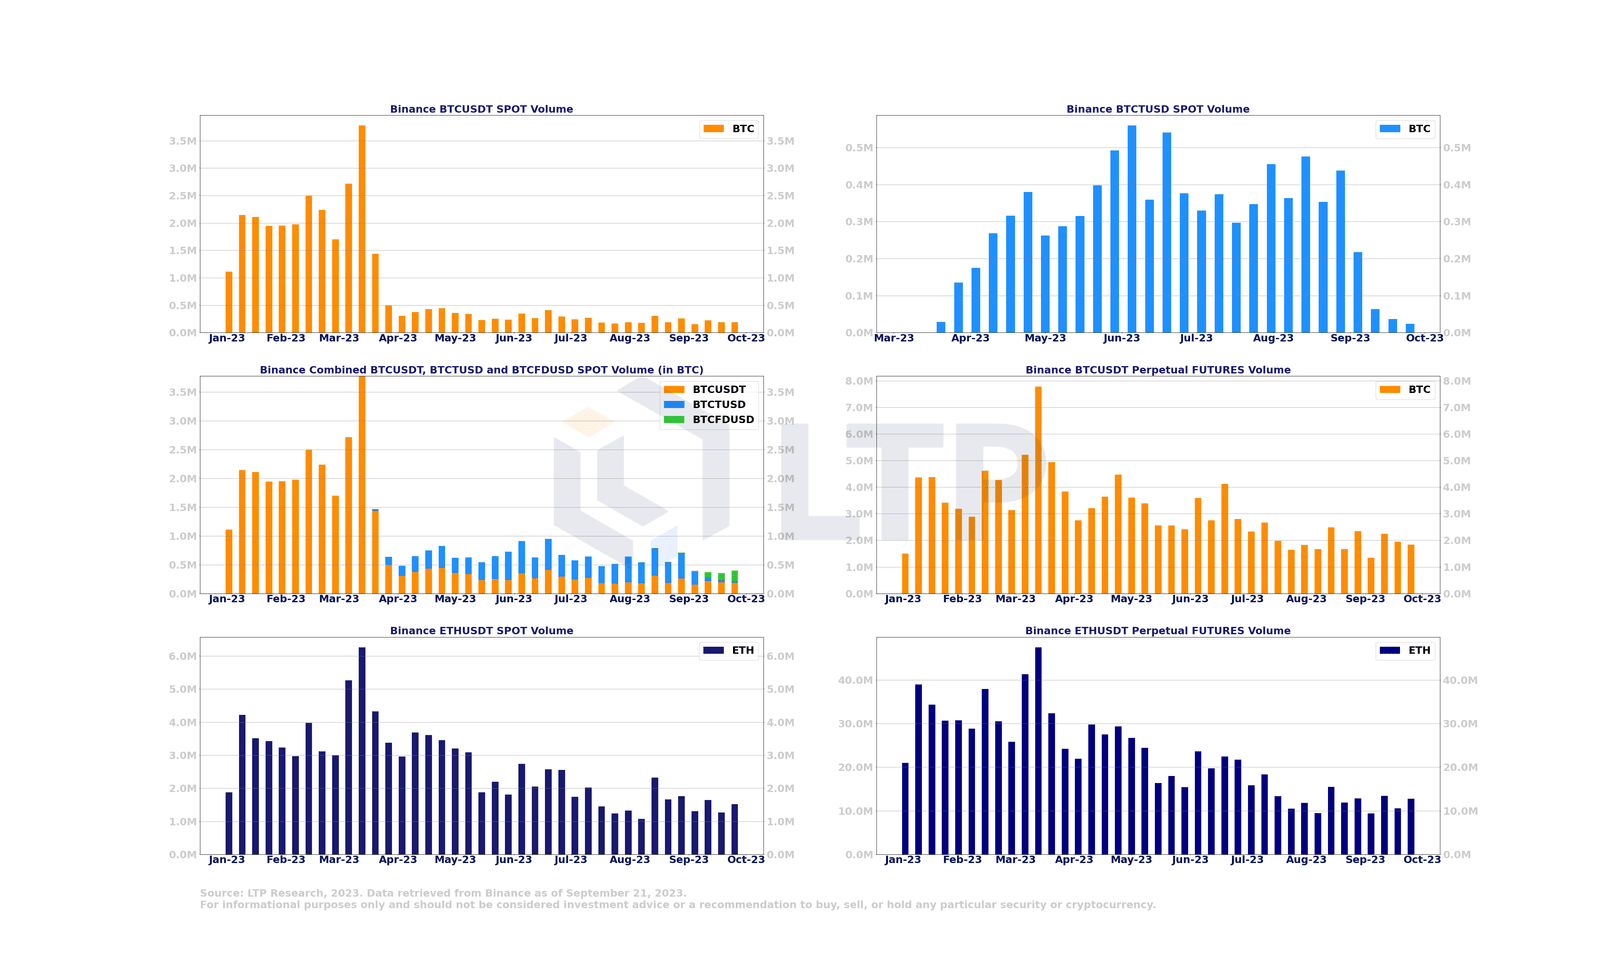
In September, Bitcoin SPOT trading volume on Binance hit a new low for the year, lower than the previous month. Notably, trading activity shifted from BTCTUSD to BTCFDUSD, as shown in the chart, BTCTUSD's trading volume dropped significantly, while BTCFDUSD's trading volume increased accordingly. Meanwhile, trading volumes for Bitcoin and Ethereum perpetual futures remained relatively stable, albeit with a slight downward trend.
2.8 BYBIT BTCUSDT/ETHUSDT spot and perpetual futures trading volume
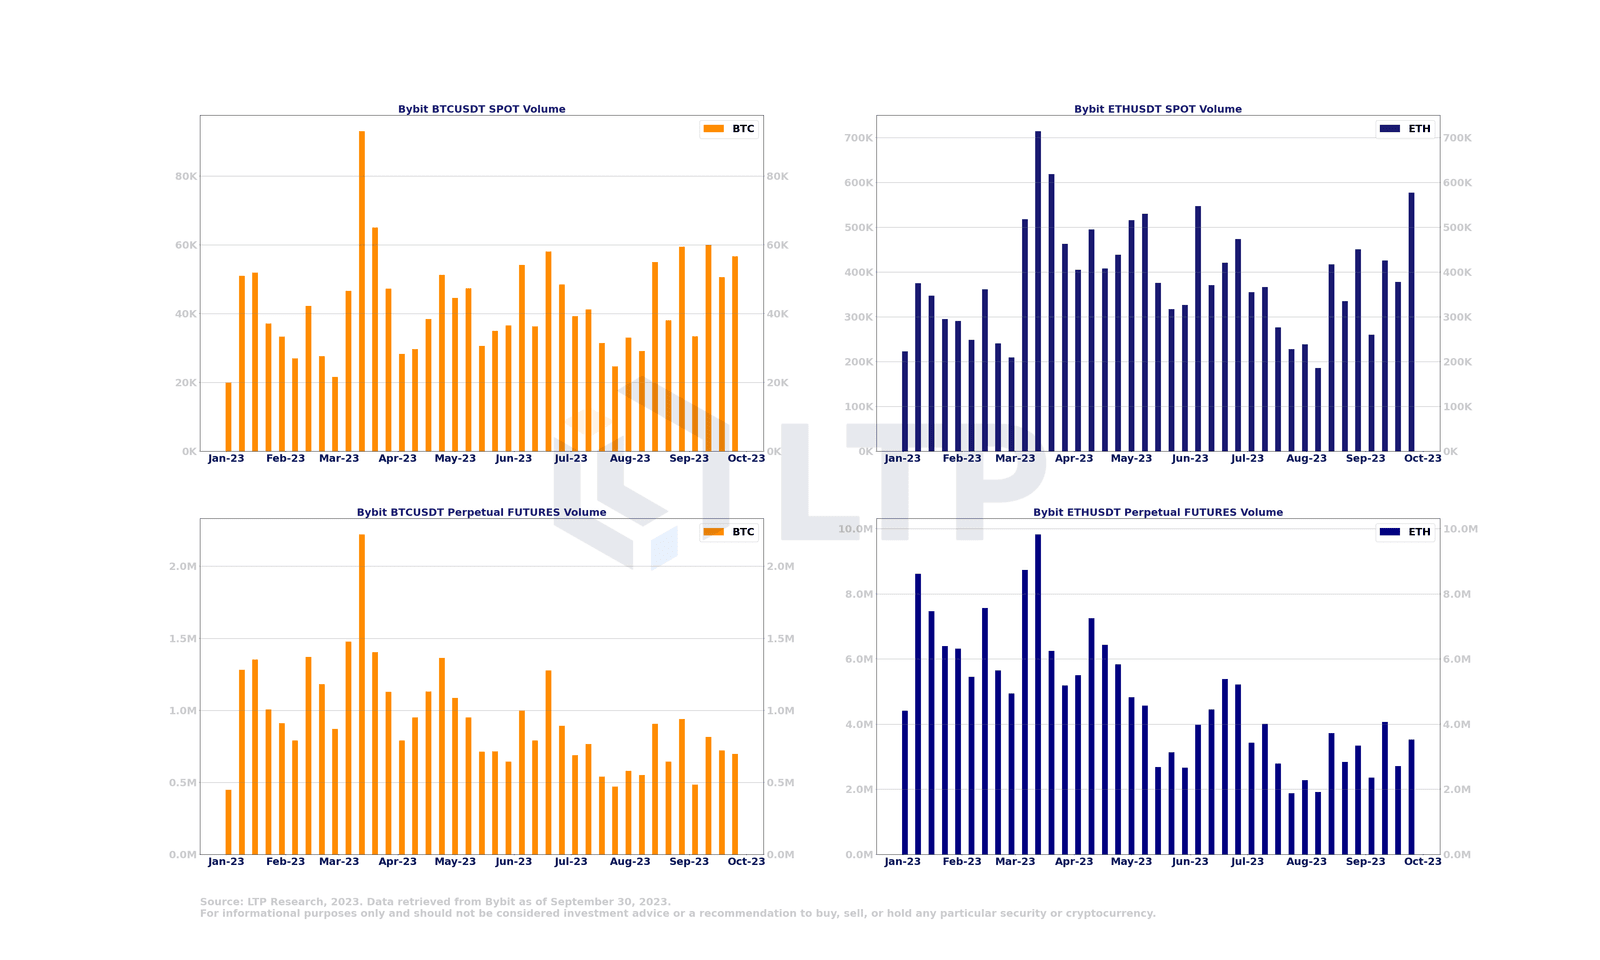
In September, trading volumes in the Bitcoin and Ethereum spot markets on Bybit rose. However, trading volumes in Bitcoin and Ethereum perpetual futures remained relatively stable compared to August.
2.9 OKX BTCUSDT/ETHUSDT spot and perpetual futures trading volume
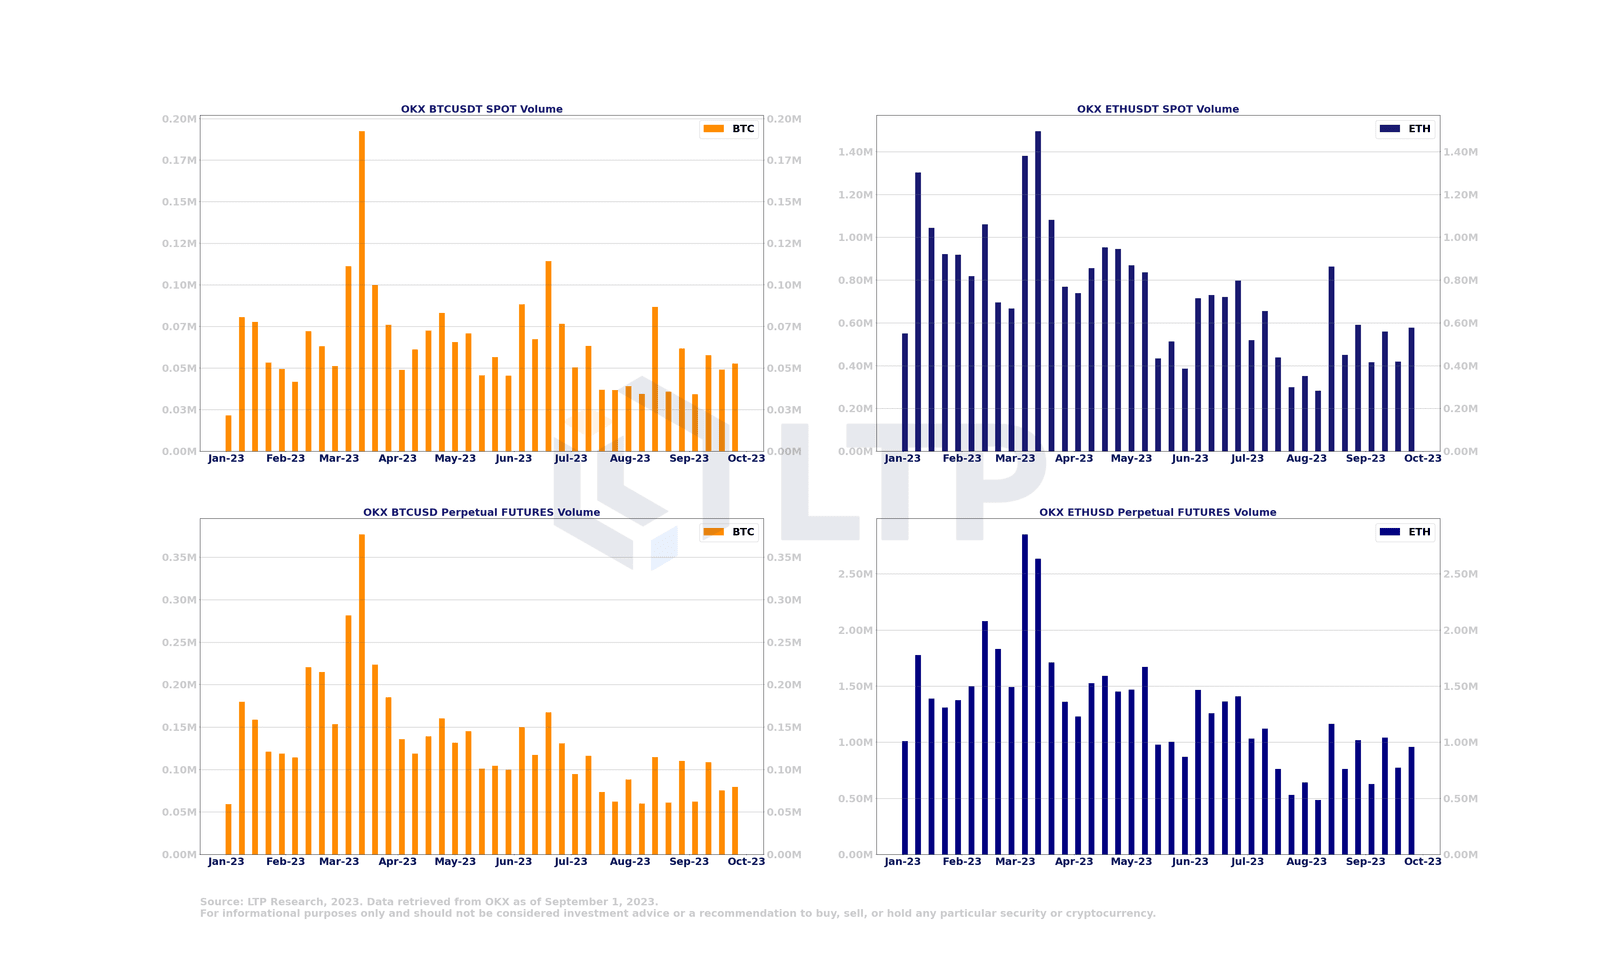
OKX saw an increase in trading volumes in the Bitcoin and Ethereum spot markets in September. Additionally, trading volumes in the Bitcoin and Ethereum perpetual futures markets also increased slightly compared to August.
2.10 Price Density - Binance Perpetual Futures Trading Pairs
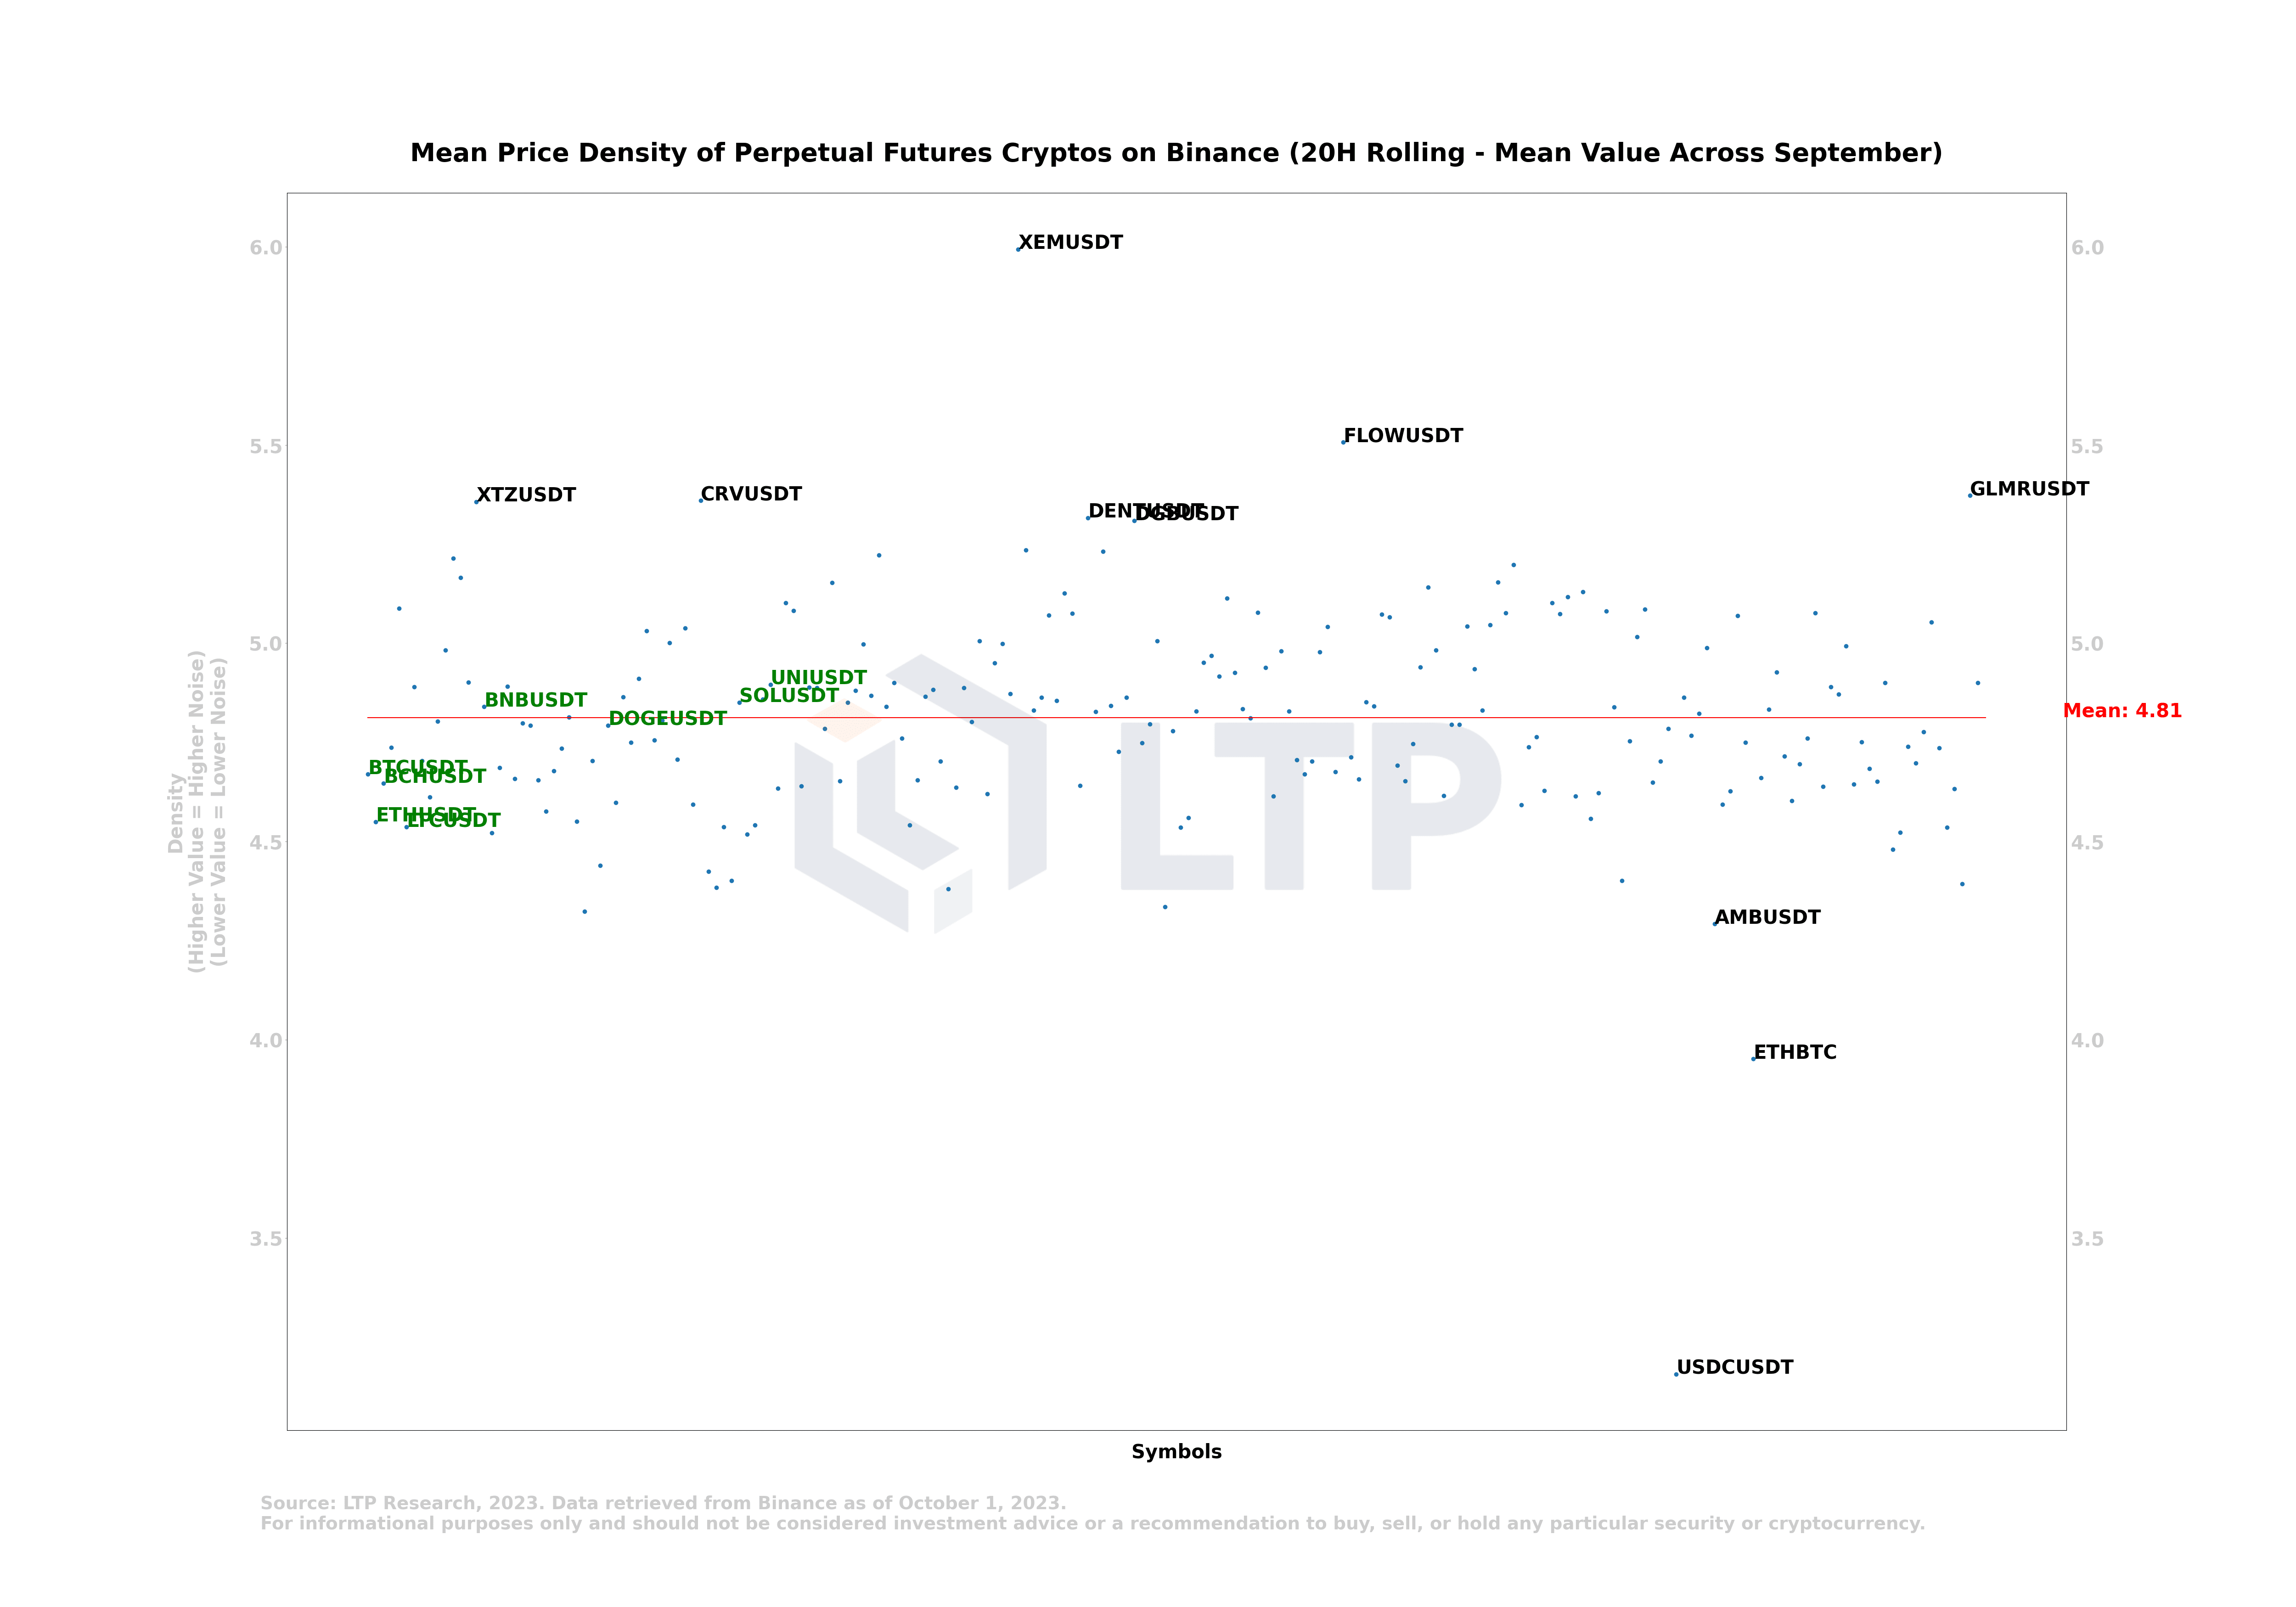
In September, XEMUSDT had the highest price density value, close to 6. On the other hand, AMBUSDT and ETHBTC had the lowest price density values, at 4.3 and 4, respectively. These measurements suggest that XEMUSDT displays more volatile and unstable price behavior, while AMBUSDT and ETHBTC display smoother trend characteristics.
It is important to note that the above measurements are made using a 20-hour rolling method. Different time frames will produce different results when analyzing price density. The choice of time frame will affect the volatility or trend characteristics of a particular asset.
2.11 The annualized volatility of major cryptocurrencies decreased in September
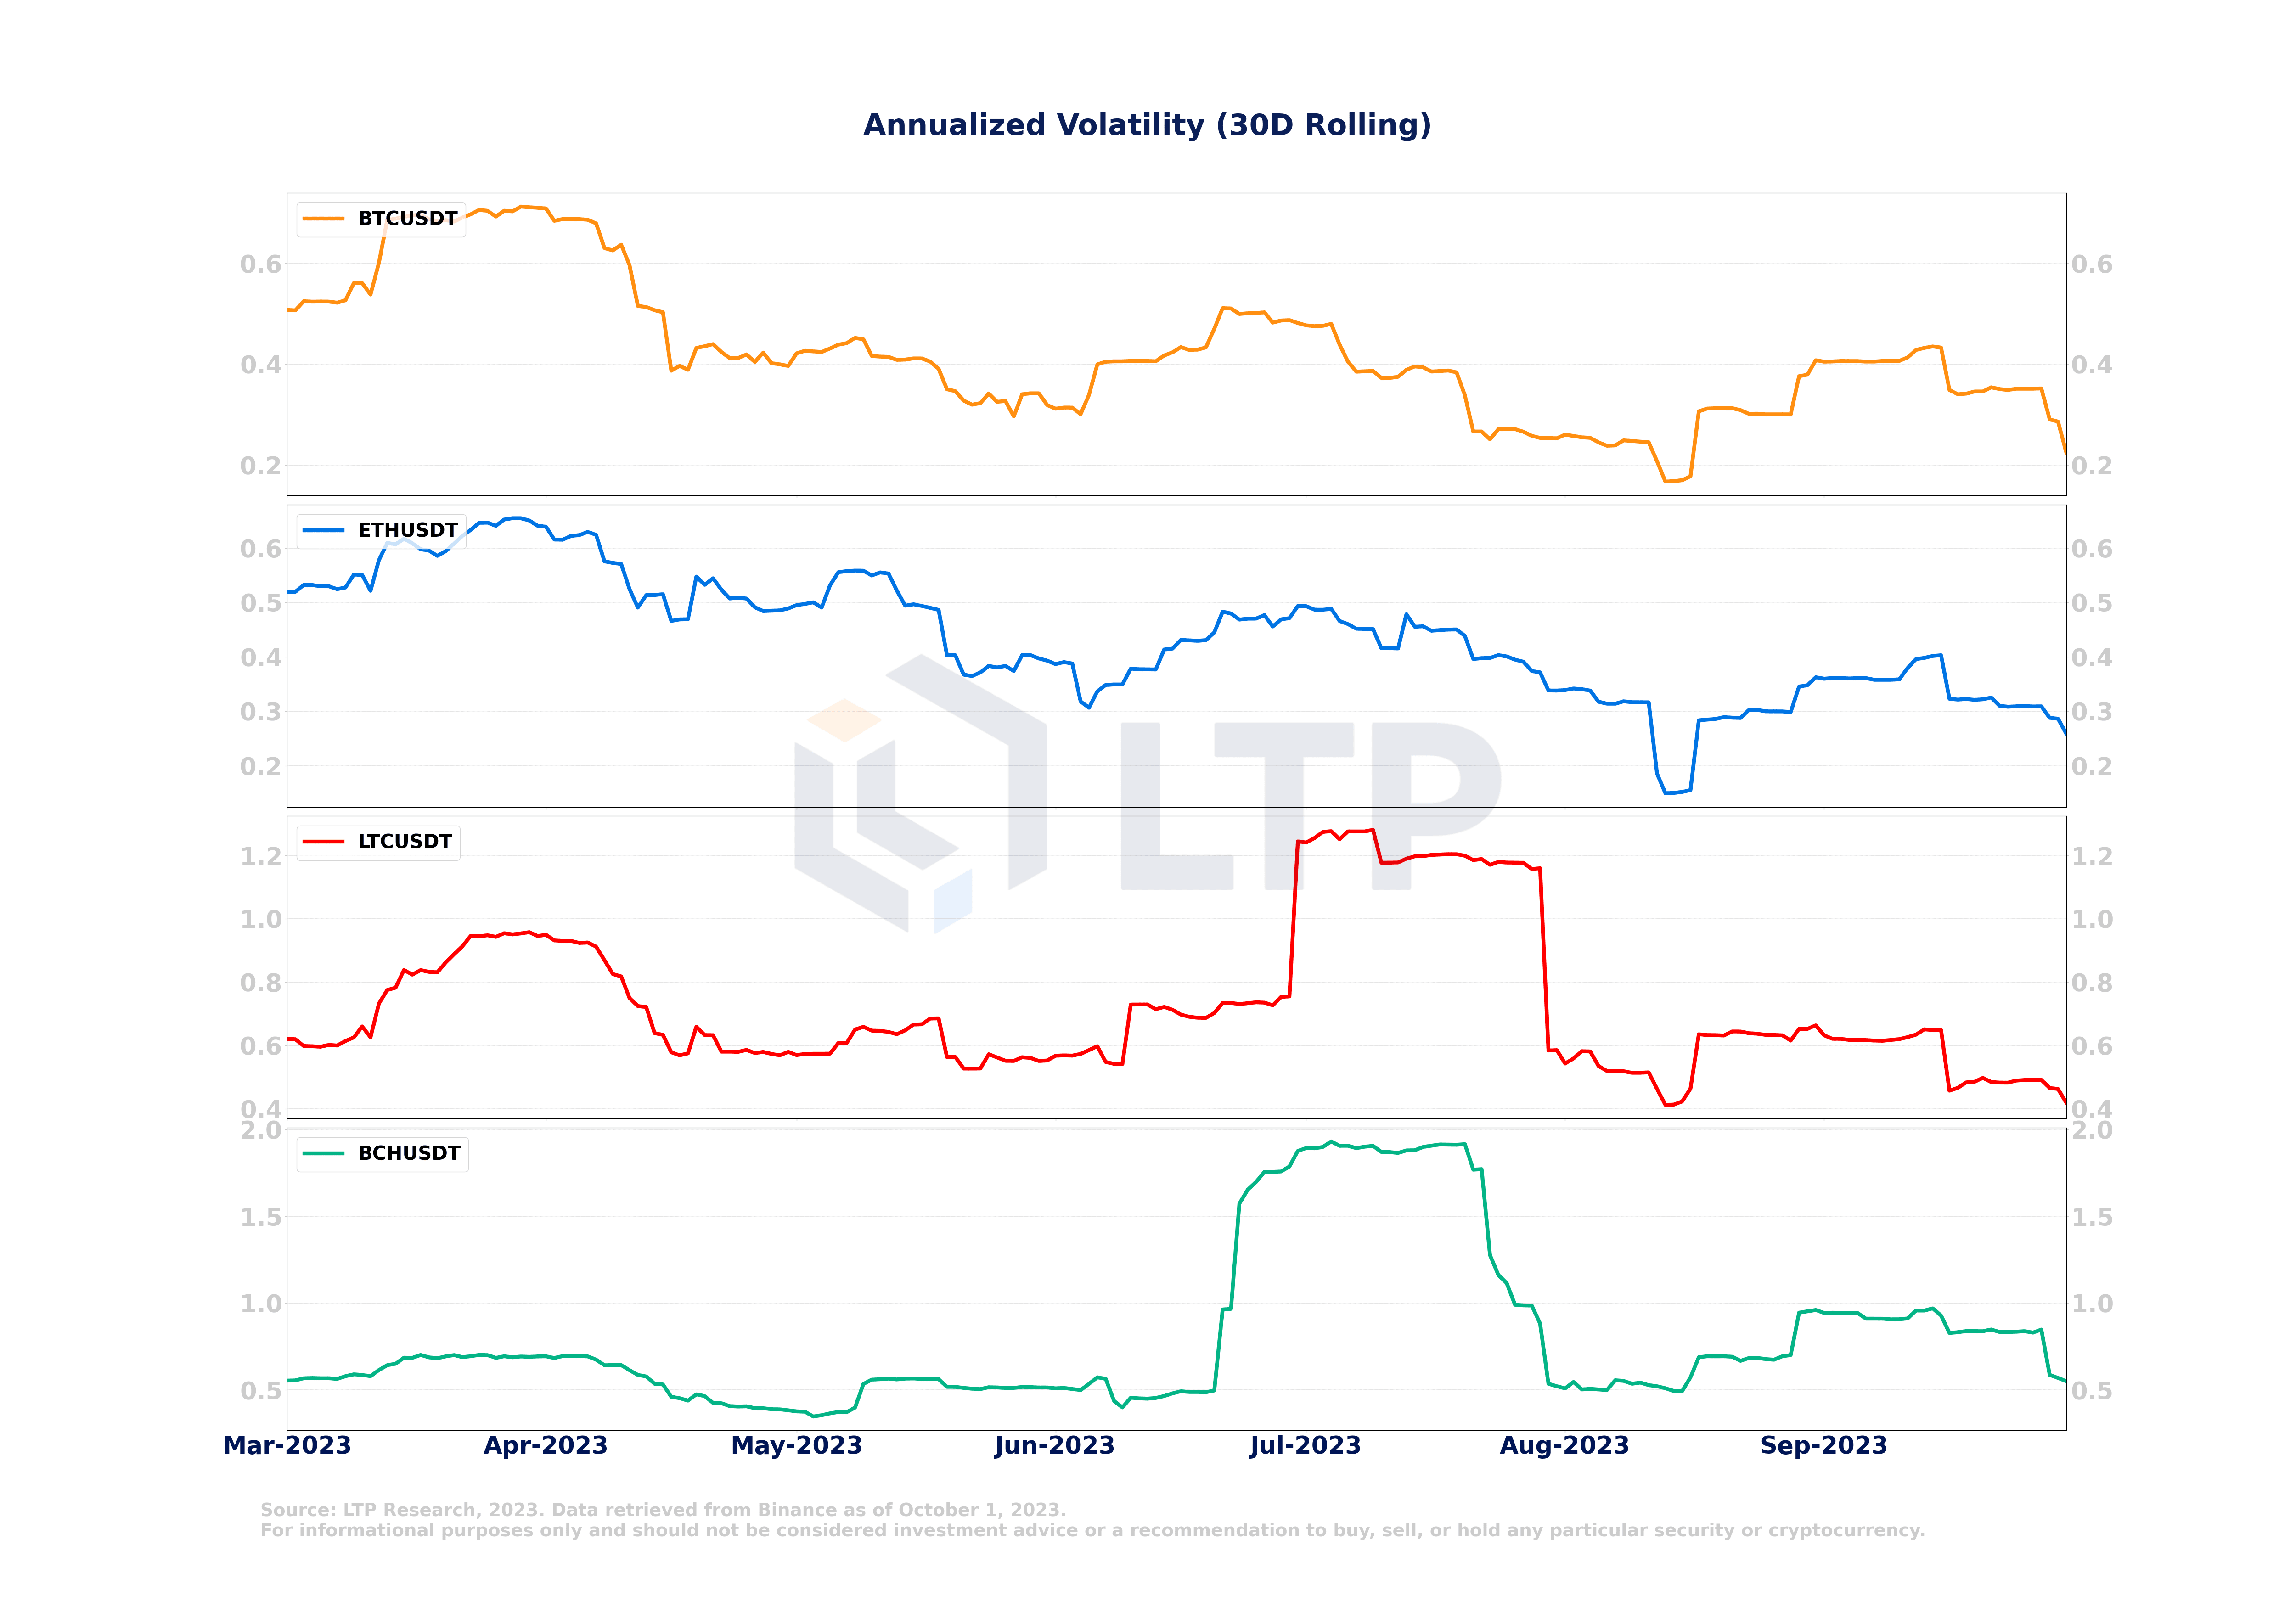
The annualized volatility of major cryptocurrencies including Bitcoin, Ethereum, Litecoin, and Bitcoin Cash declined in September. Specifically, Bitcoin's annualized volatility reached 0.18 in early August and then rose sharply to 0.42 in early September. However, the annualized volatility has gradually declined and has steadily fallen.
2.12 Bitcoin transaction flow (UTC)
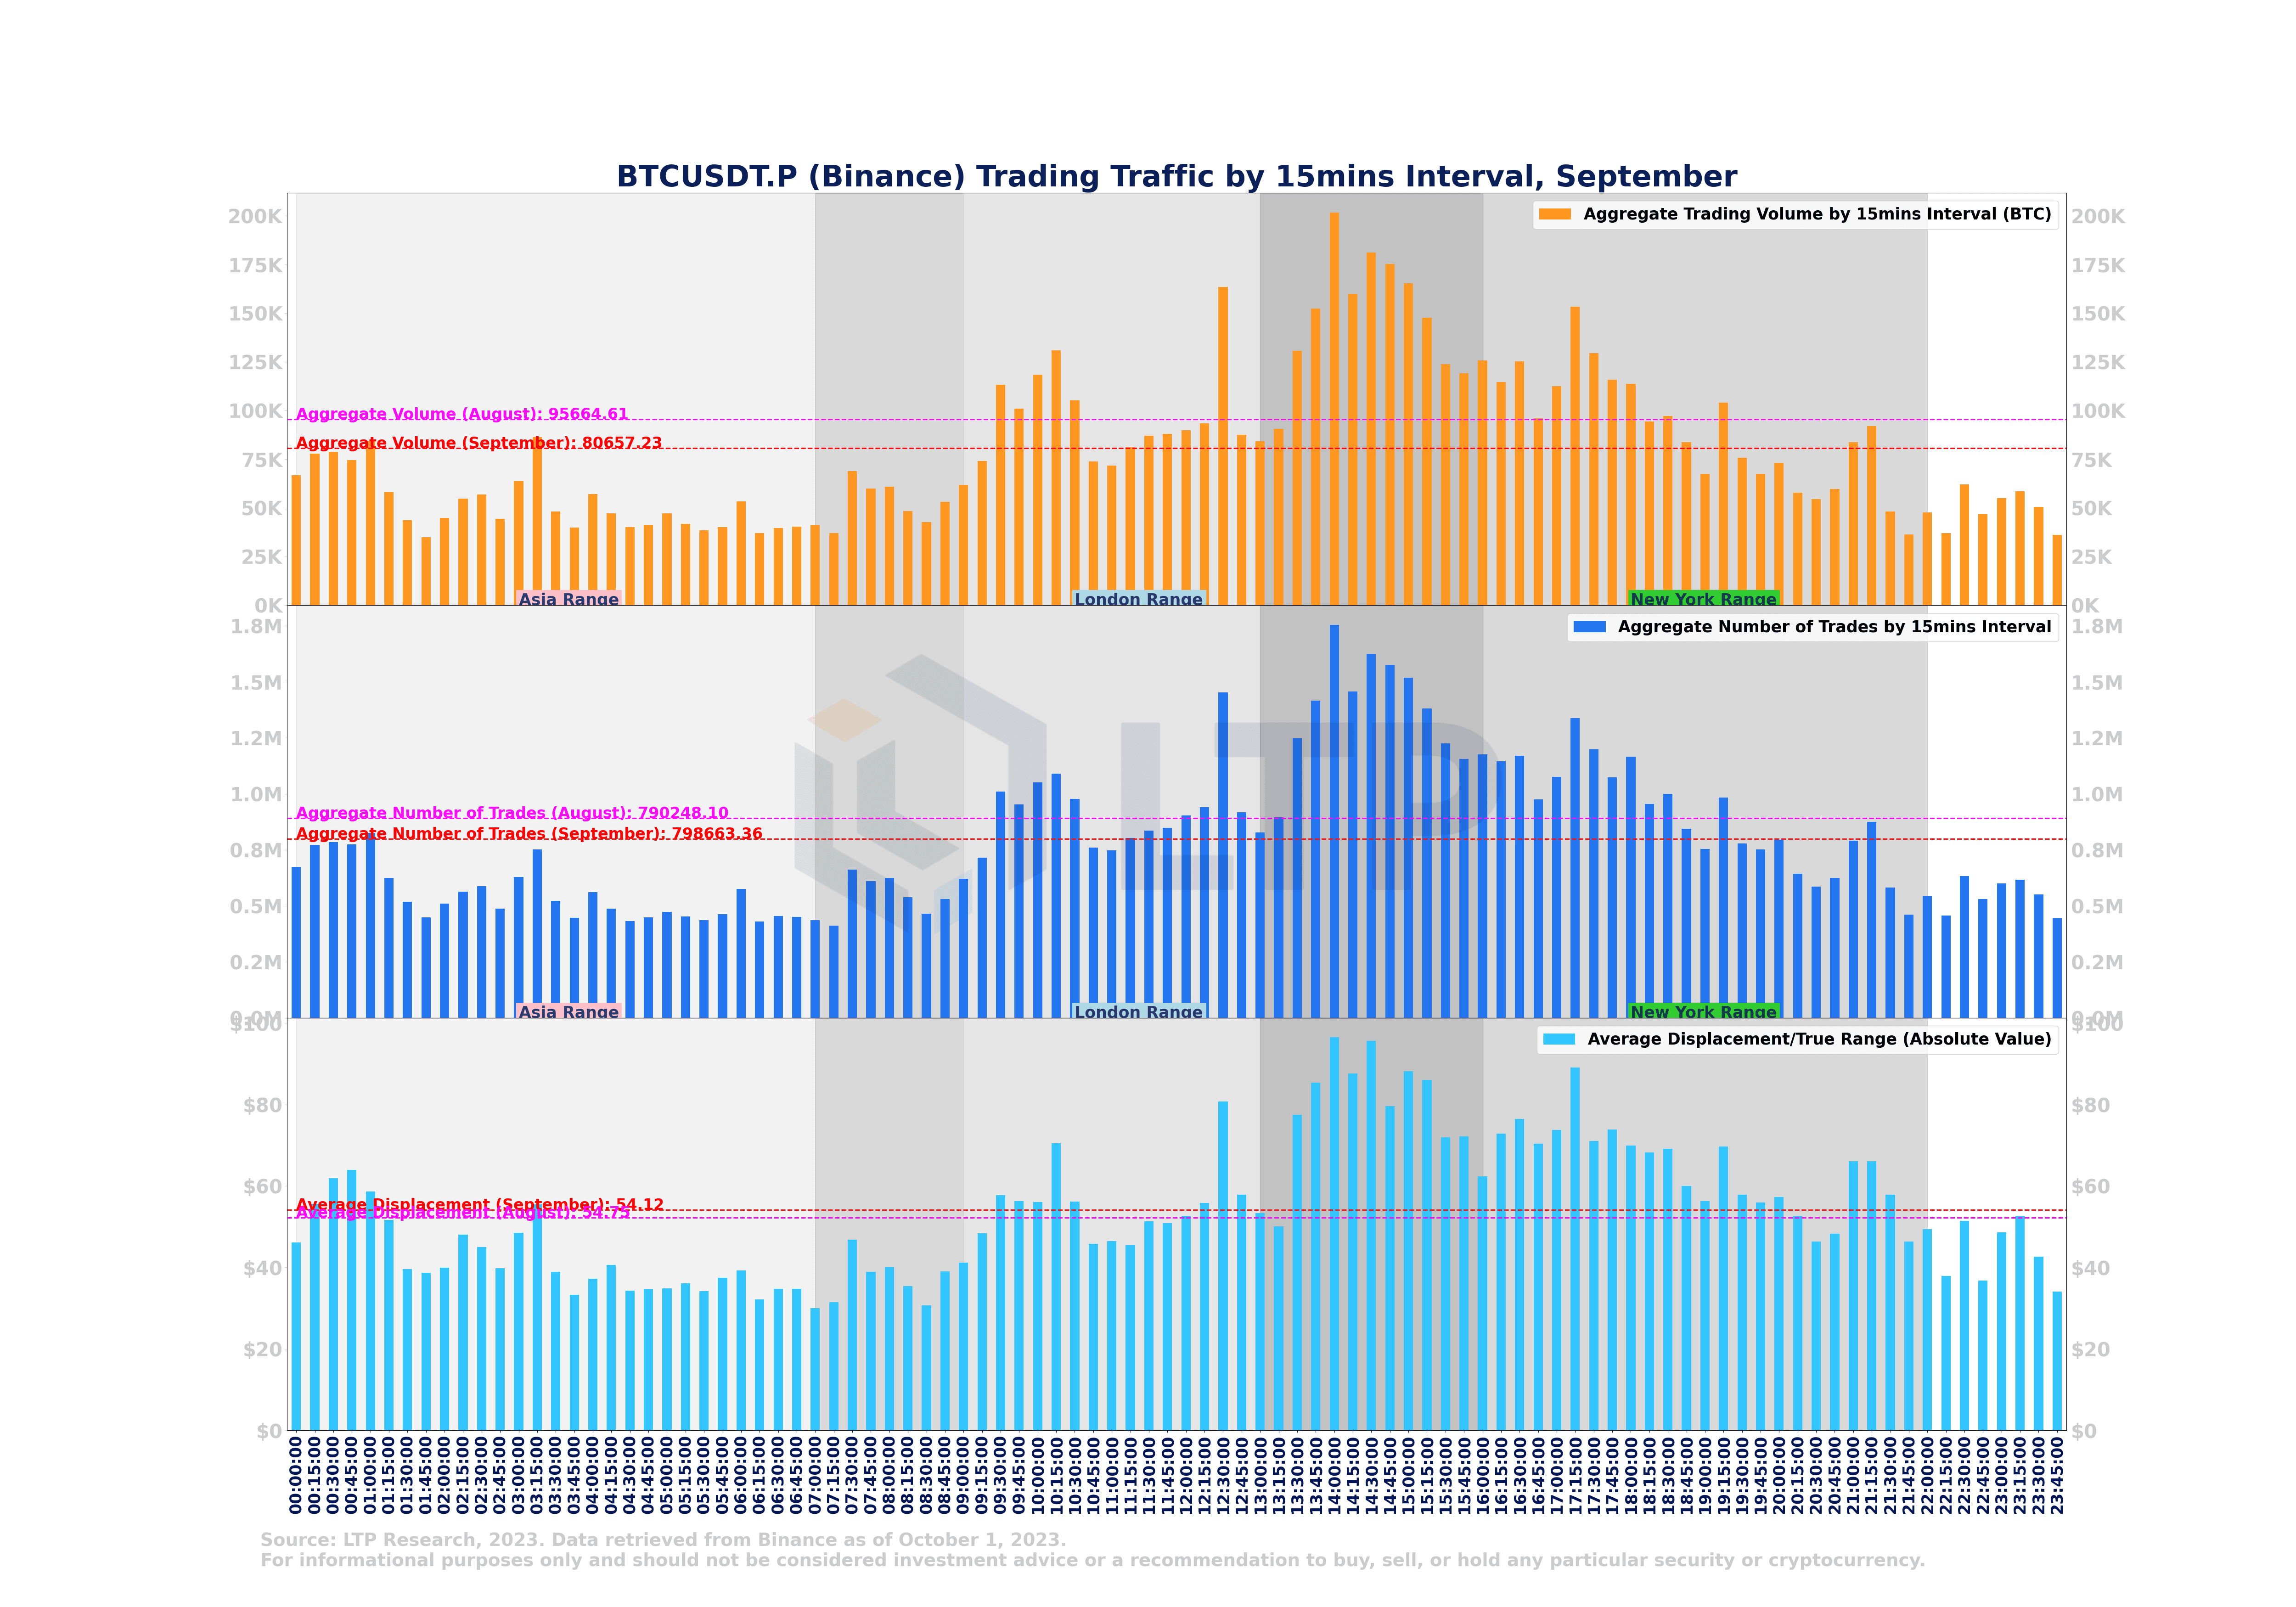
Trading activity for BTCUSDT.P on Binance increases during the overlap between the New York and London trading sessions (13:00 - 16:00 UTC).
2.13 BTCUSDT.P (Binance) 3% Market Depth (September)
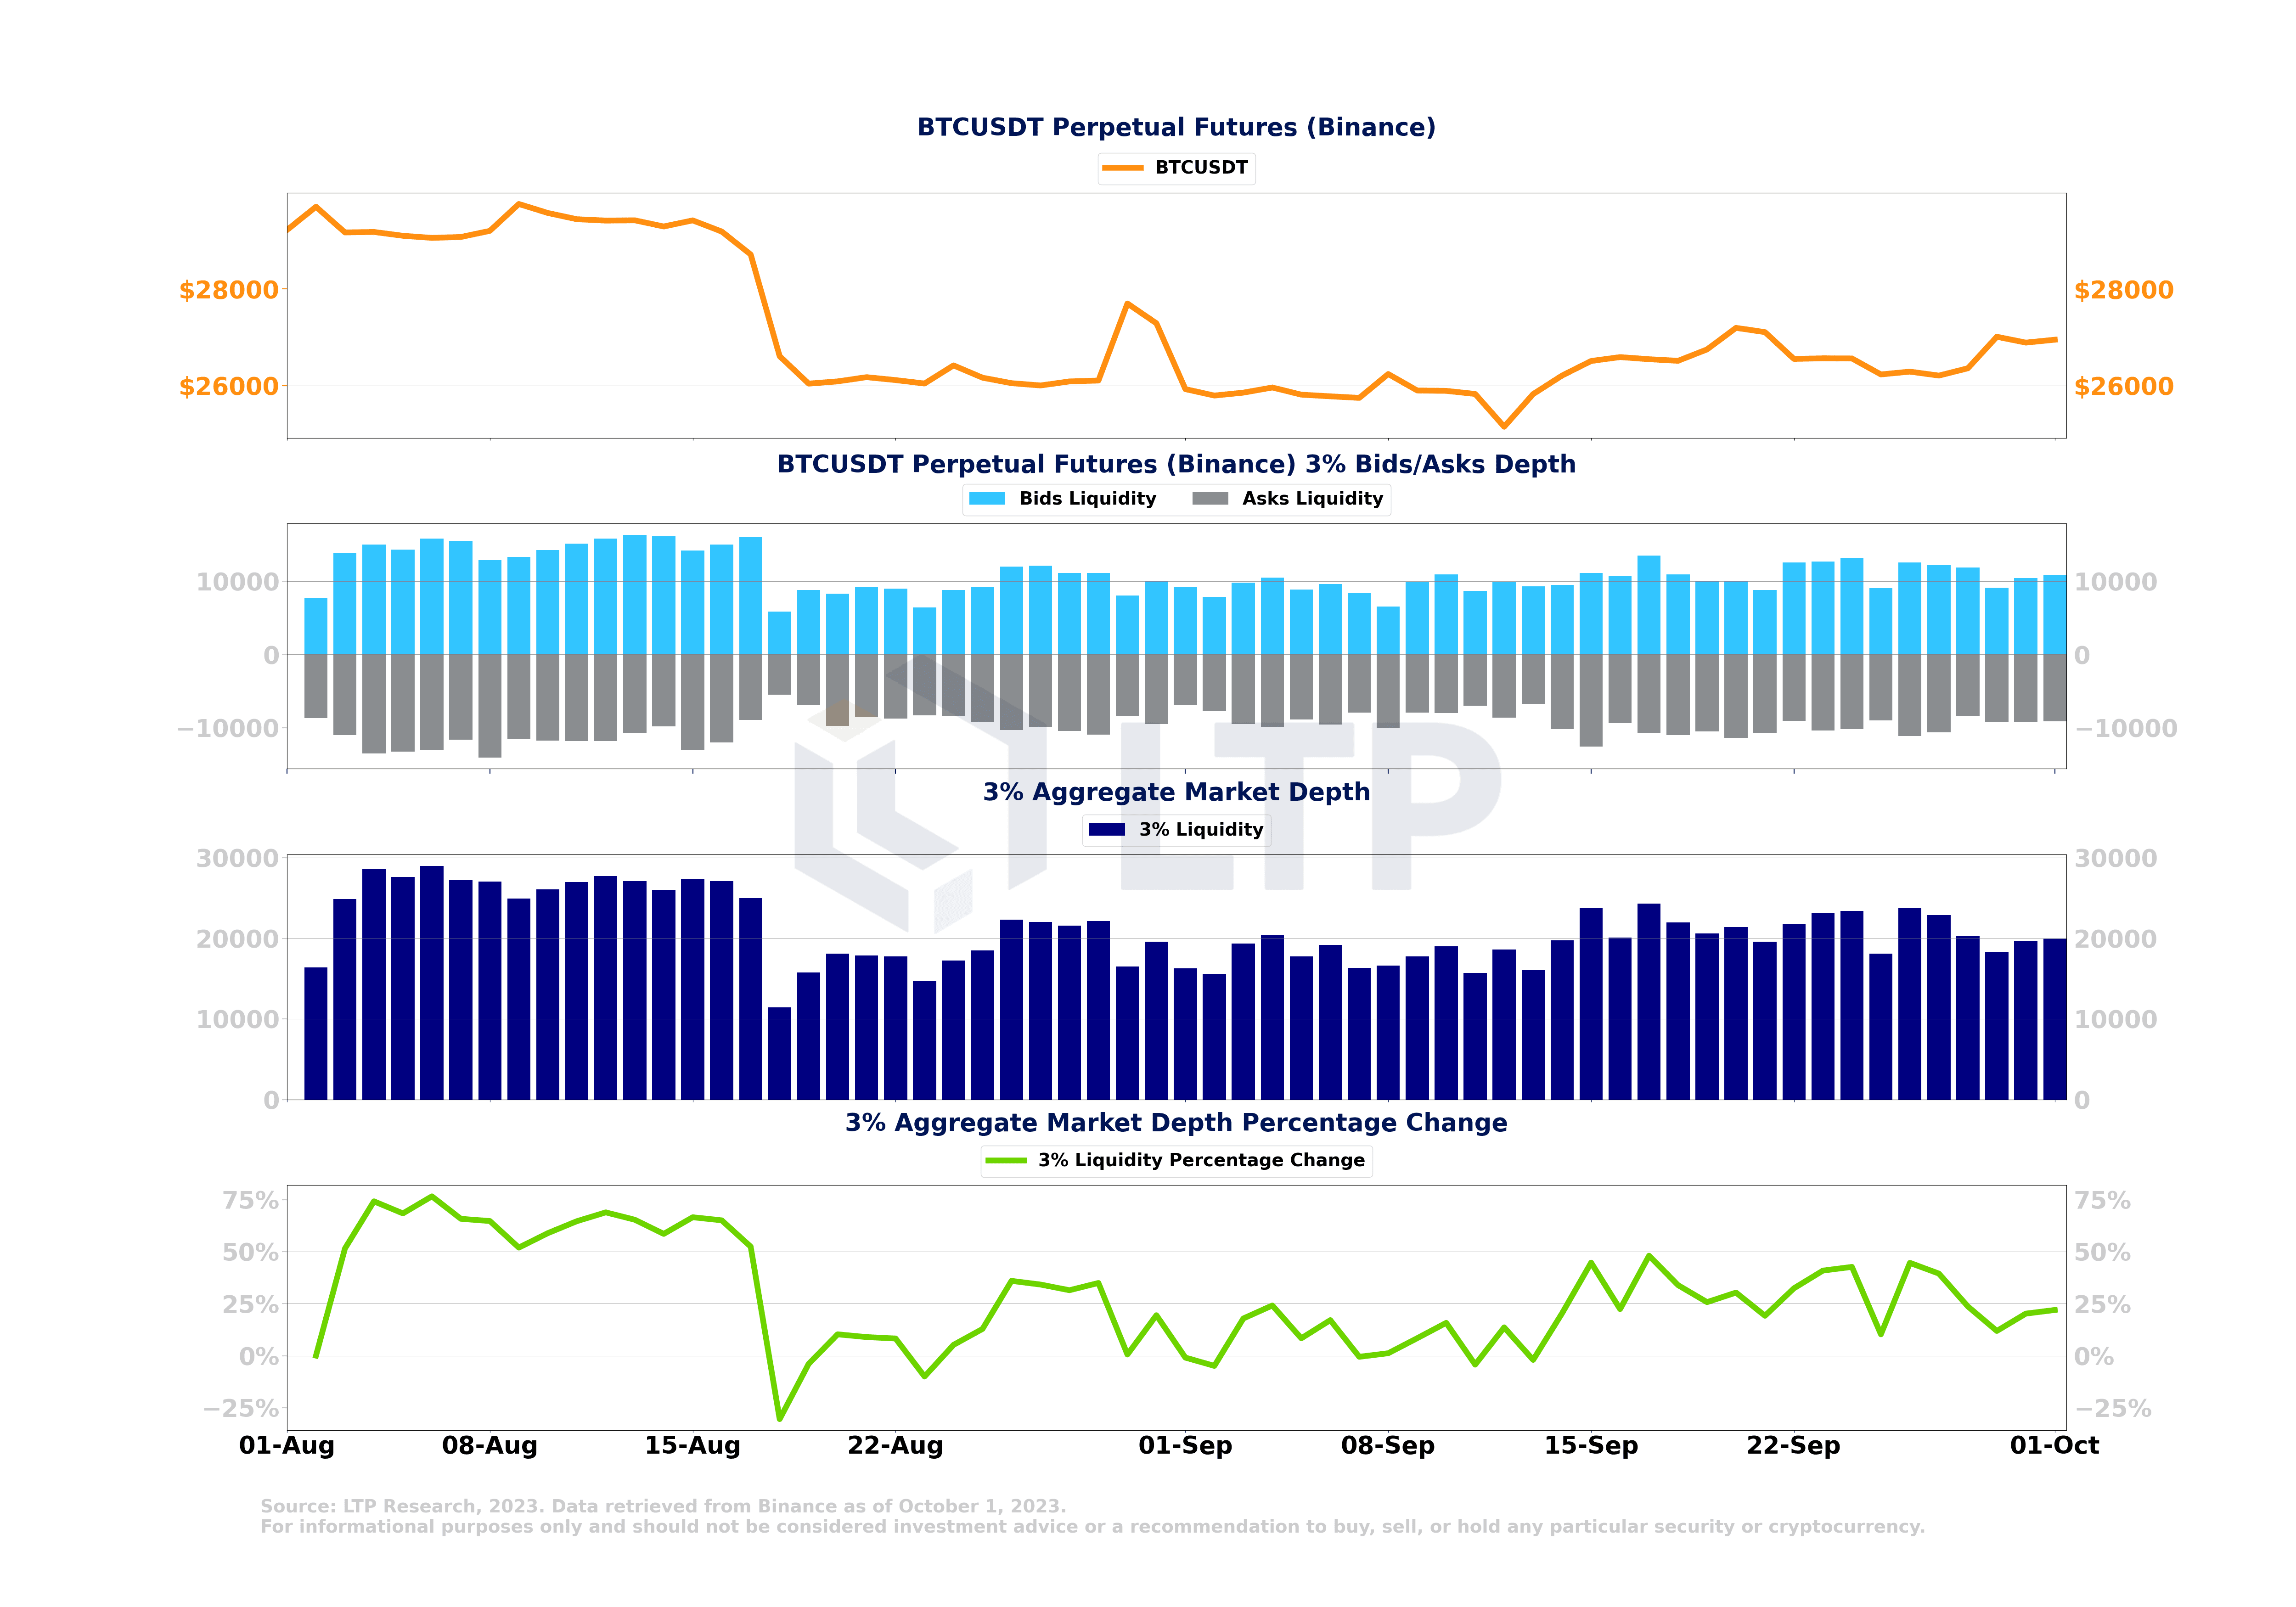
The 3% market depth of BTCUSDT.P (Binance) decreased during the sell-off that occurred on August 16, 2023. However, liquidity gradually recovered and increased and returned to the level of early August.
2.14 Bitcoin perpetual futures total open interest remains low since the last large-scale liquidation
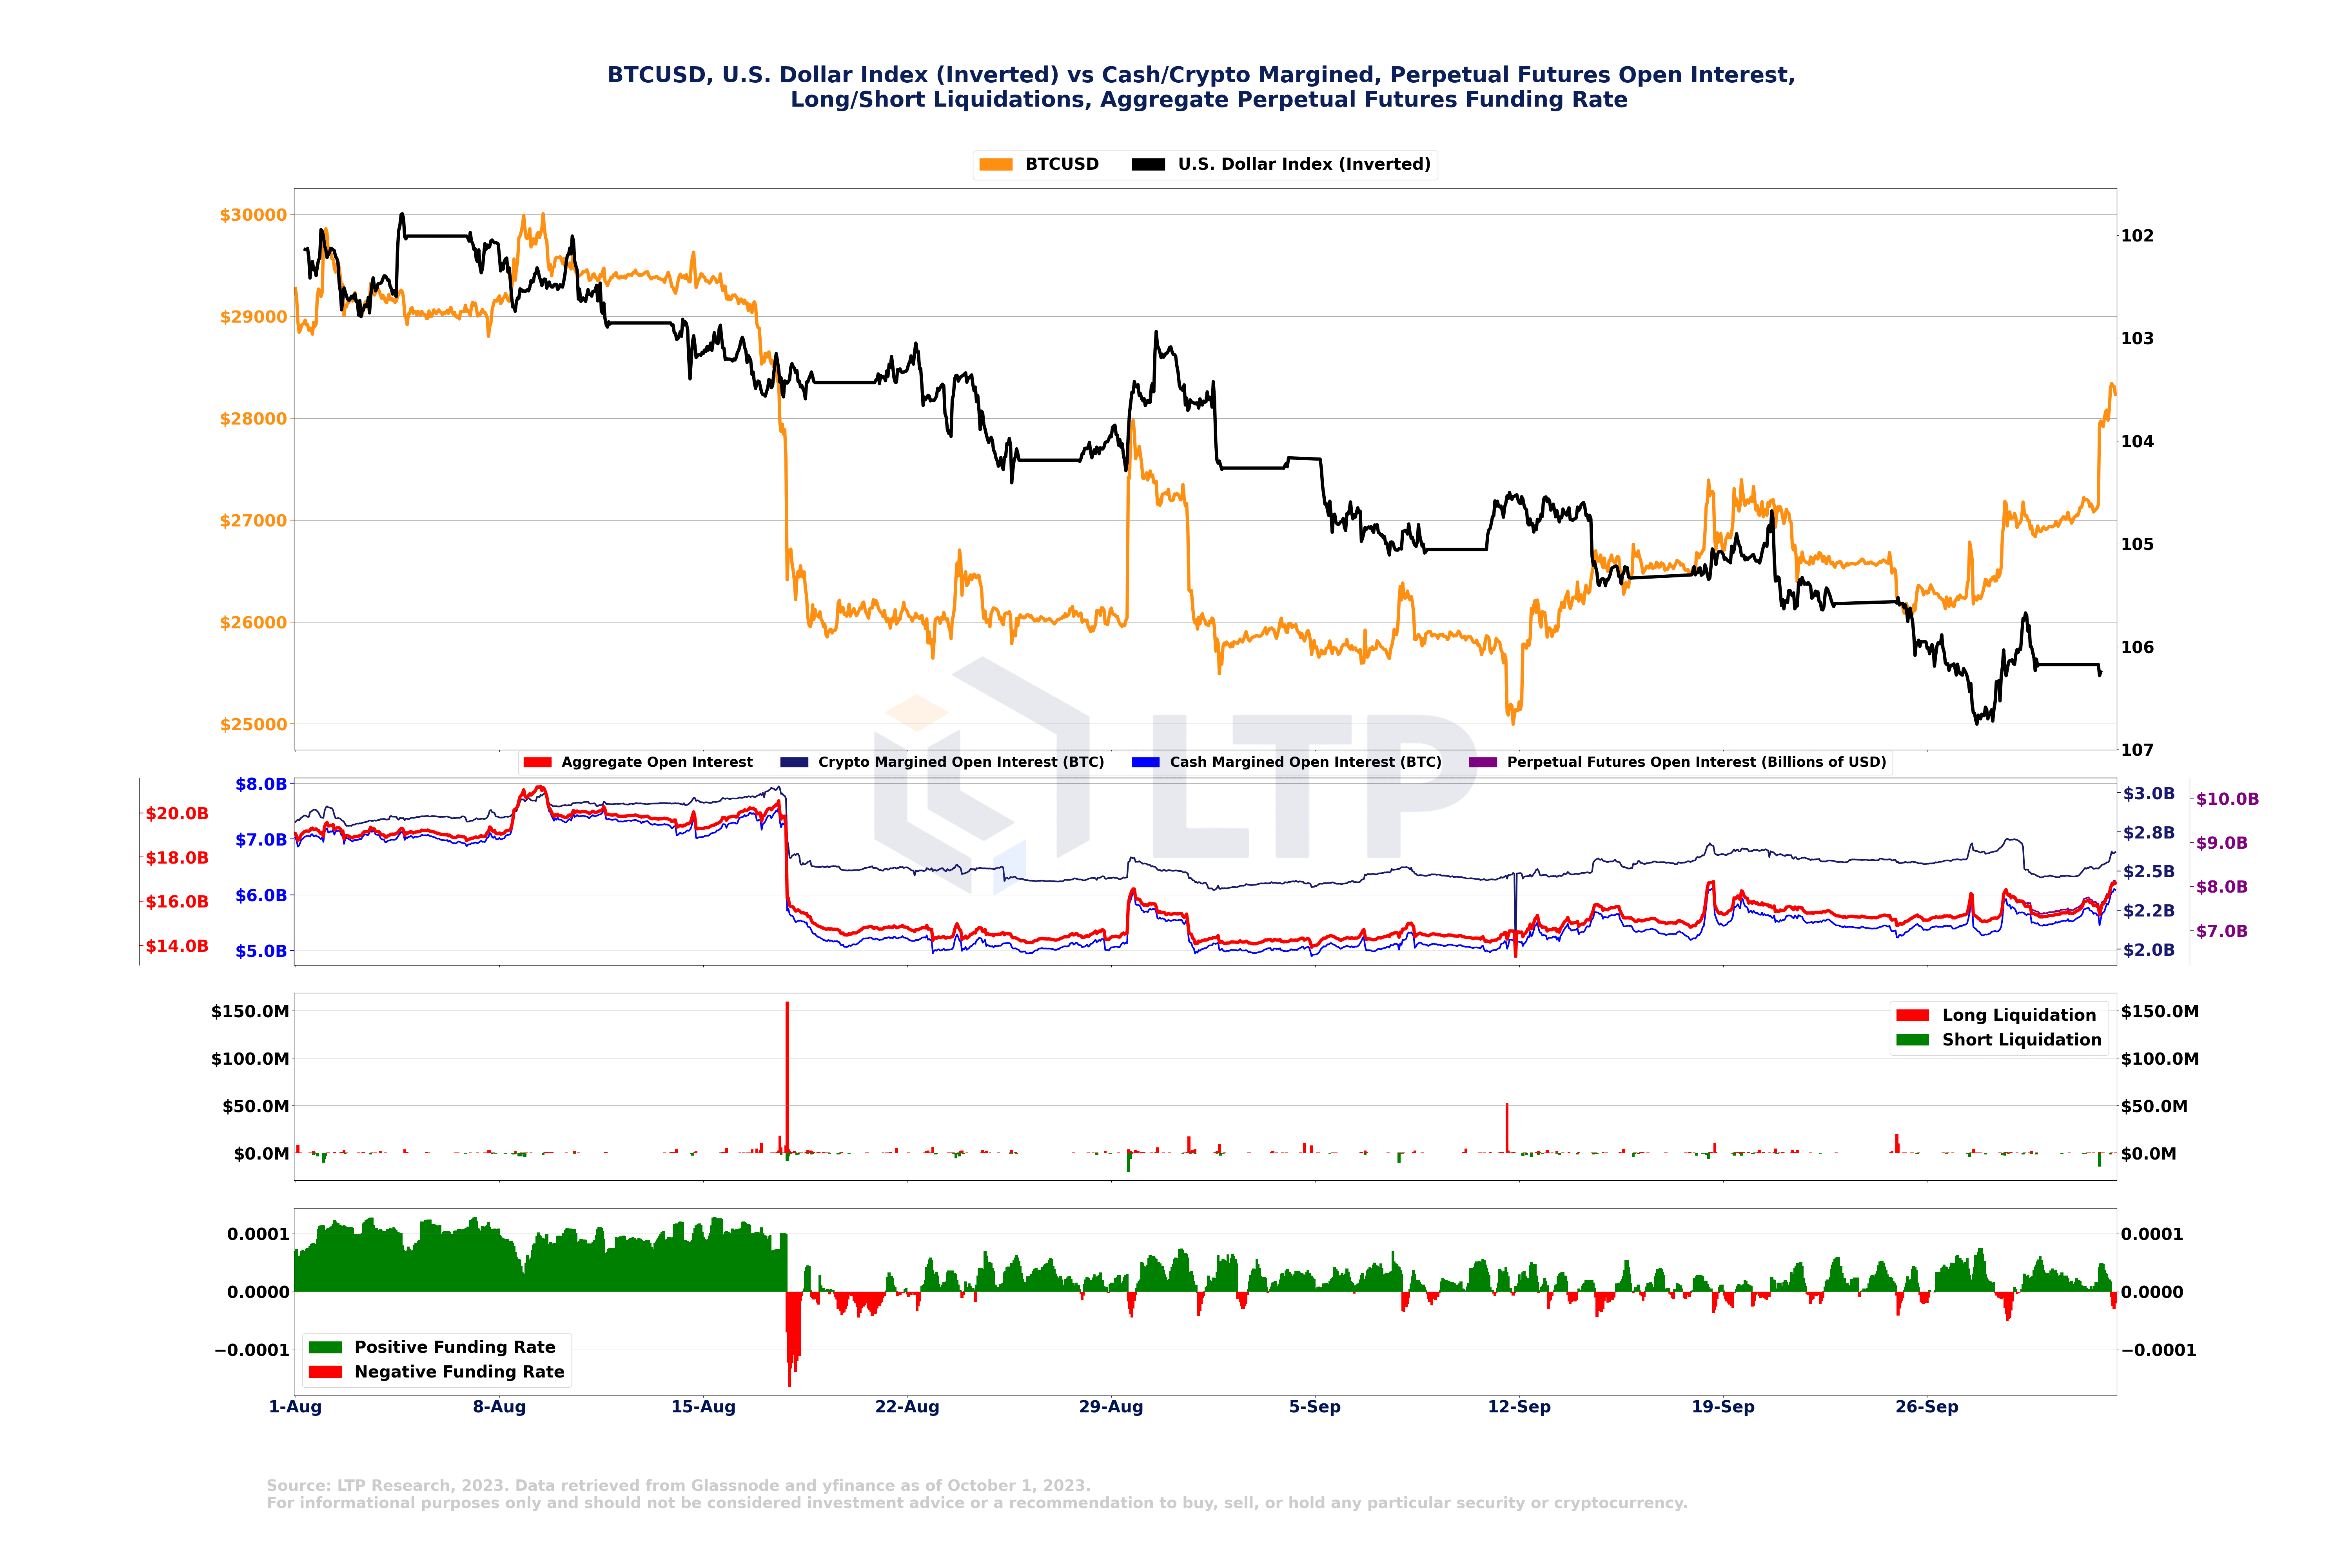
After the last liquidation event on August 16, 2023, Bitcoin’s total open interest continues to remain depressed, remaining at around $16 billion. Additionally, there was a liquidation event on September 11 that wiped out $400 million worth of marginal open interest in cryptocurrencies. In 2.16 we will look at this hunt for stops.
2.15 Bitcoin Perpetual Futures Liquidation Visualization August 29
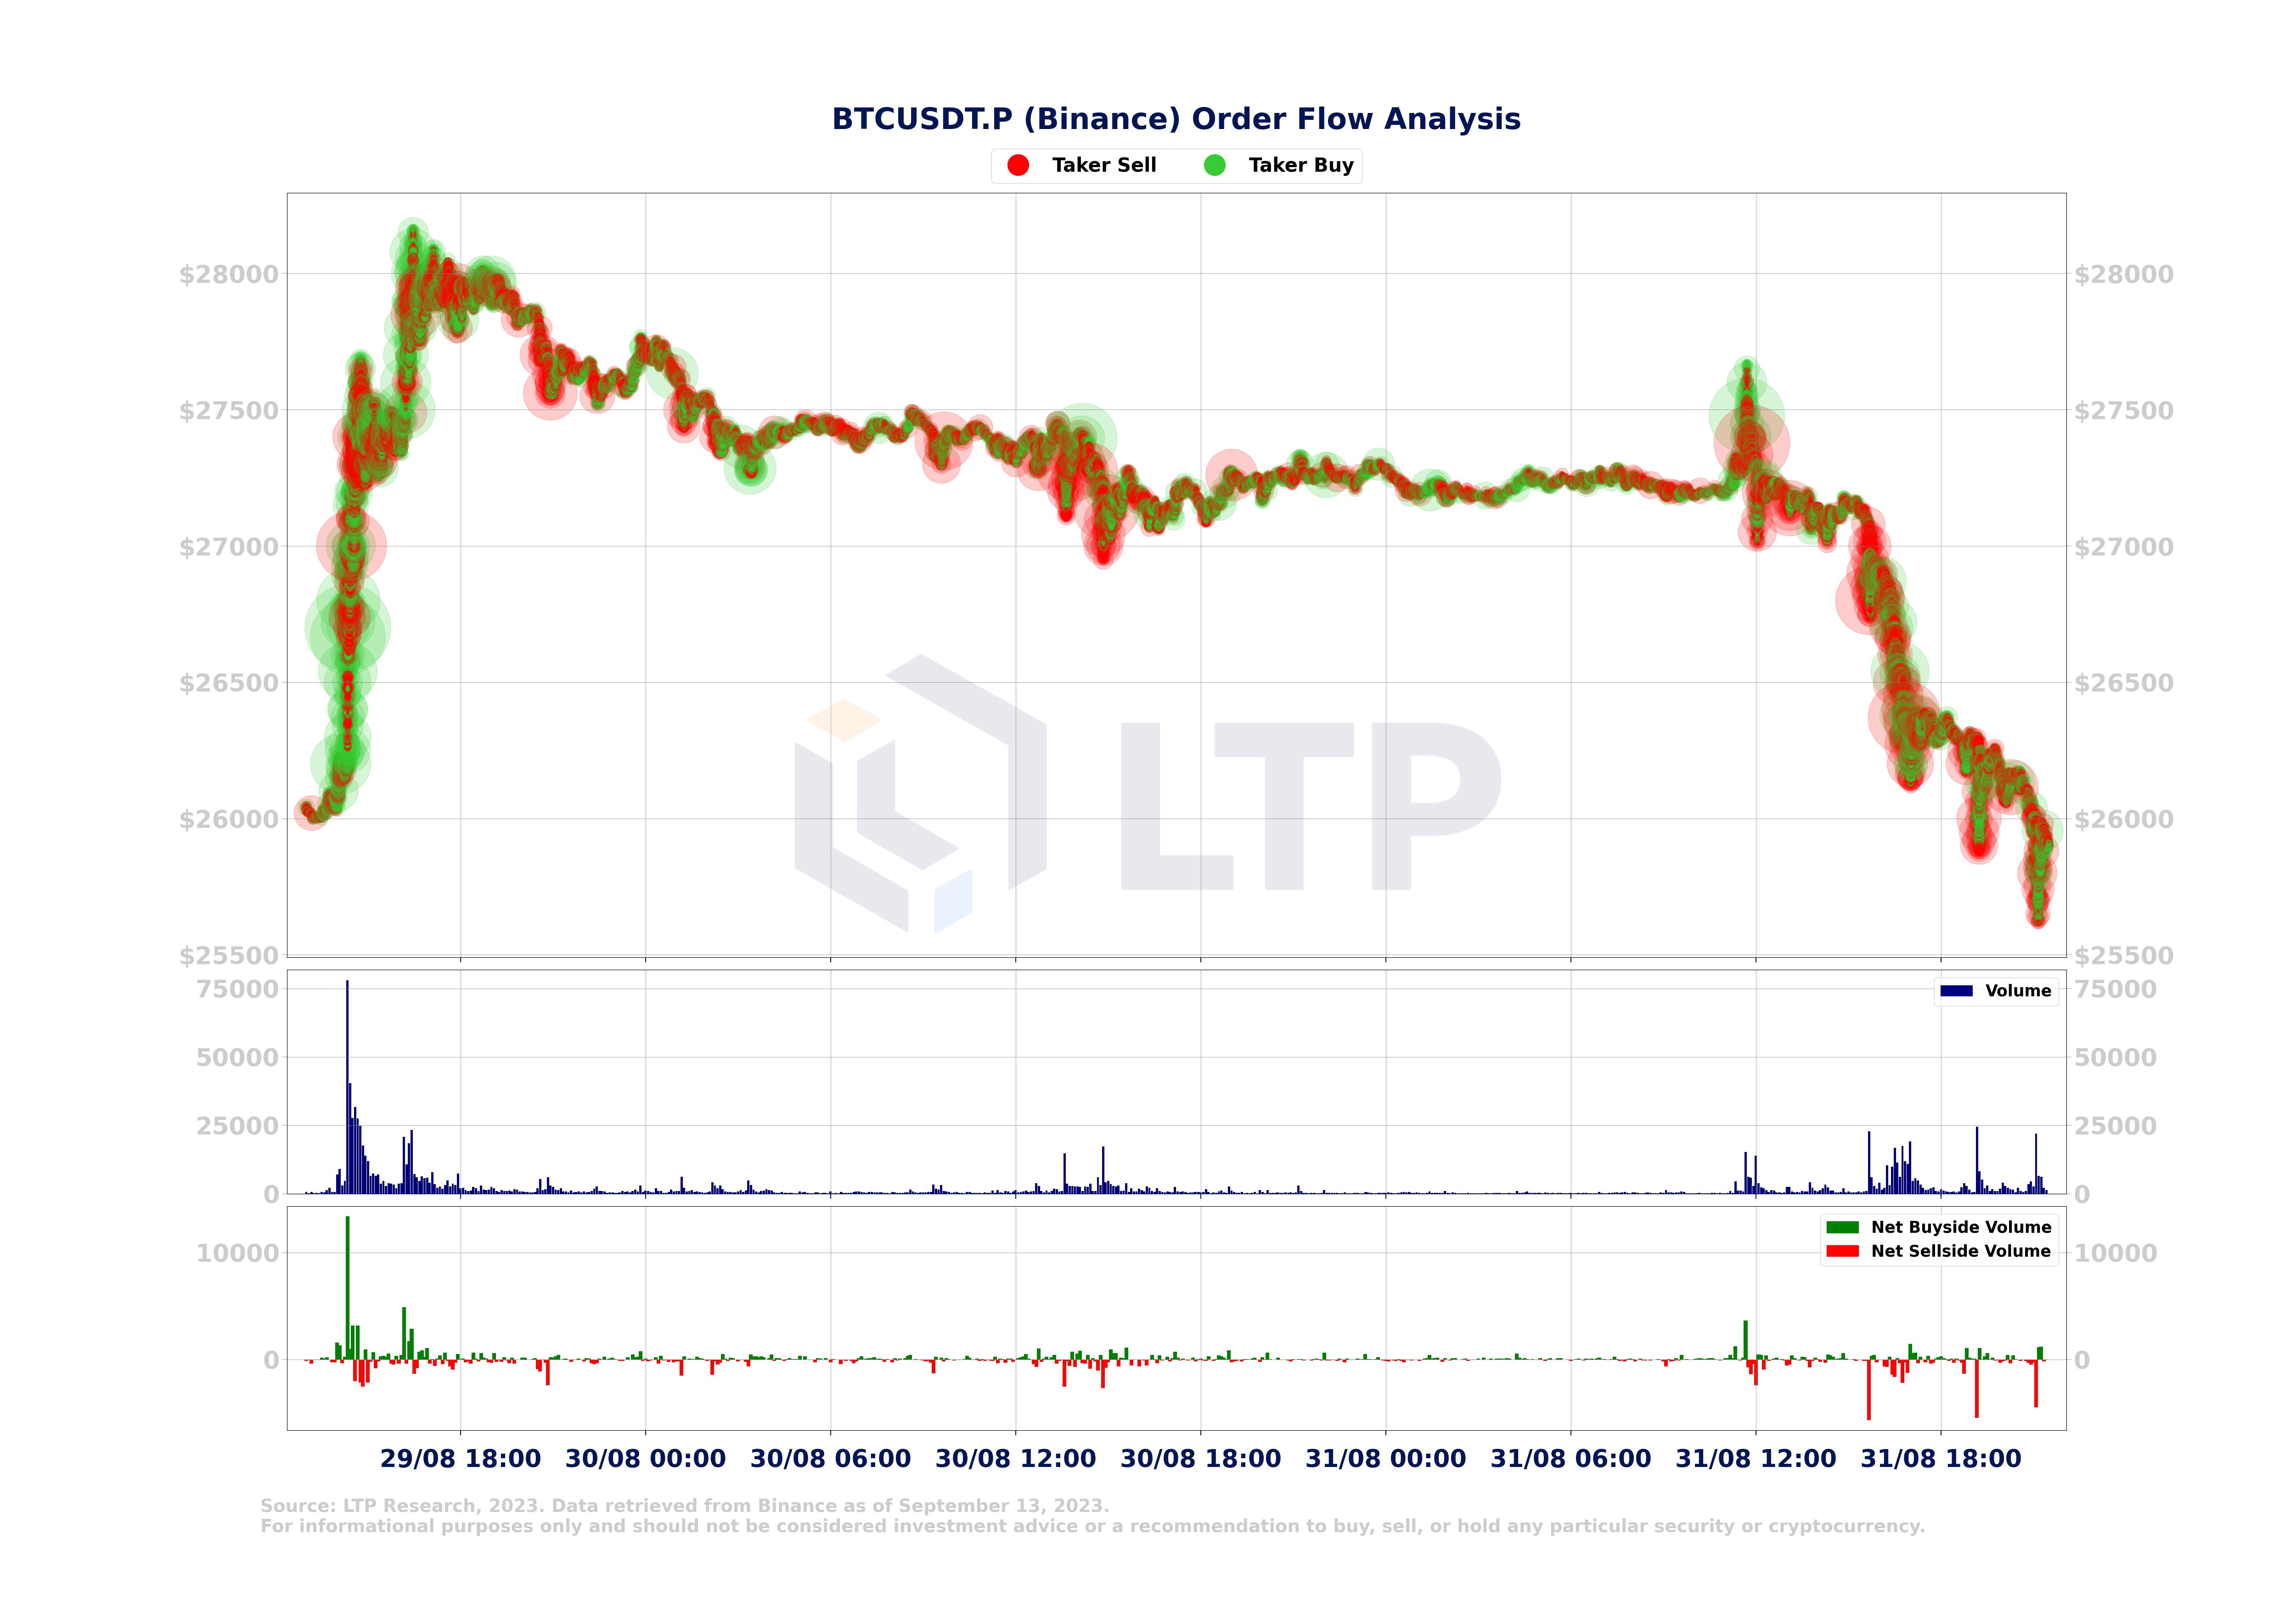
On August 29, Bitcoin's price suddenly surged as traders chased the upward move, causing total open interest to increase by $2 billion. However, the price surge did not last, as evidenced by the lack of trading volume that followed. This was followed by a sell-off on August 31, 2023, which triggered a cascade of liquidations. Outside of the liquidations, trading activity and volume remained sluggish.
2.16 Bitcoin Perpetual Futures Liquidation Visualization September 11
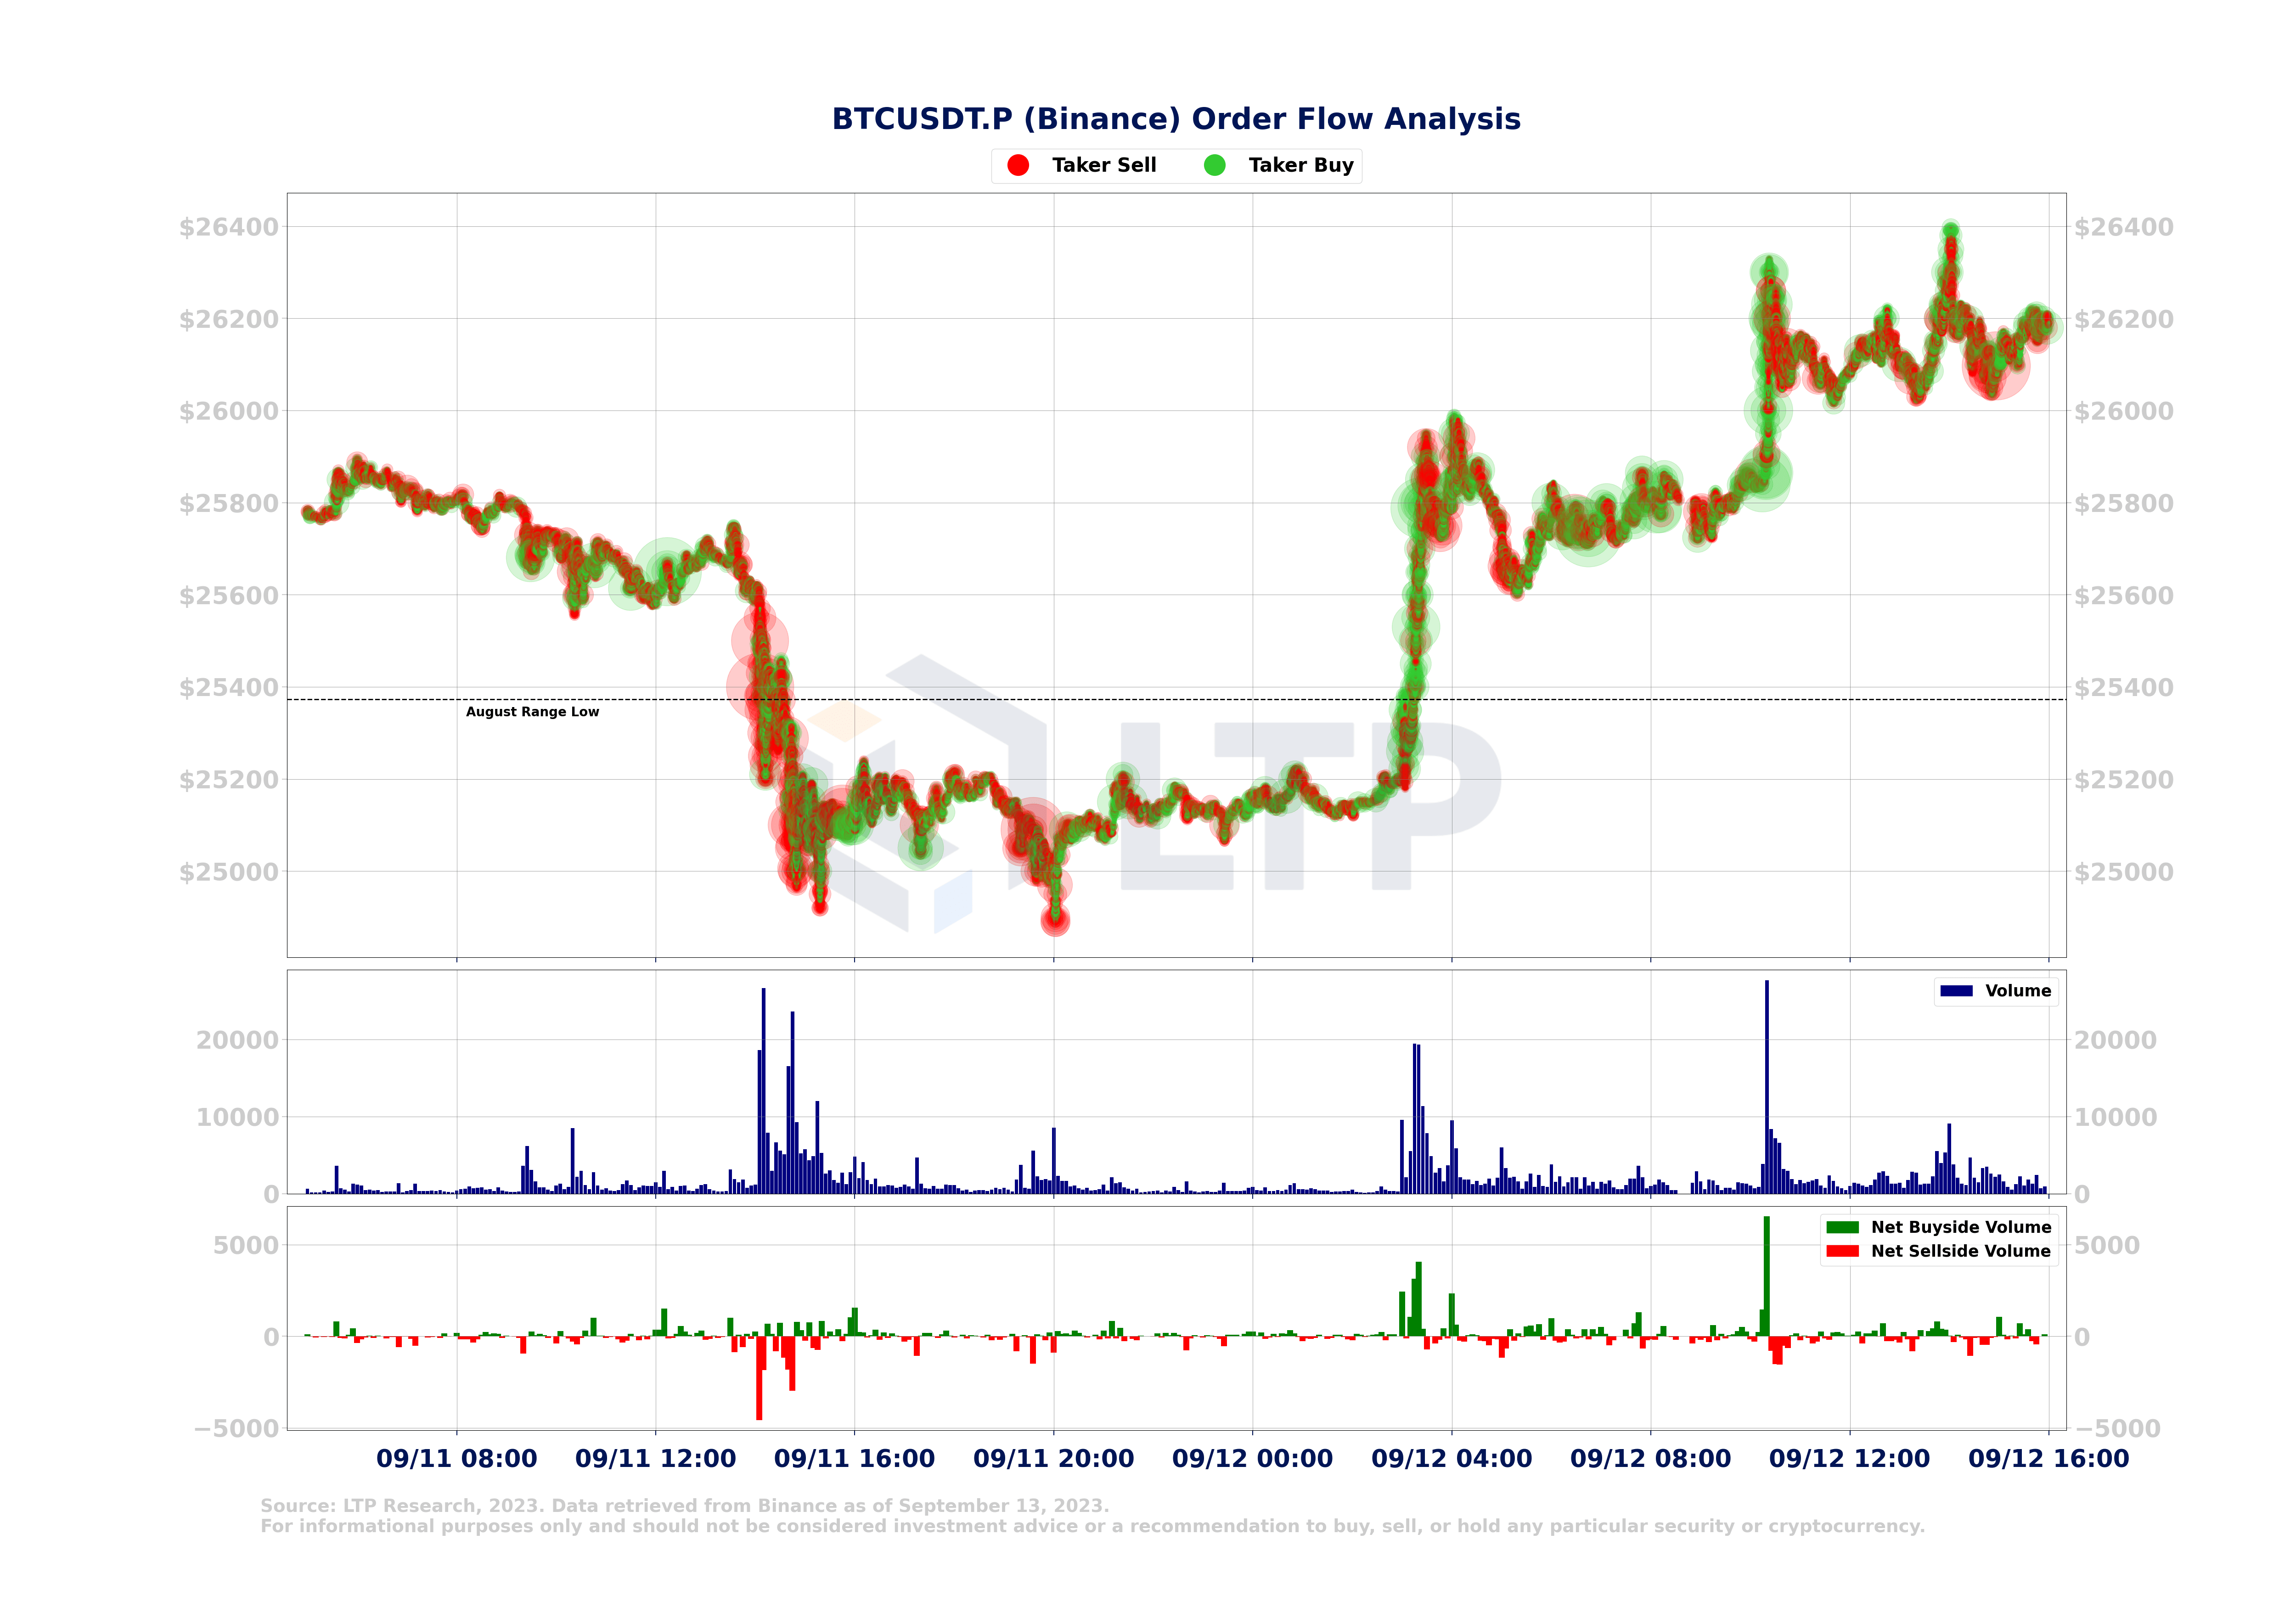
On September 11, 2023, a specific stop hunting occurred, resulting in $400 million worth of cryptocurrency margin open interest being wiped out. The chart shows that a series of Taker Sell orders pushed the price below the range low throughout August, where the vast majority of stop orders were likely located. The next day, after the price fell below the August range low, aggressive Taker Buy orders entered the market and pushed the price above $25,800. This triggered a short-lived recovery (short position closing) later.
2.17 BTCFDUSD trading volume increased, trading price higher than BTCUSDT (premium)
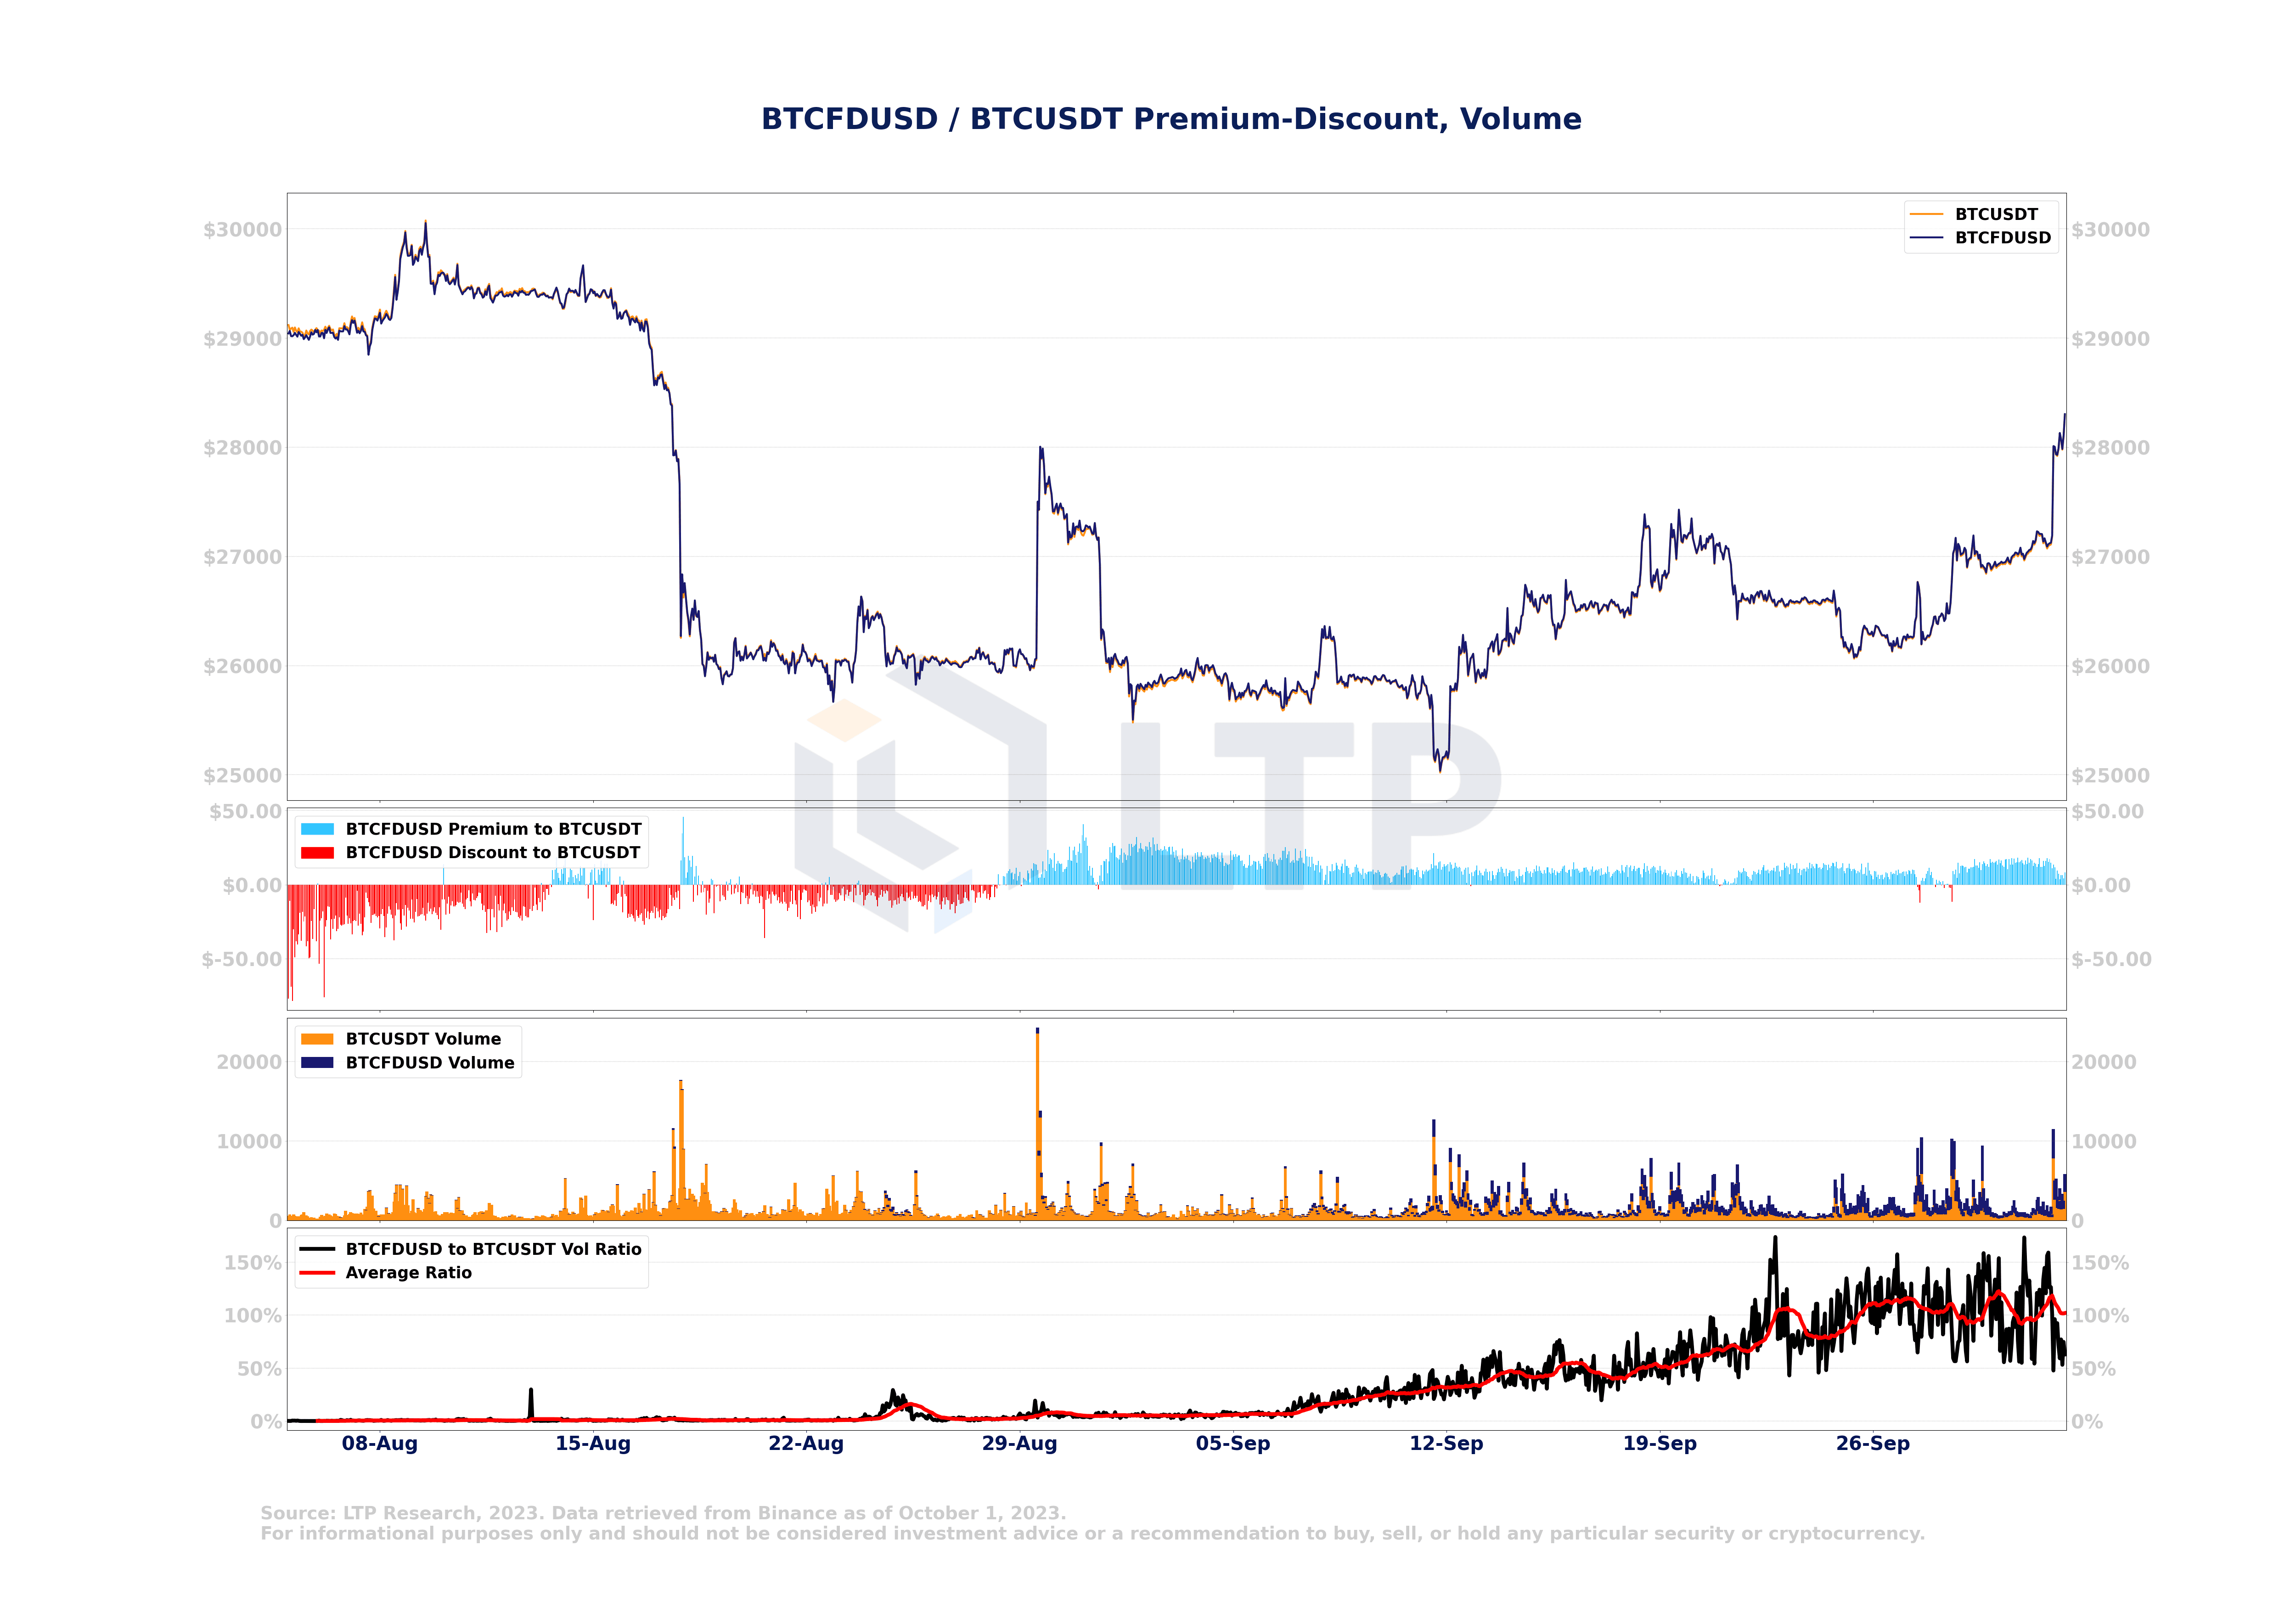
Binance launched FDUSD on August 4, offering 0% Maker and Taker fees. BTCFDUSD's trading volume began to increase from September 5. As trading volume increased on September 5, BTCFDUSD began to trade at a higher price than BTCUSDT. Currently, BTCFDUSD accounts for half of Binance's Bitcoin spot market trading volume.
2.18 Despite a significant decrease in BTCTUSD trading volume, BTCTUSD still maintains a premium
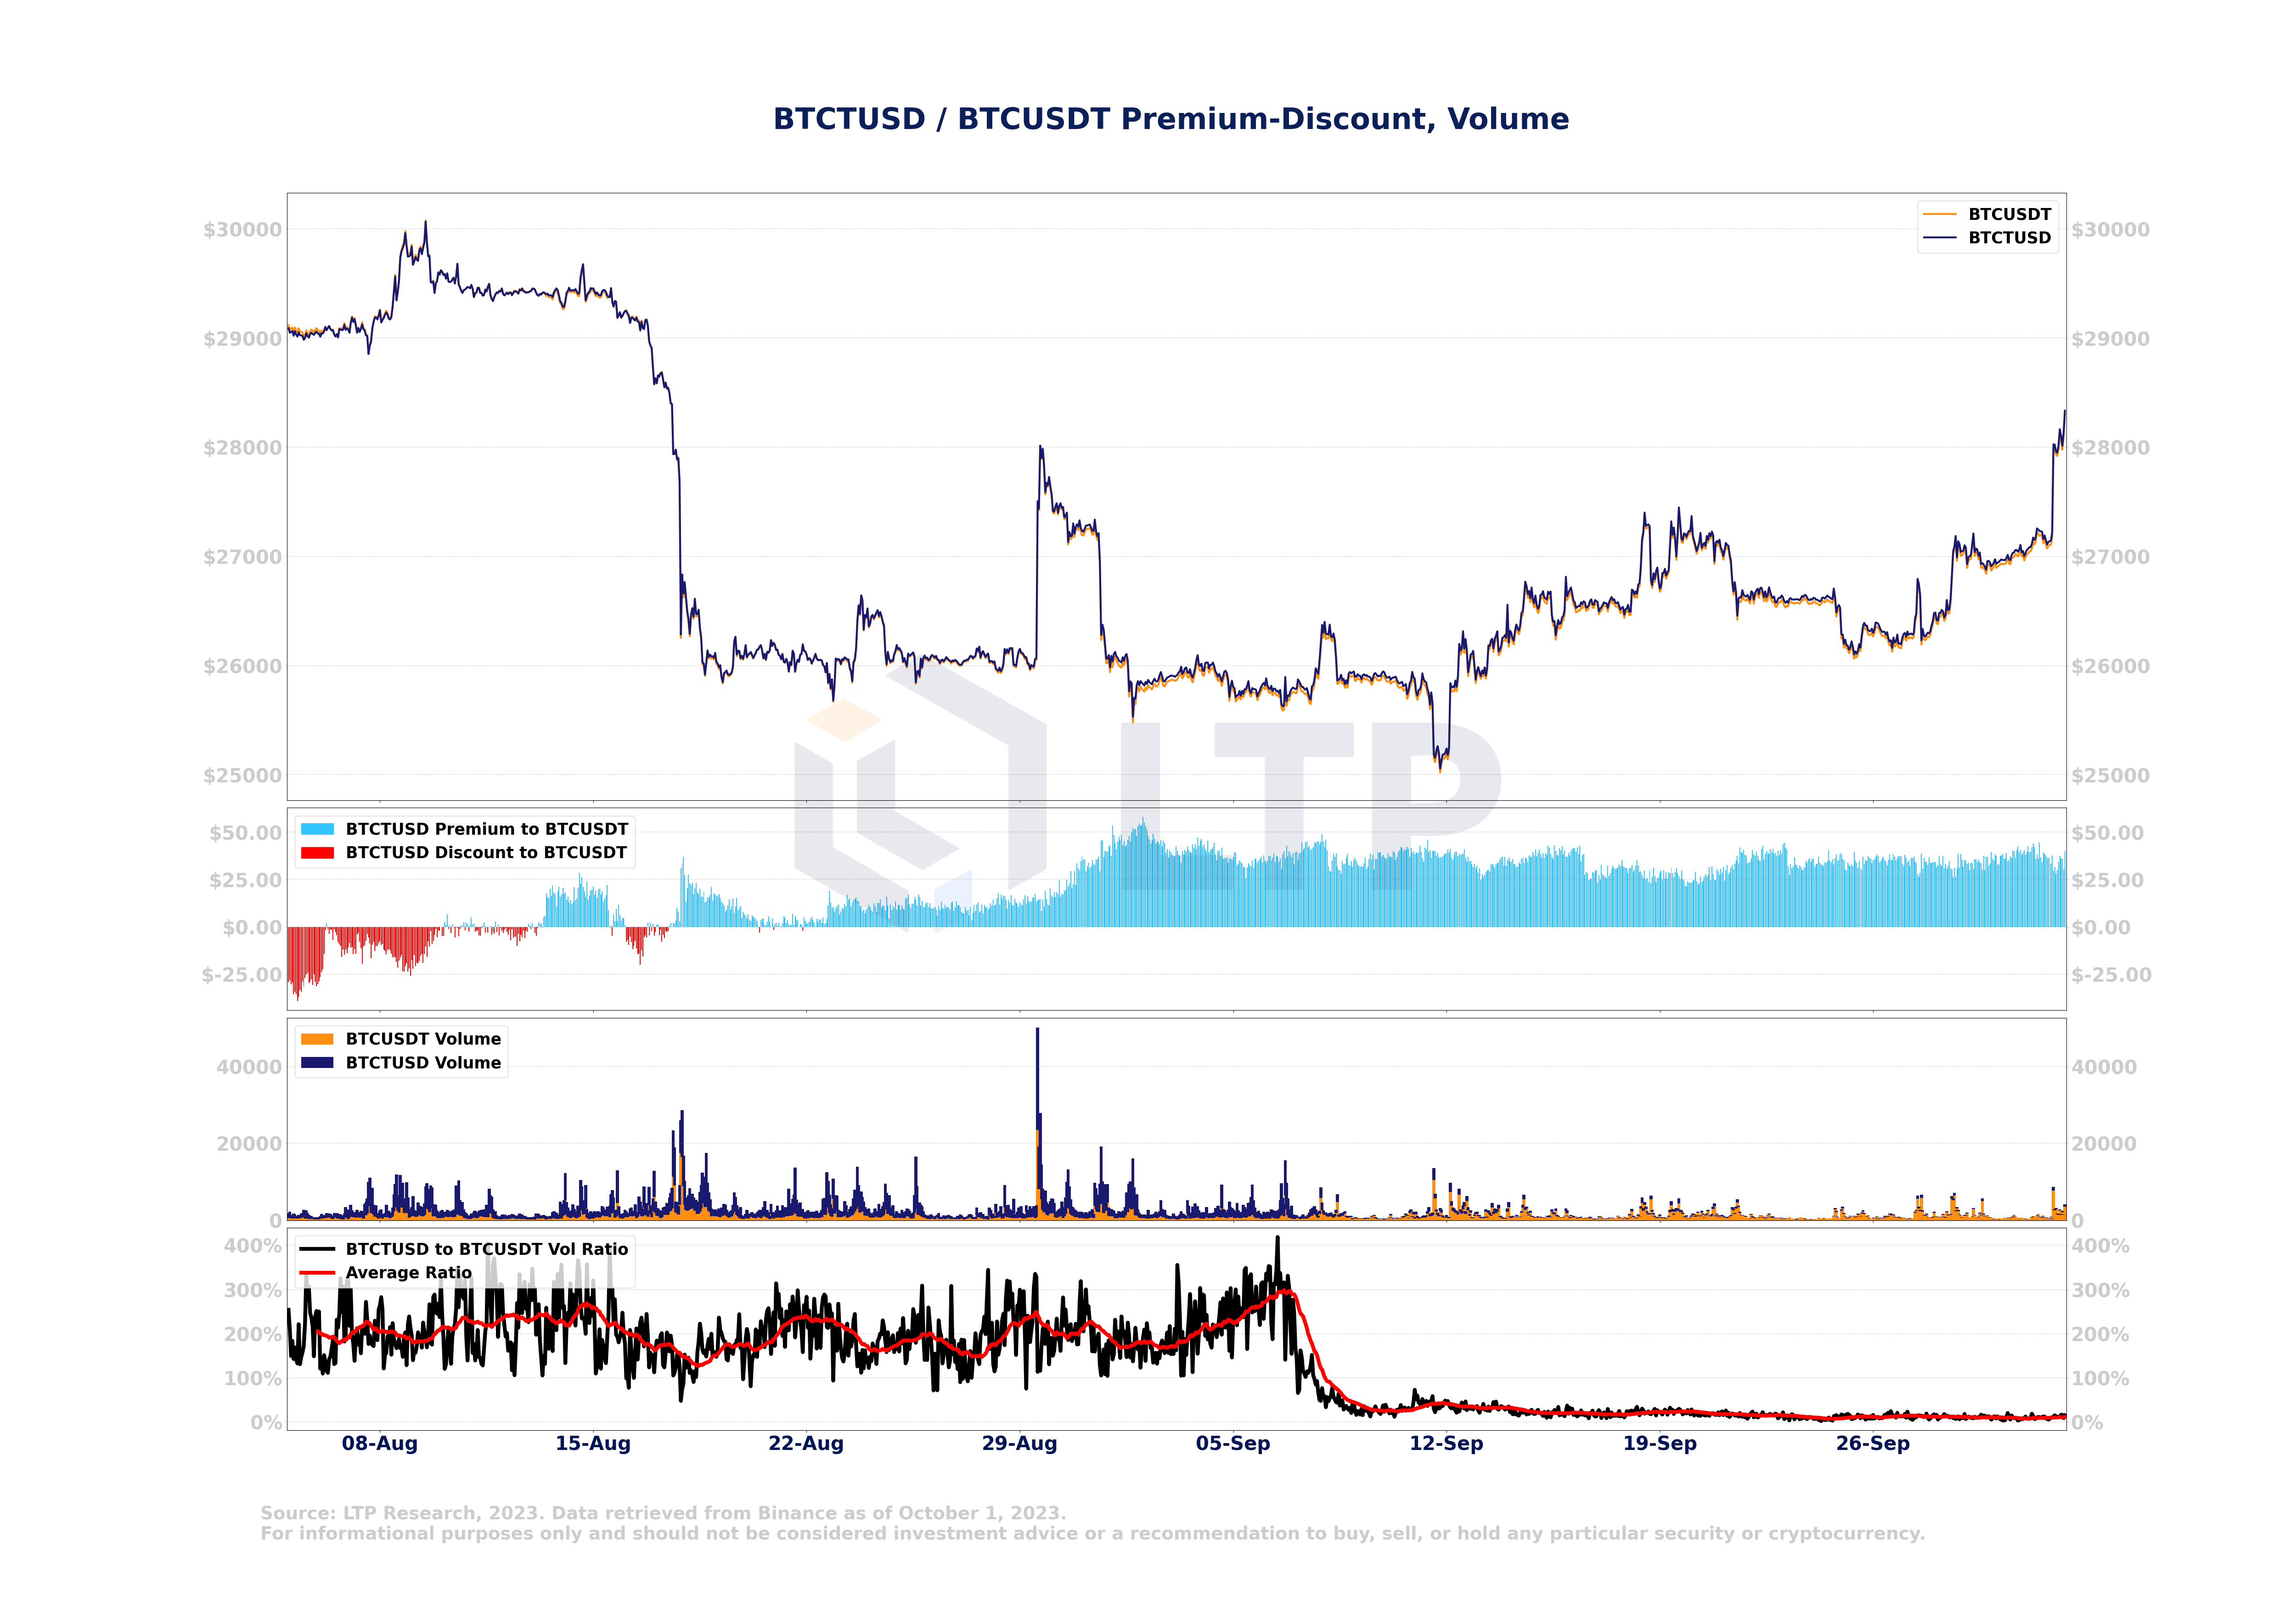
Starting from September 5th, the trading volume of BTCTUSD has dropped significantly, but it is worth noting that despite the drop in trading volume, it is still trading at a higher price than BTCUSDT.
2.19 Despite the shift in trading volume from BTCTUSD to BTCFDUSD, BTCTUSD remains at a premium
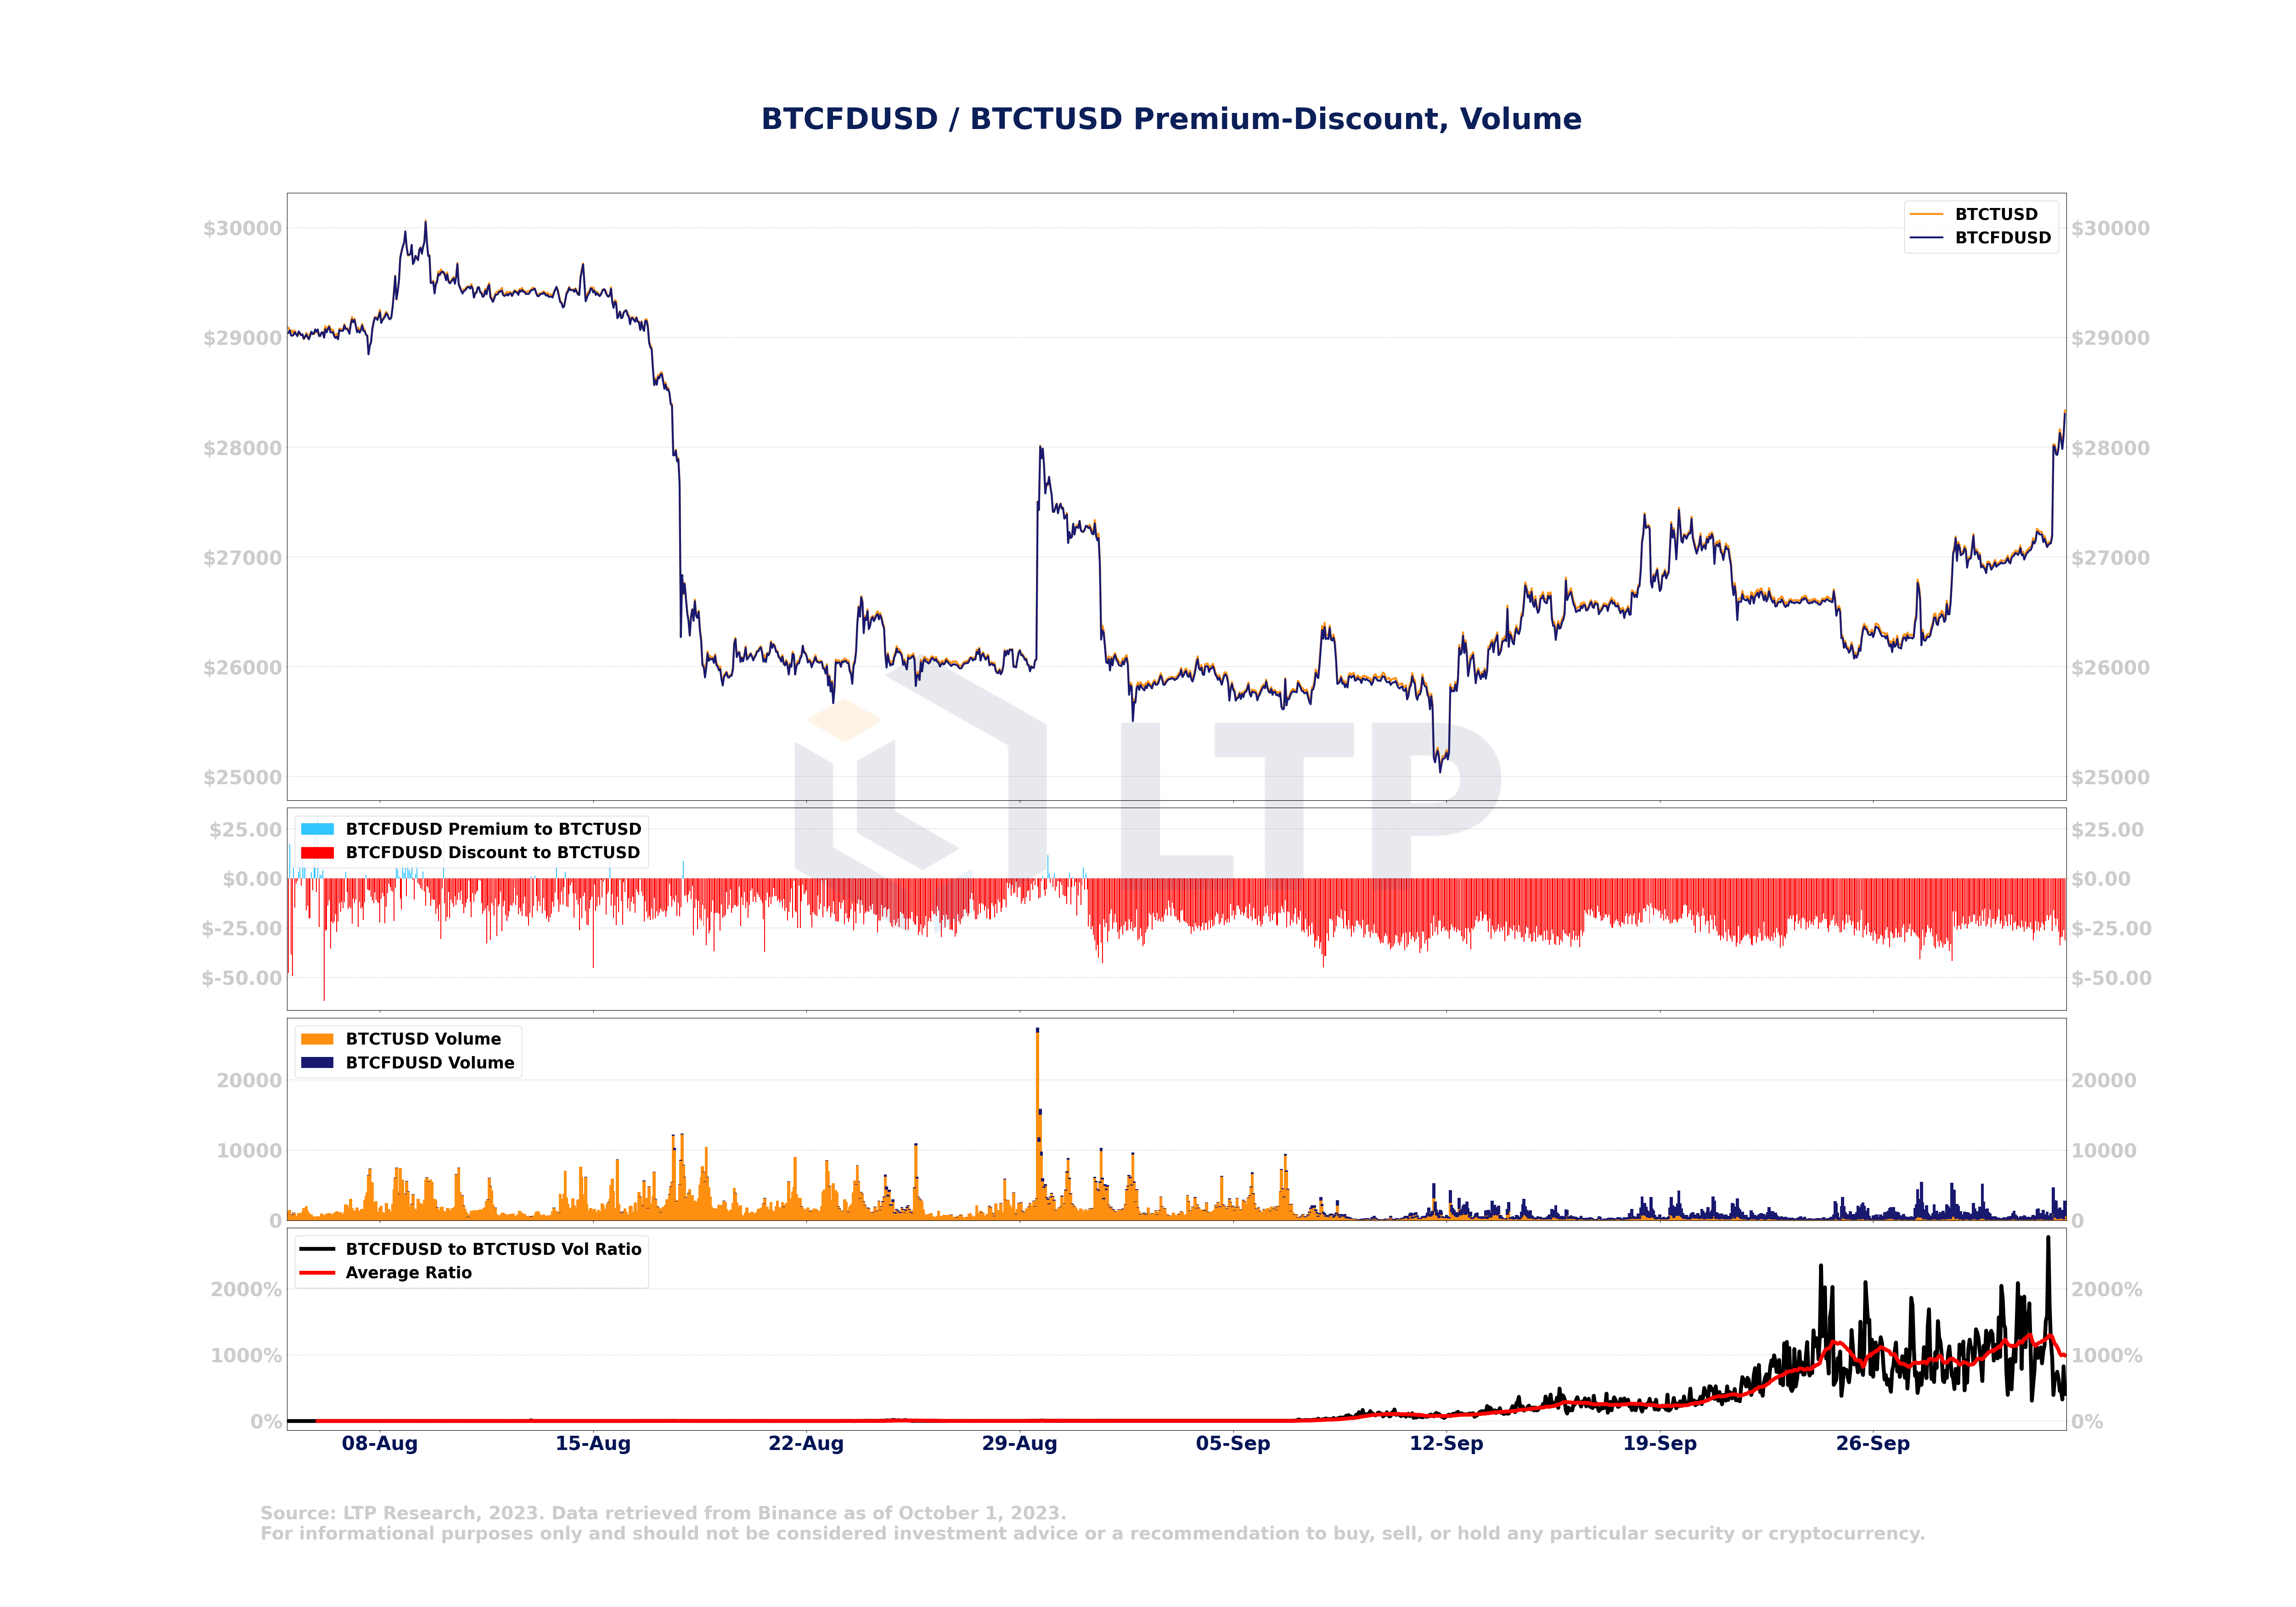
Starting from September 5, the trading volume of BTCFDUSD began to climb, while the trading volume of BTCTUSD fell at the same time. This shows that trading activity has clearly shifted towards the BTCFDUSD trading pair. Despite this shift, BTCTUSD is still trading at a higher price than BTCFDUSD.
2.20 LINK performs well in L1
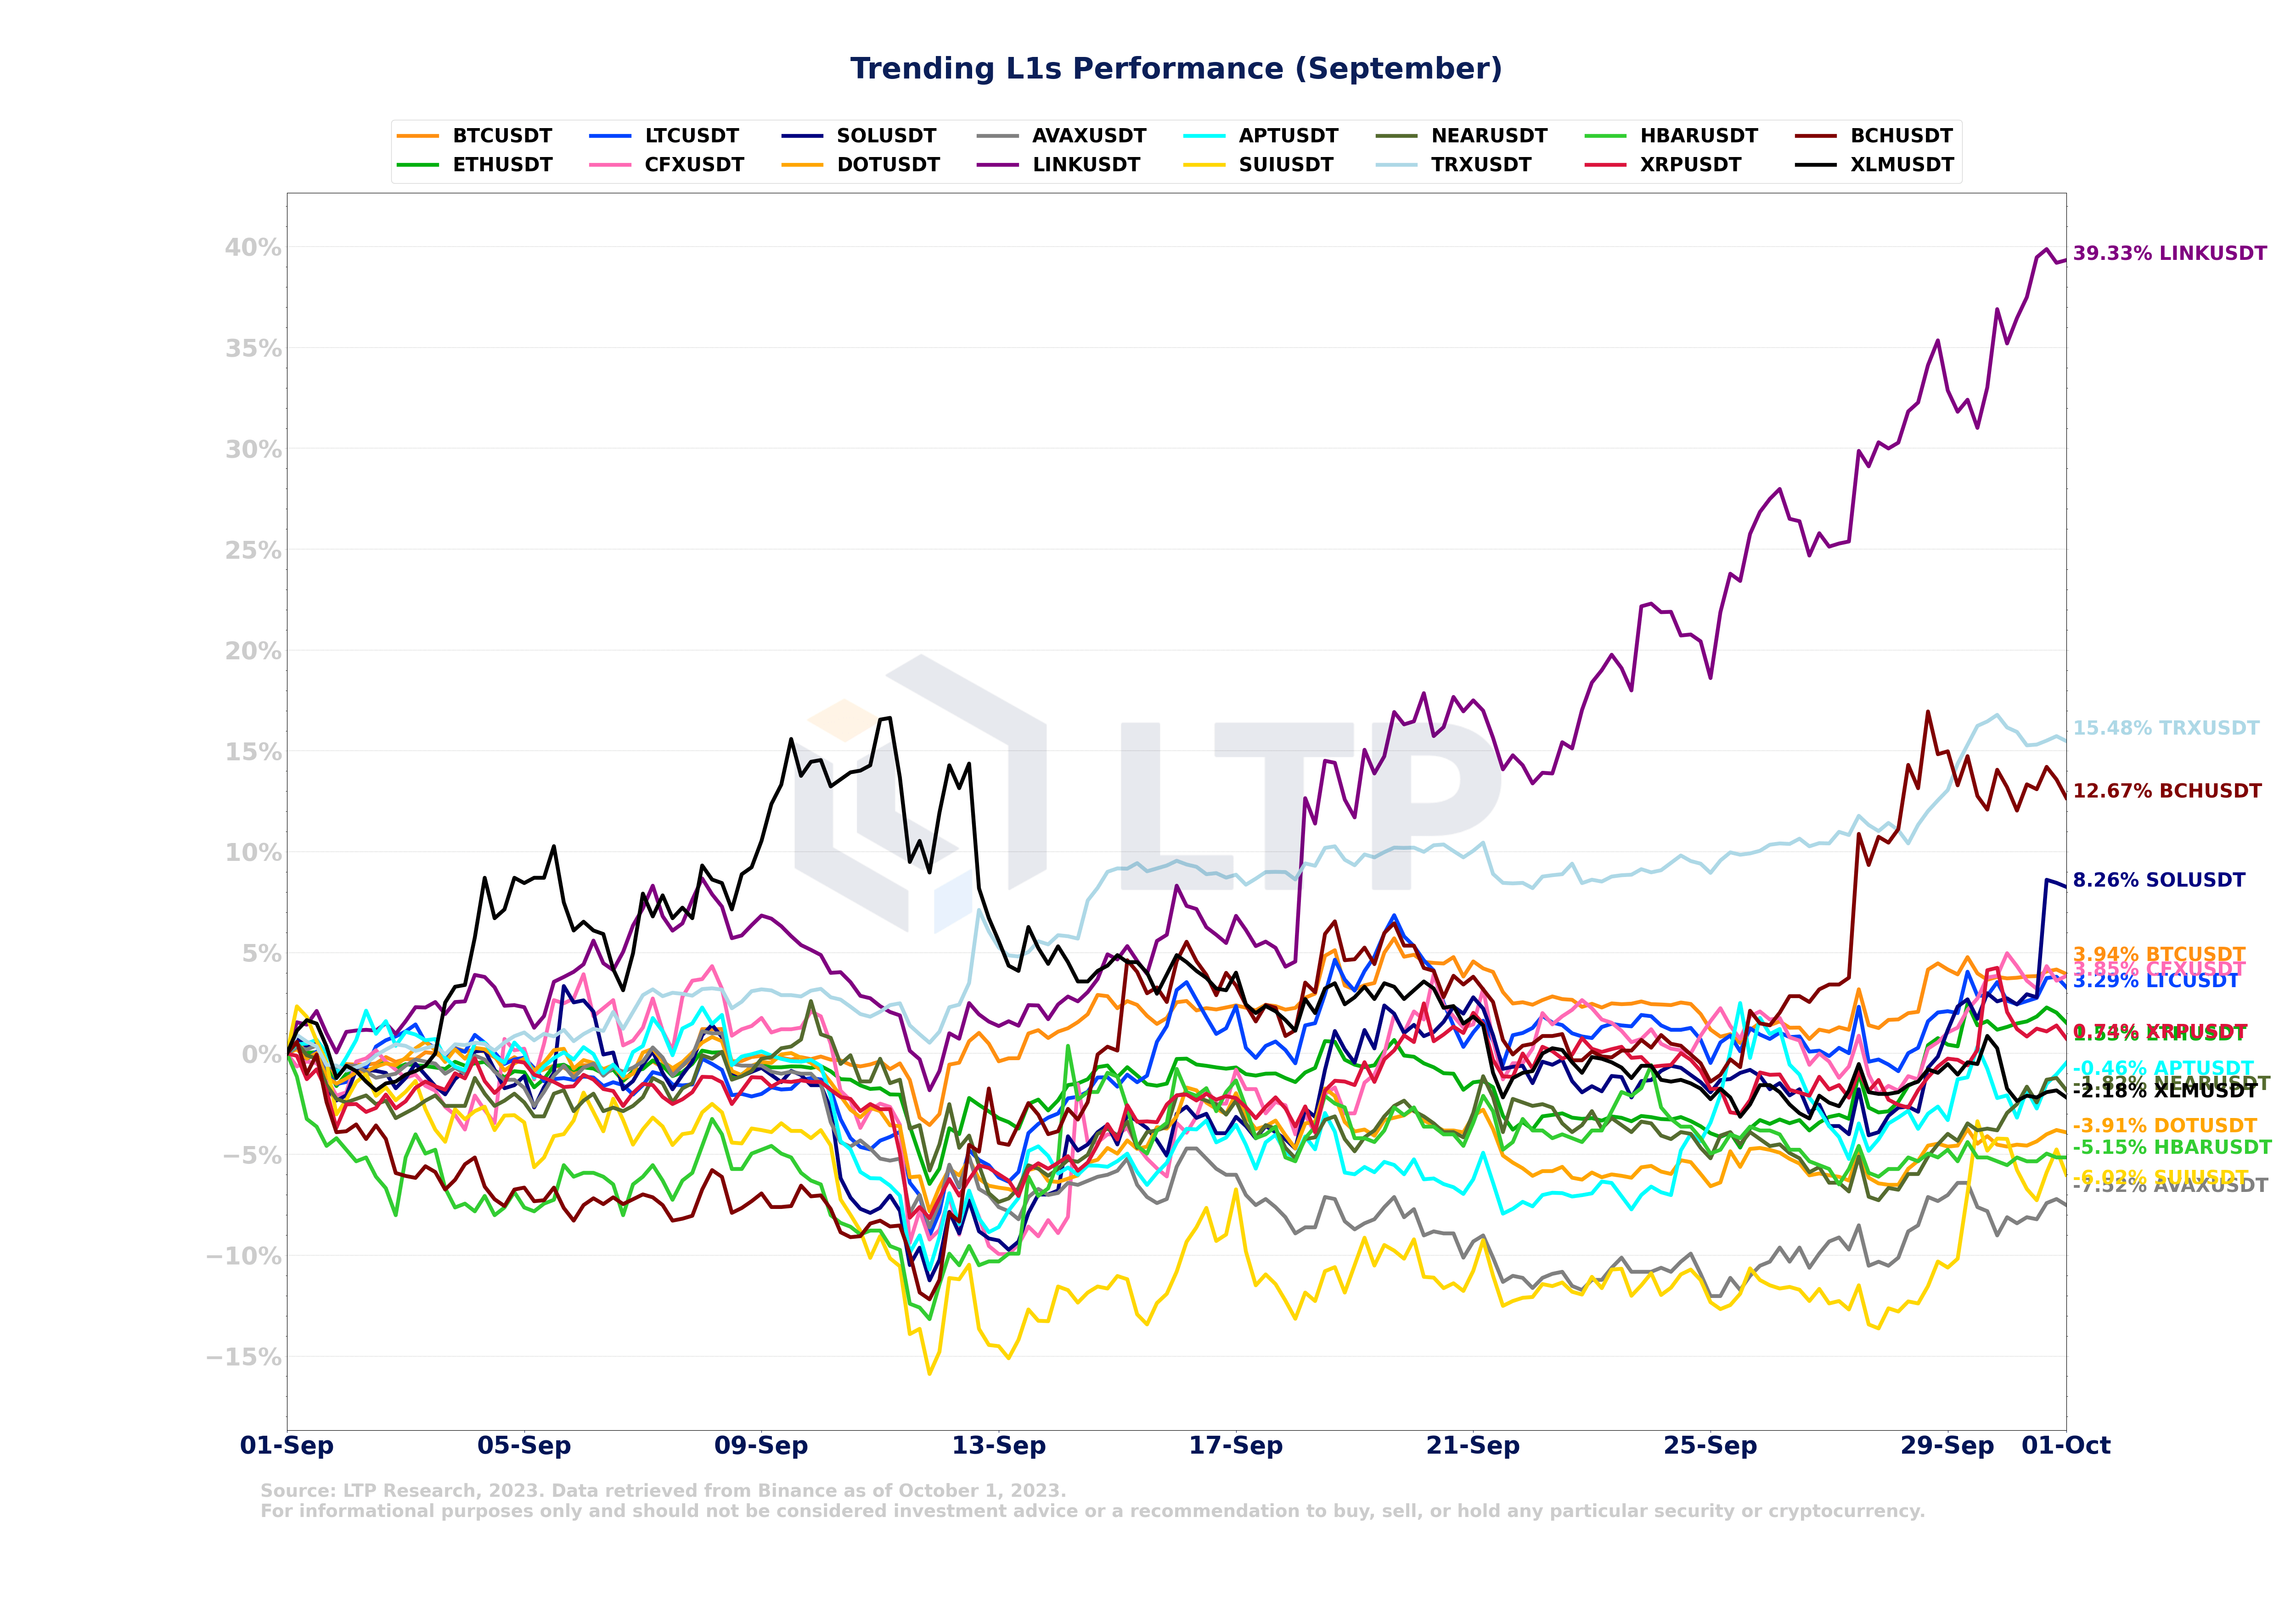
Among the first-layer cryptocurrencies, LINK performed the best, with a price increase of 40% throughout September. It was followed by TRX, with an increase of 15.5%, BCH, with an increase of 12.7%, and SOL, with an increase of 8.3%. During the same period, the price of Bitcoin also increased by 4%.
2.21 IMX performs well in L2
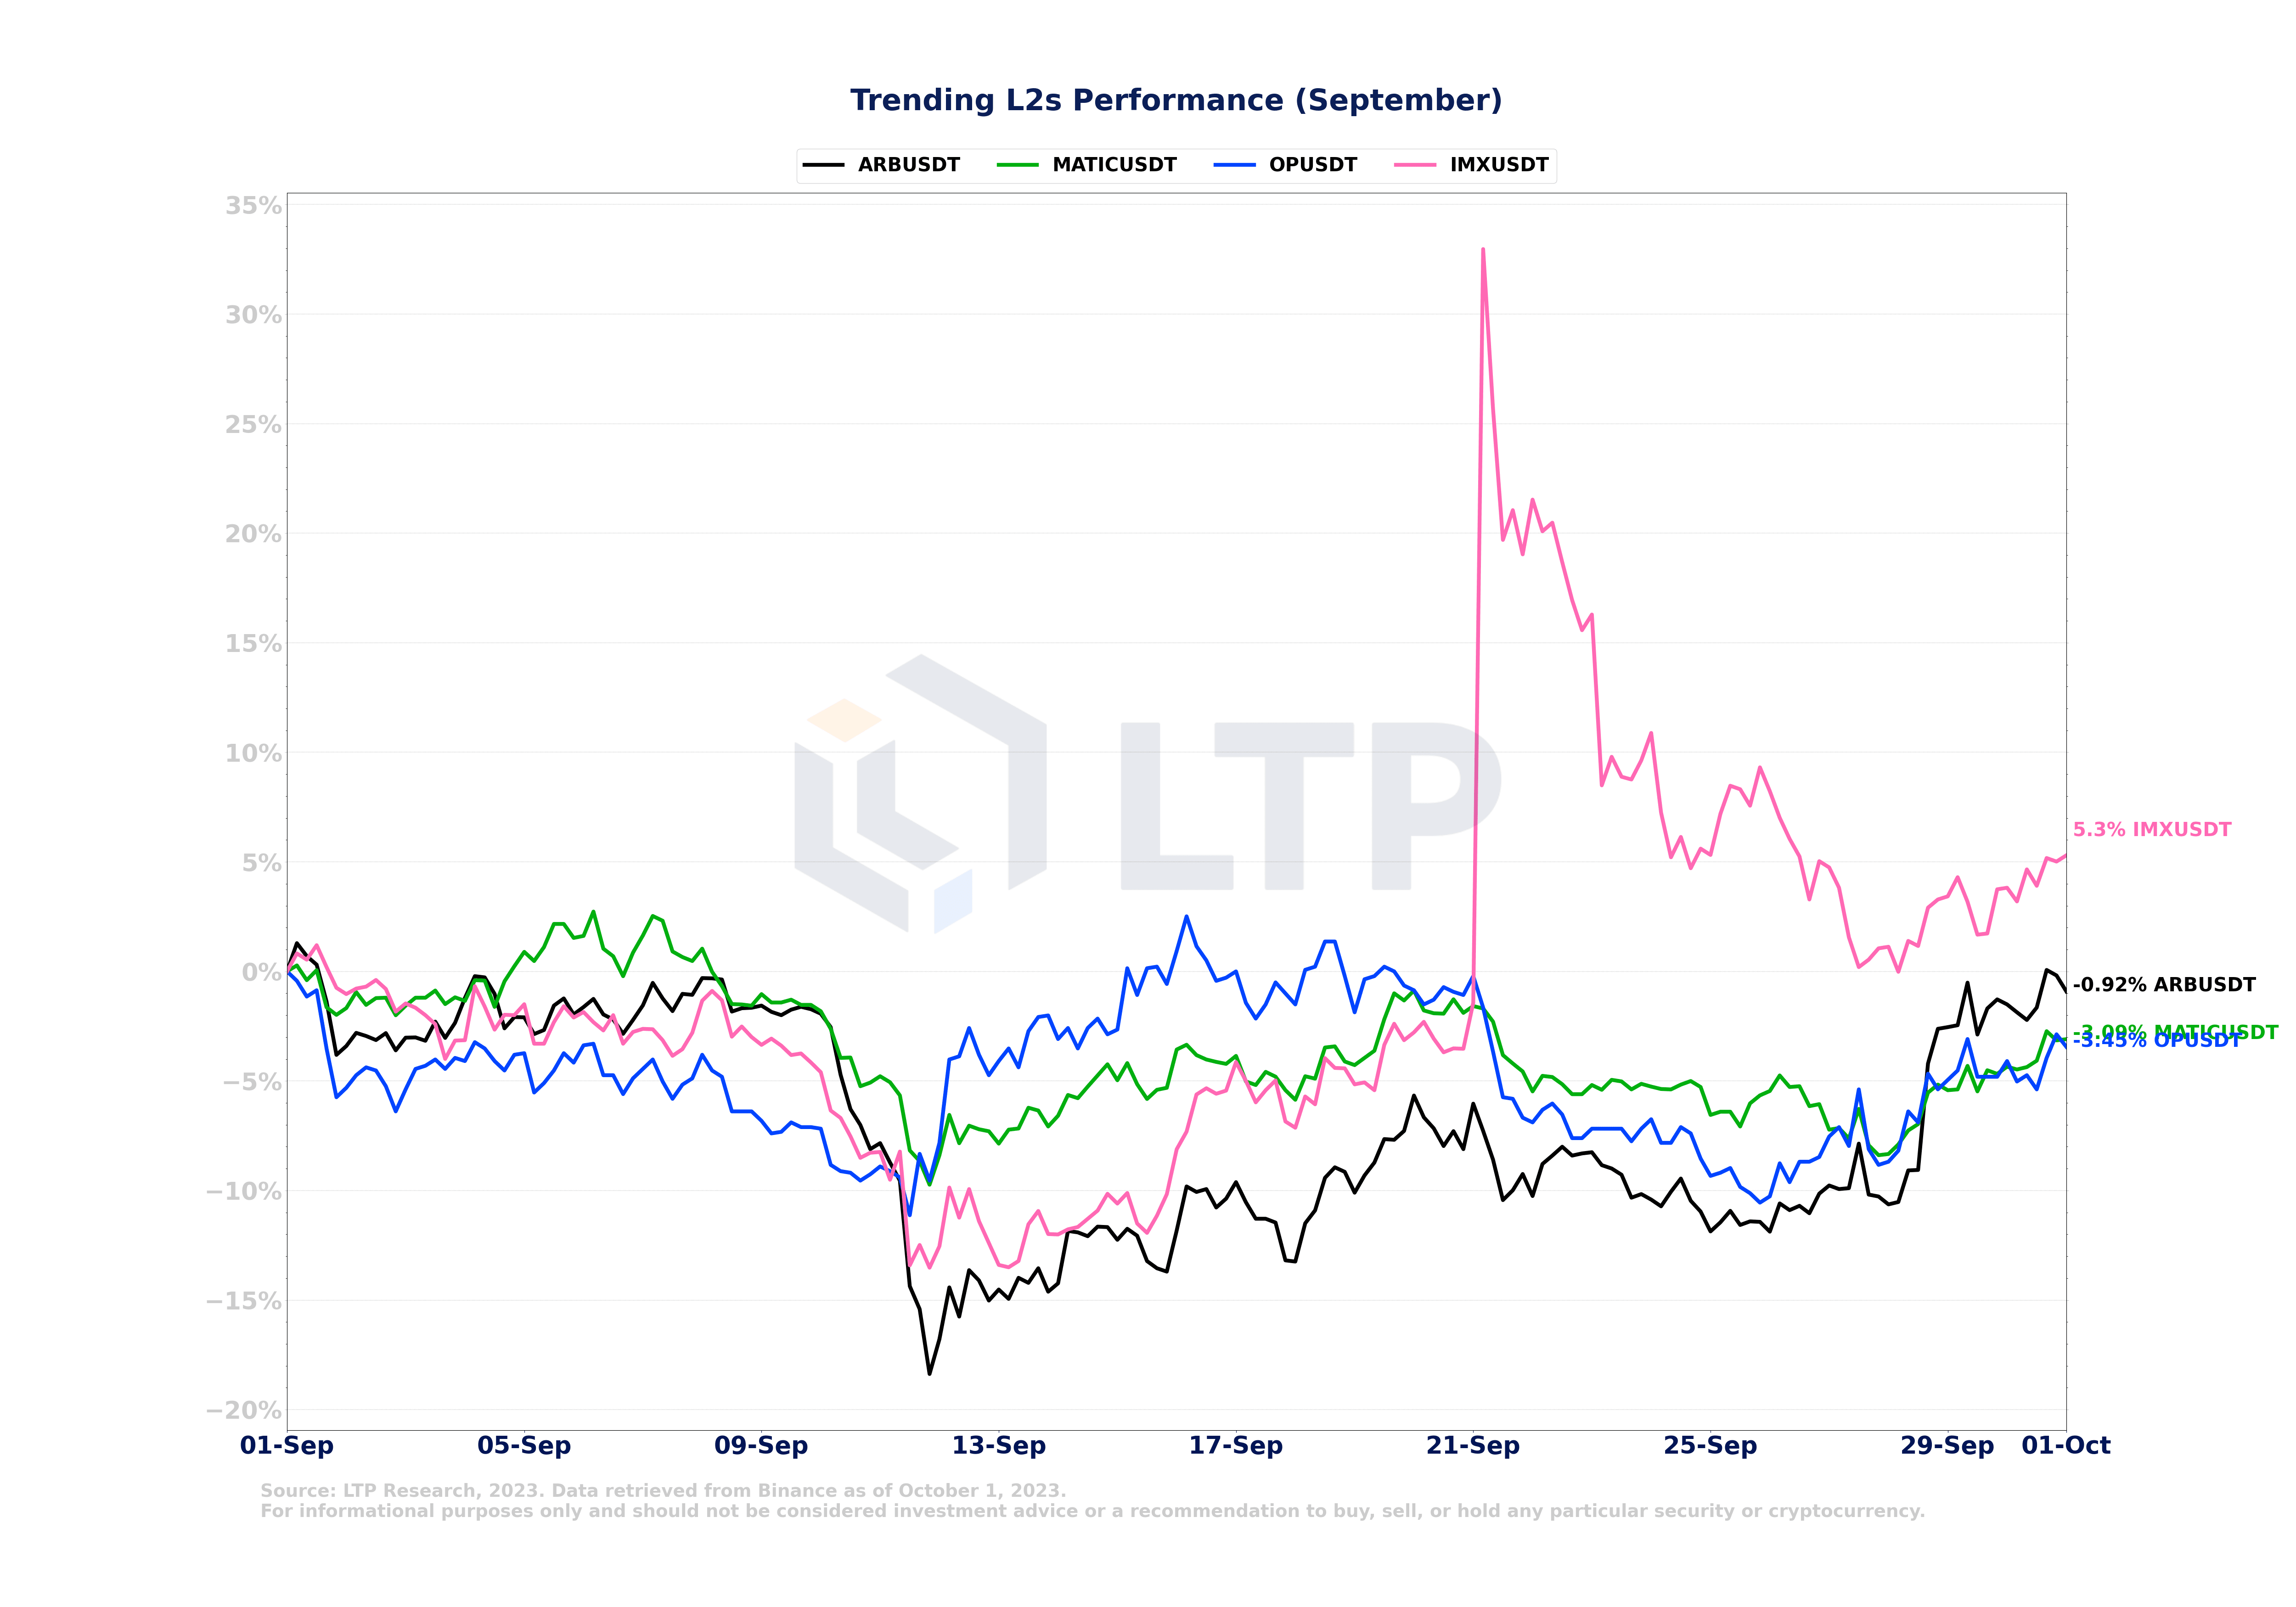
Among the second-tier cryptocurrencies, IMX had the highest return in September, up 5.3%. It was followed by ARB, up 0.9%. However, Matic and OP saw price declines, with Matic down 3% and OP down 3.45% during the same period.
2.22 Among DeFi tokens, MKR, RUNE and AAVE performed well
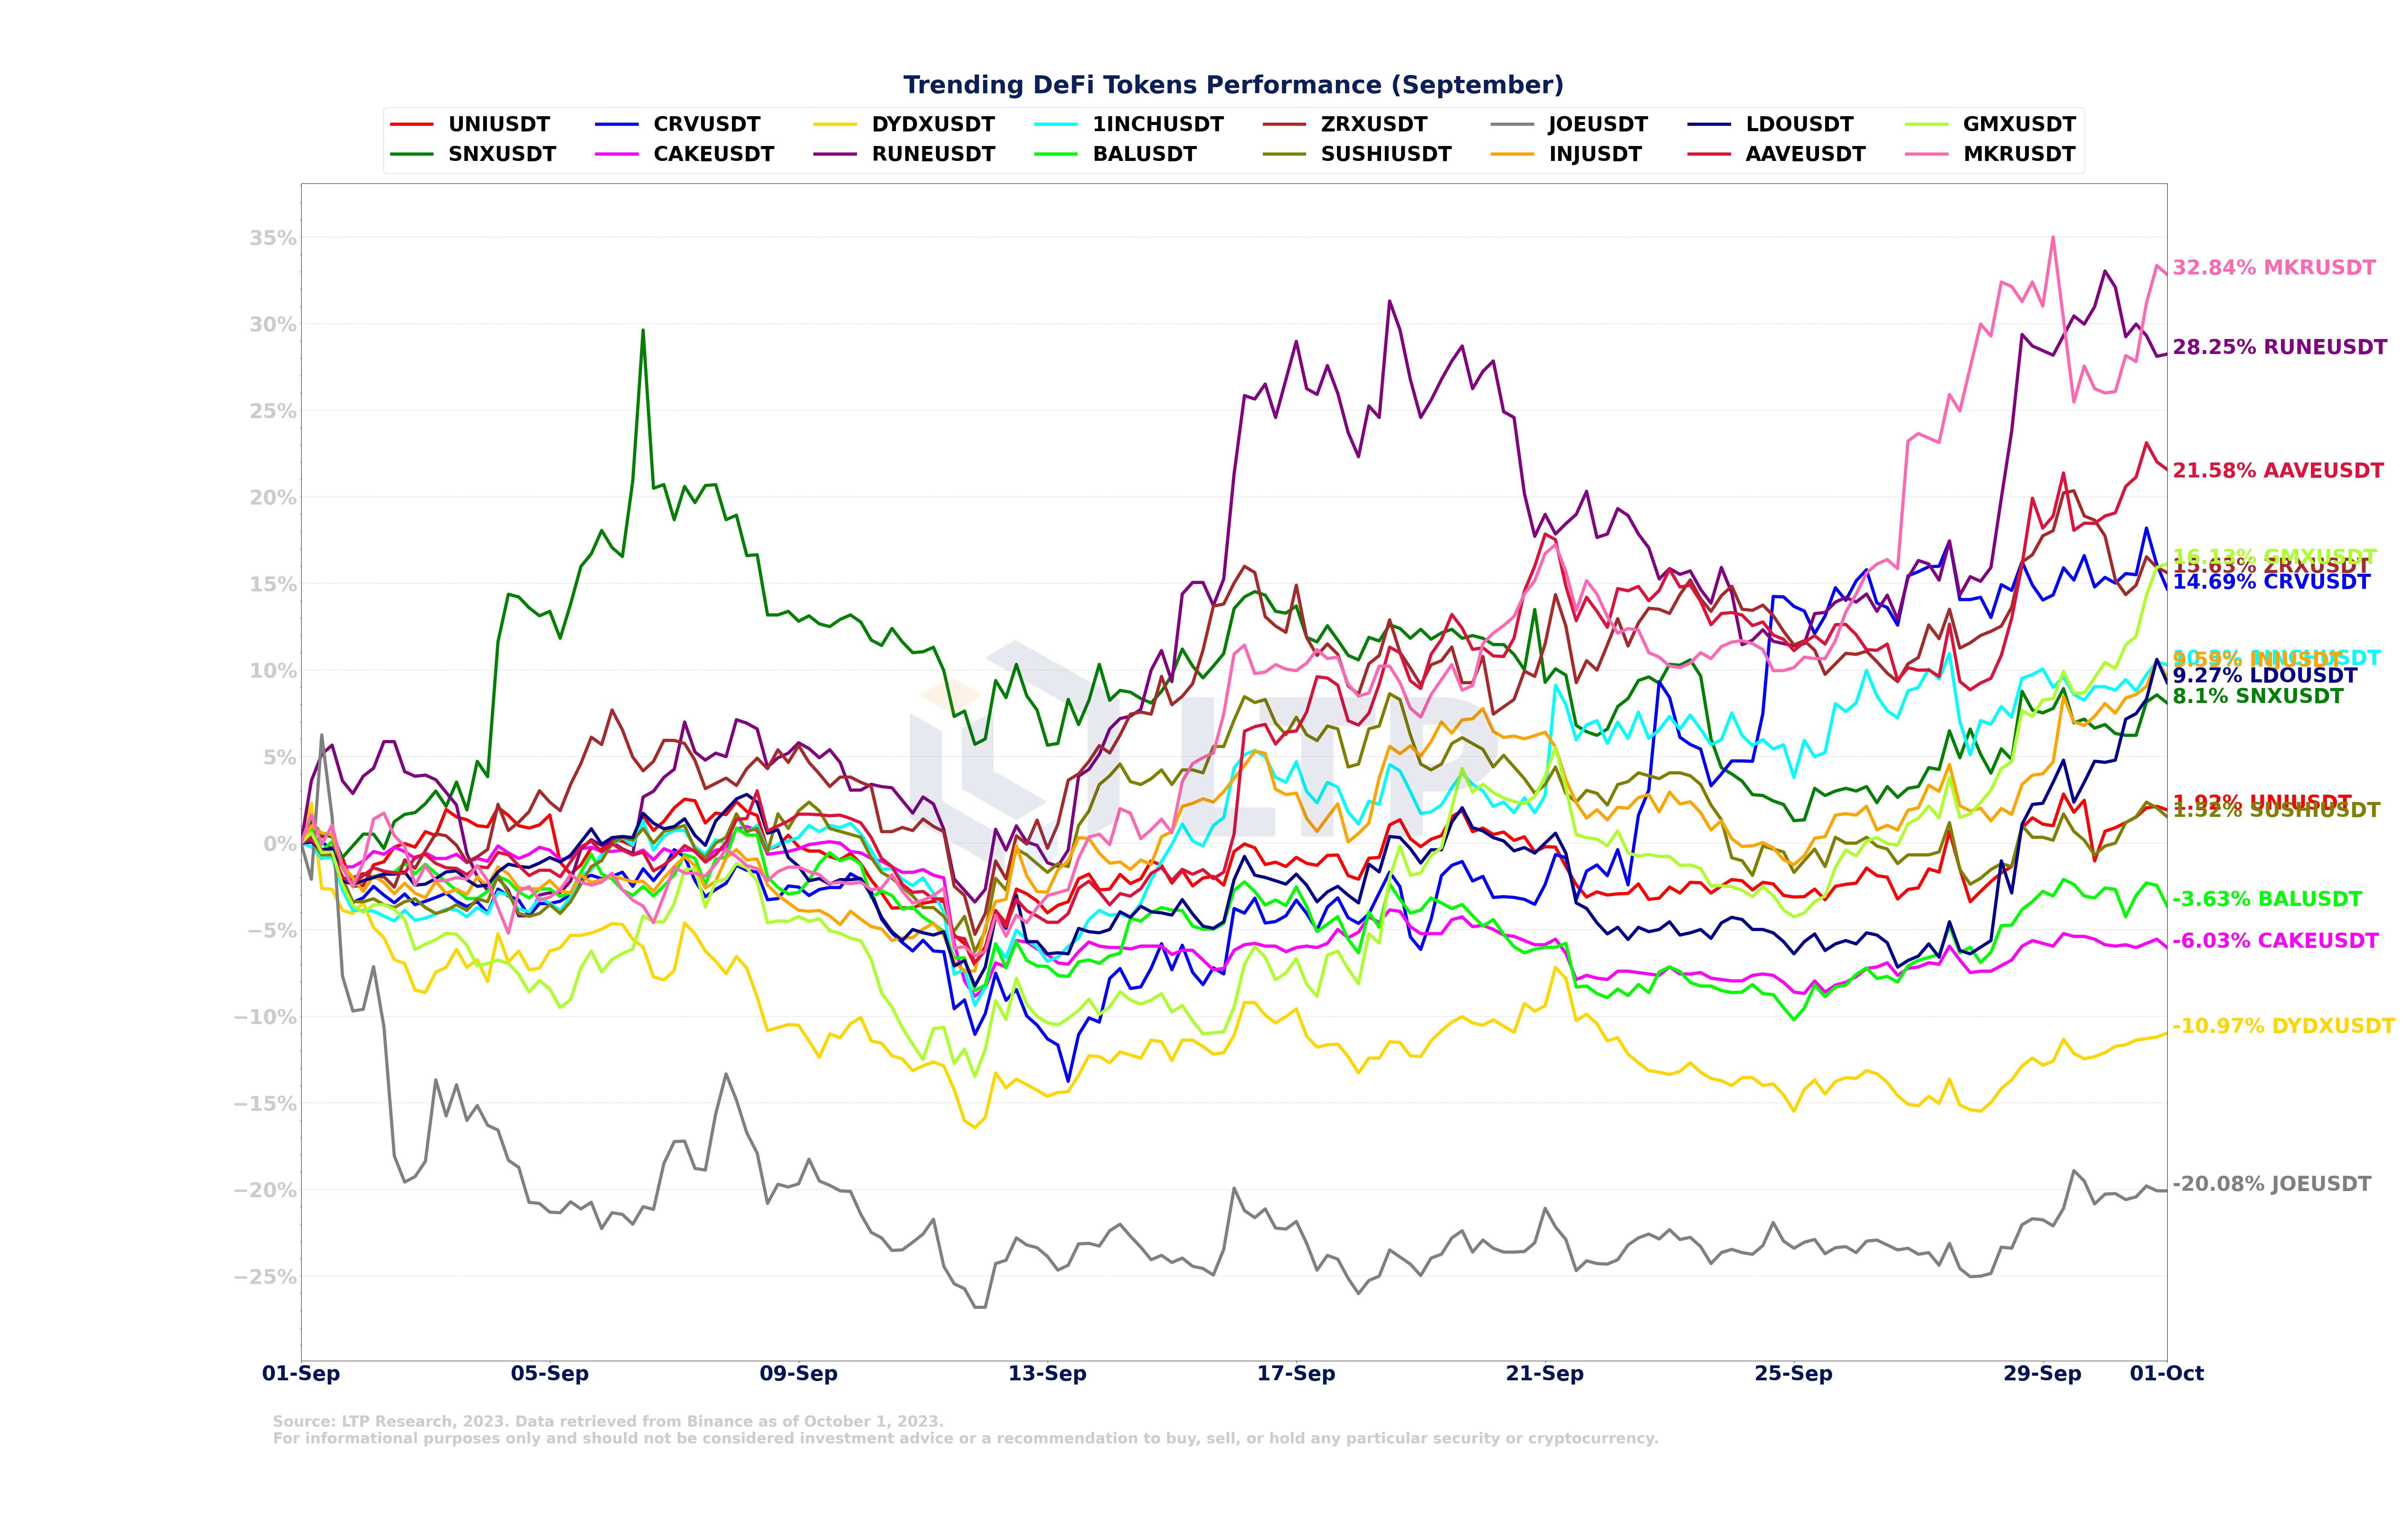
Among DeFi tokens, MKR has been the standout performer, with an impressive 32.8% price increase in September. It is followed by RUNE with a 28.25% increase and AAVE with a 21.58% increase. However, JOE has underperformed, with a 20% price drop over the same period.
2.23 MAGIC Outperforms GameFi/Metavese Tokens
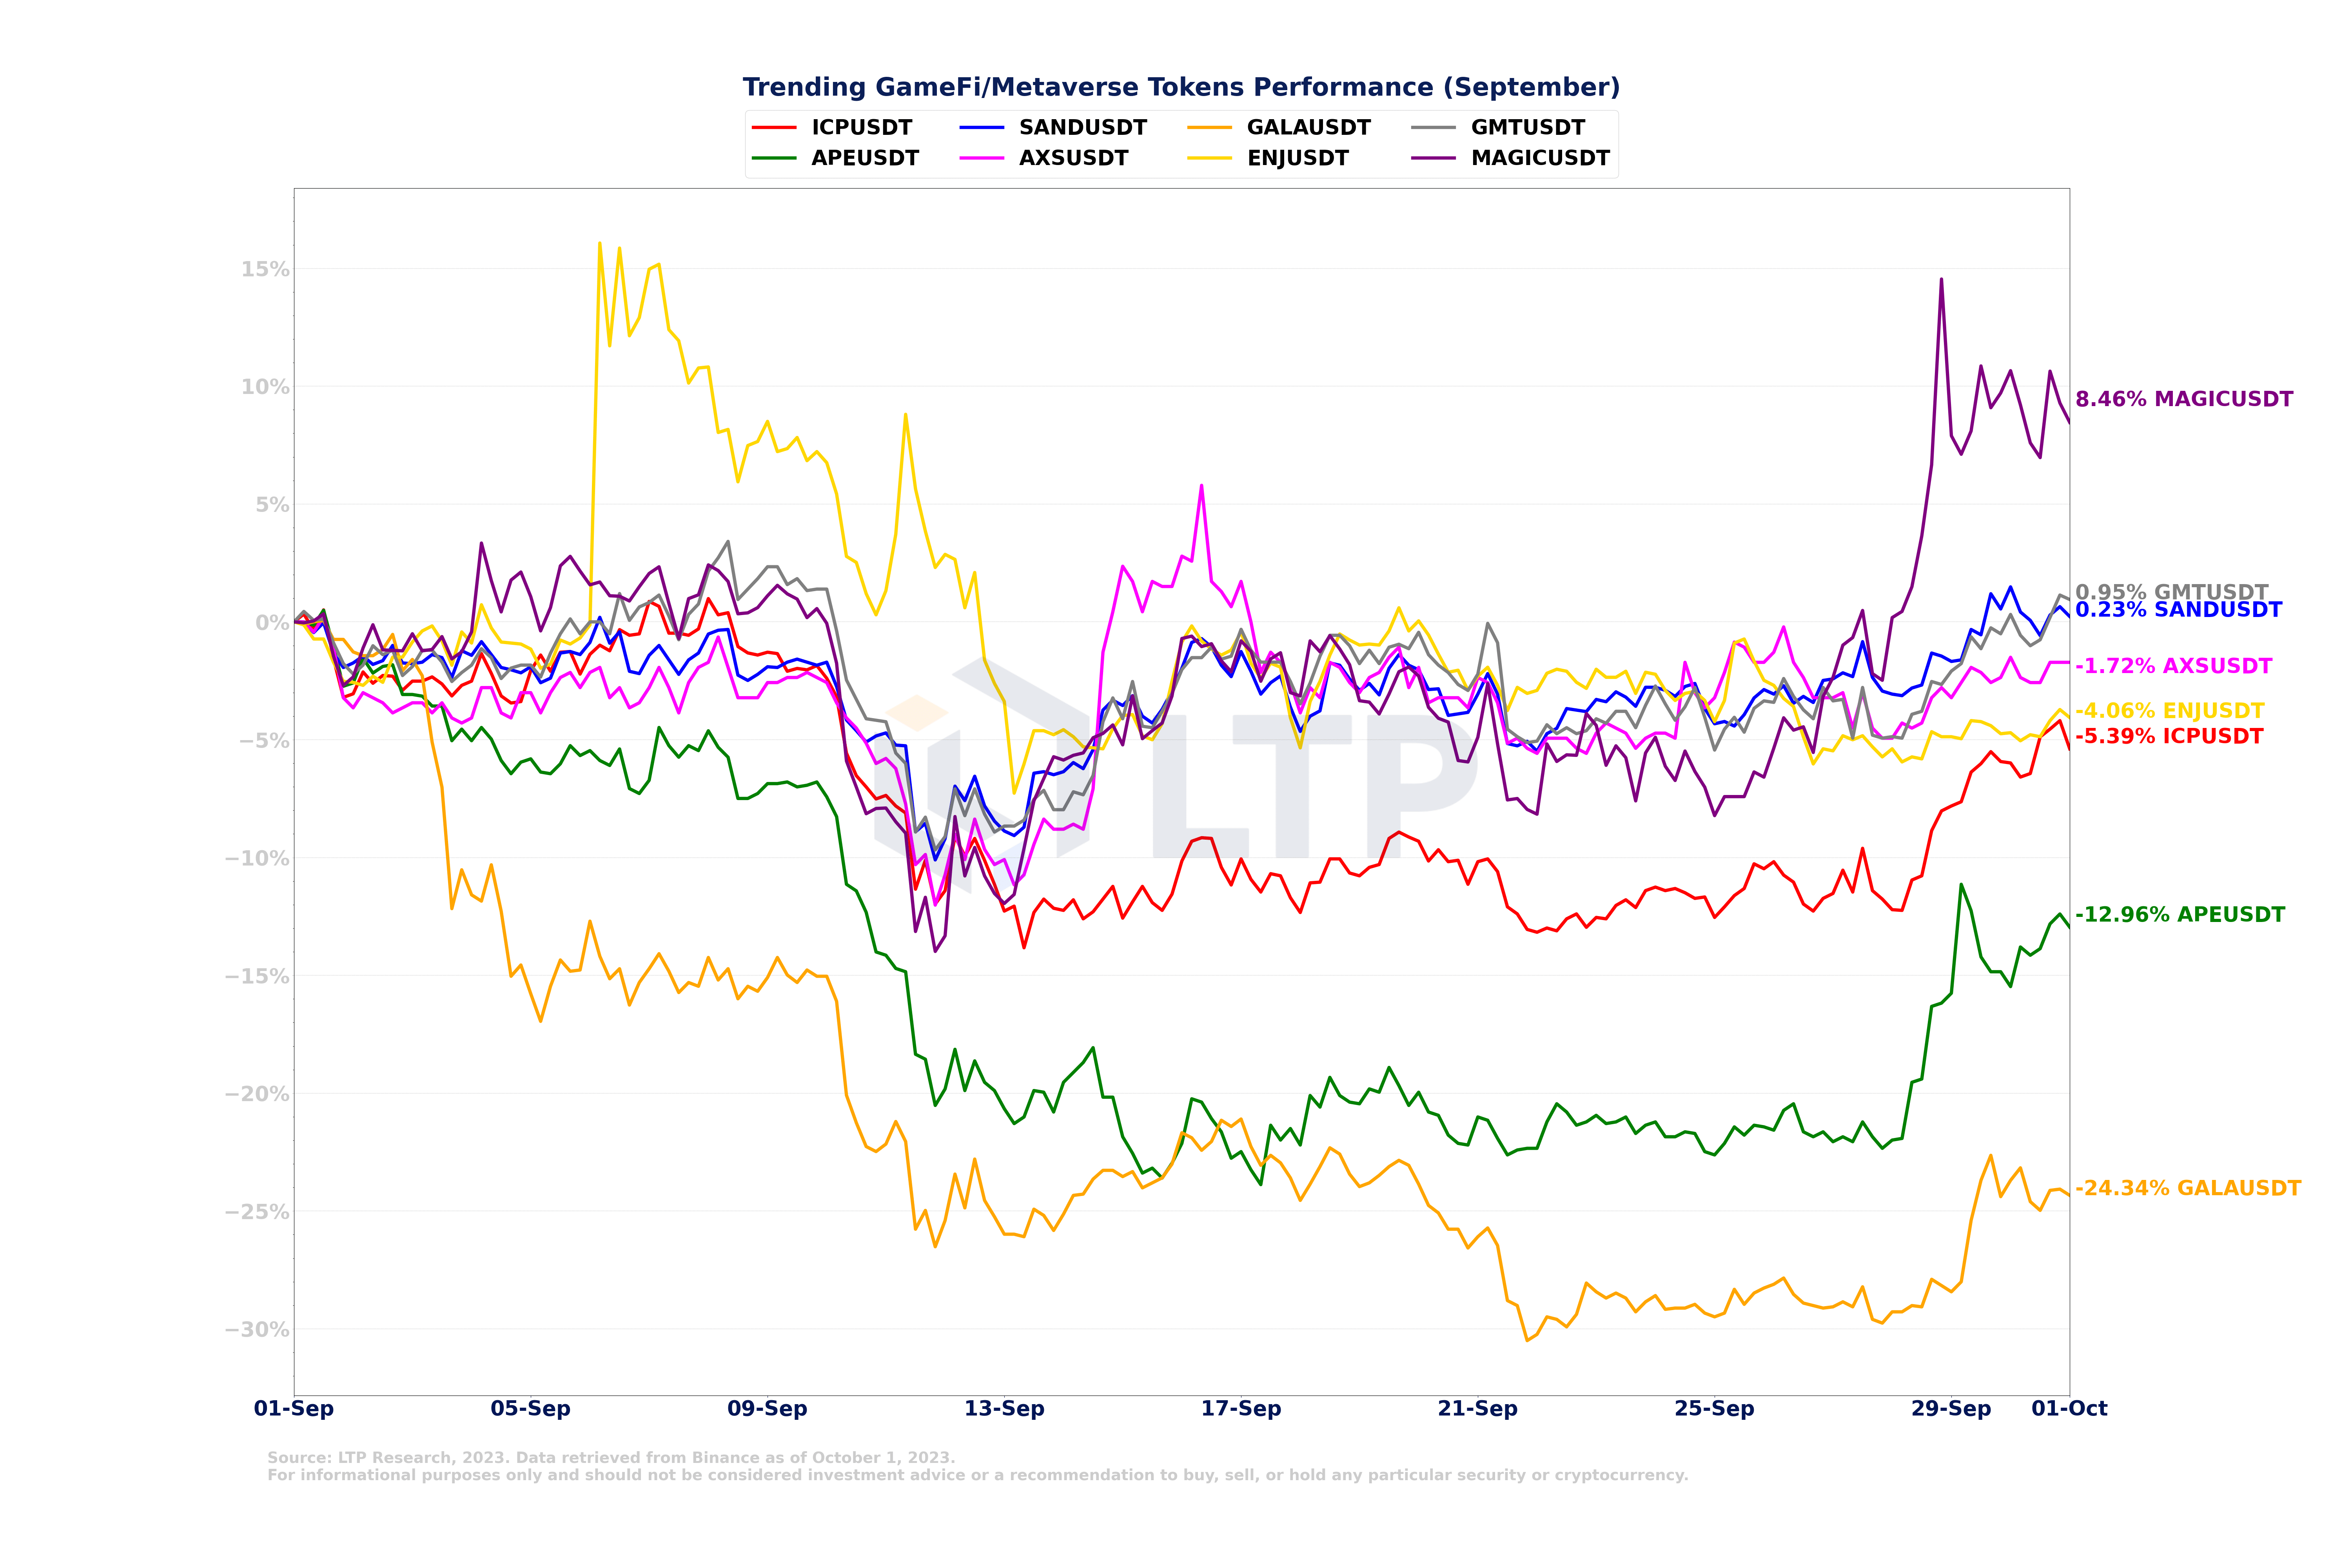
Among the GameFi/Metaverse tokens, MAGIC has performed the strongest, with a price increase of 8.46% in September. However, overall, the GameFi/Metaverse sector has performed relatively poorly compared to the DeFi sector during the same period.
2.24 KCS and FLOKI outperformed CEX and MEME tokens
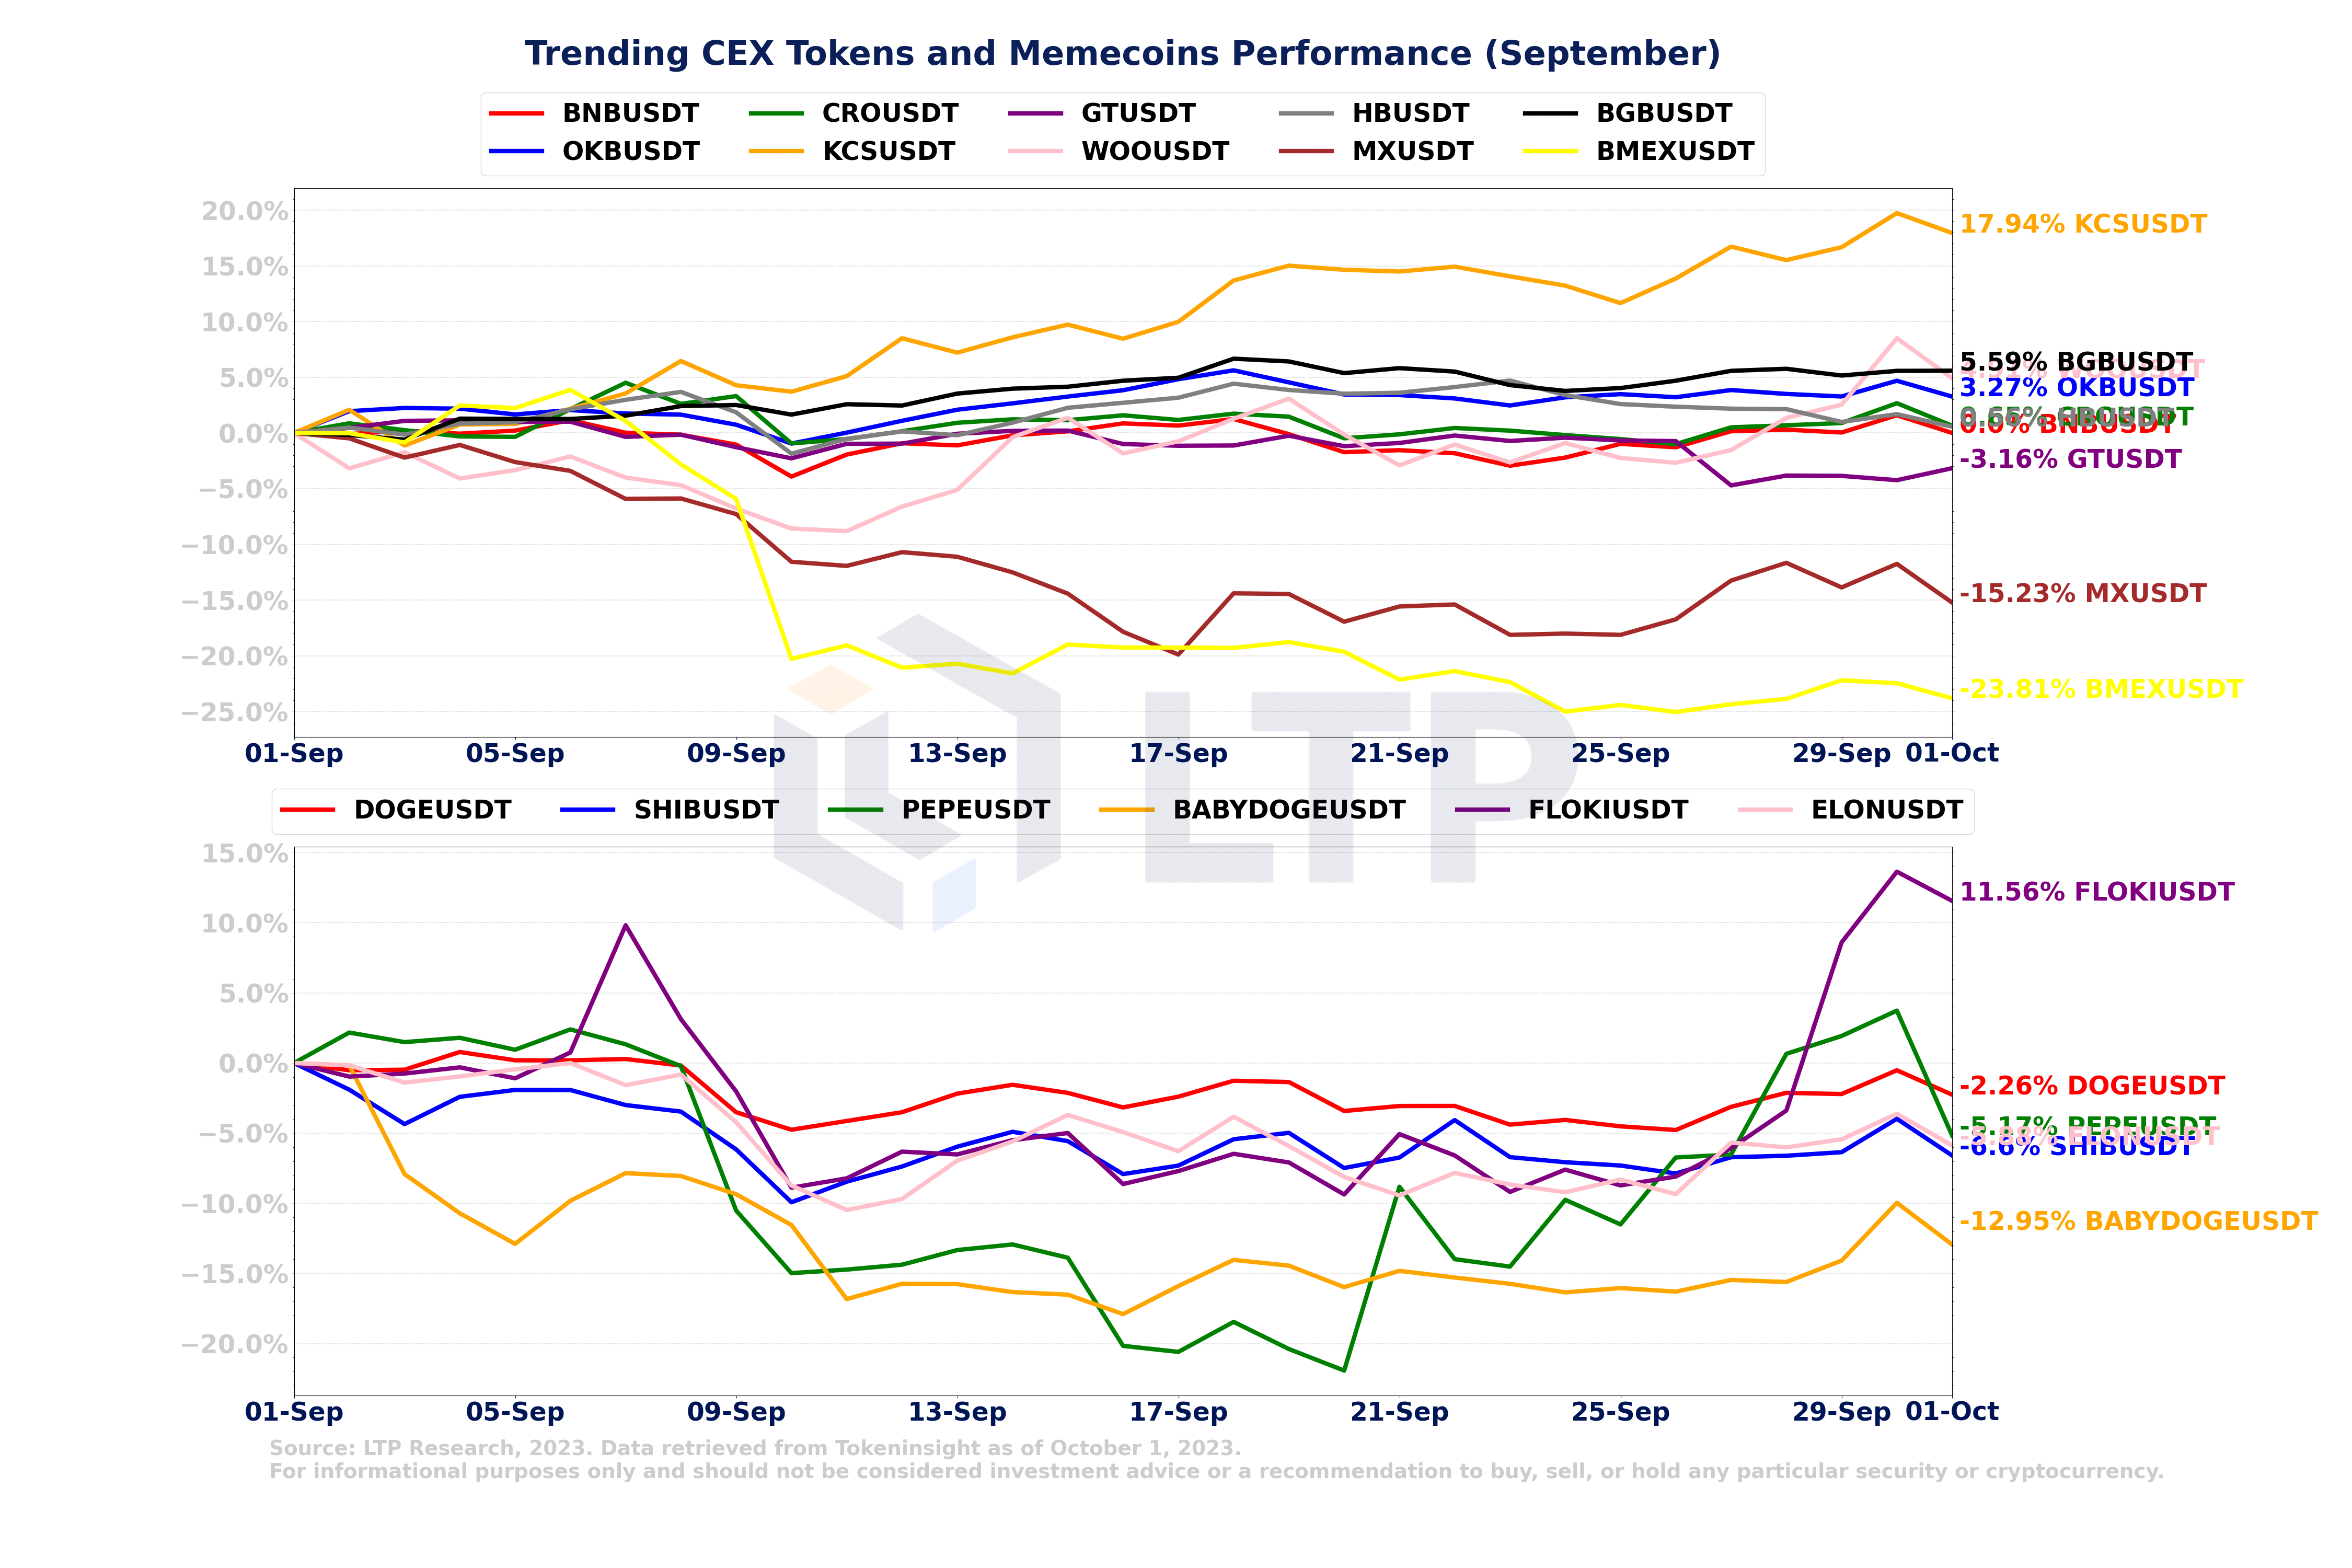
Among CEX tokens, KCS performed strongly with a price increase of 18%. On the other hand, among memecoins, FLOKI performed well with a price increase of 11.56%.
2.25 Seasonal Changes in the S&P 500, Nasdaq, Gold, and Bitcoin
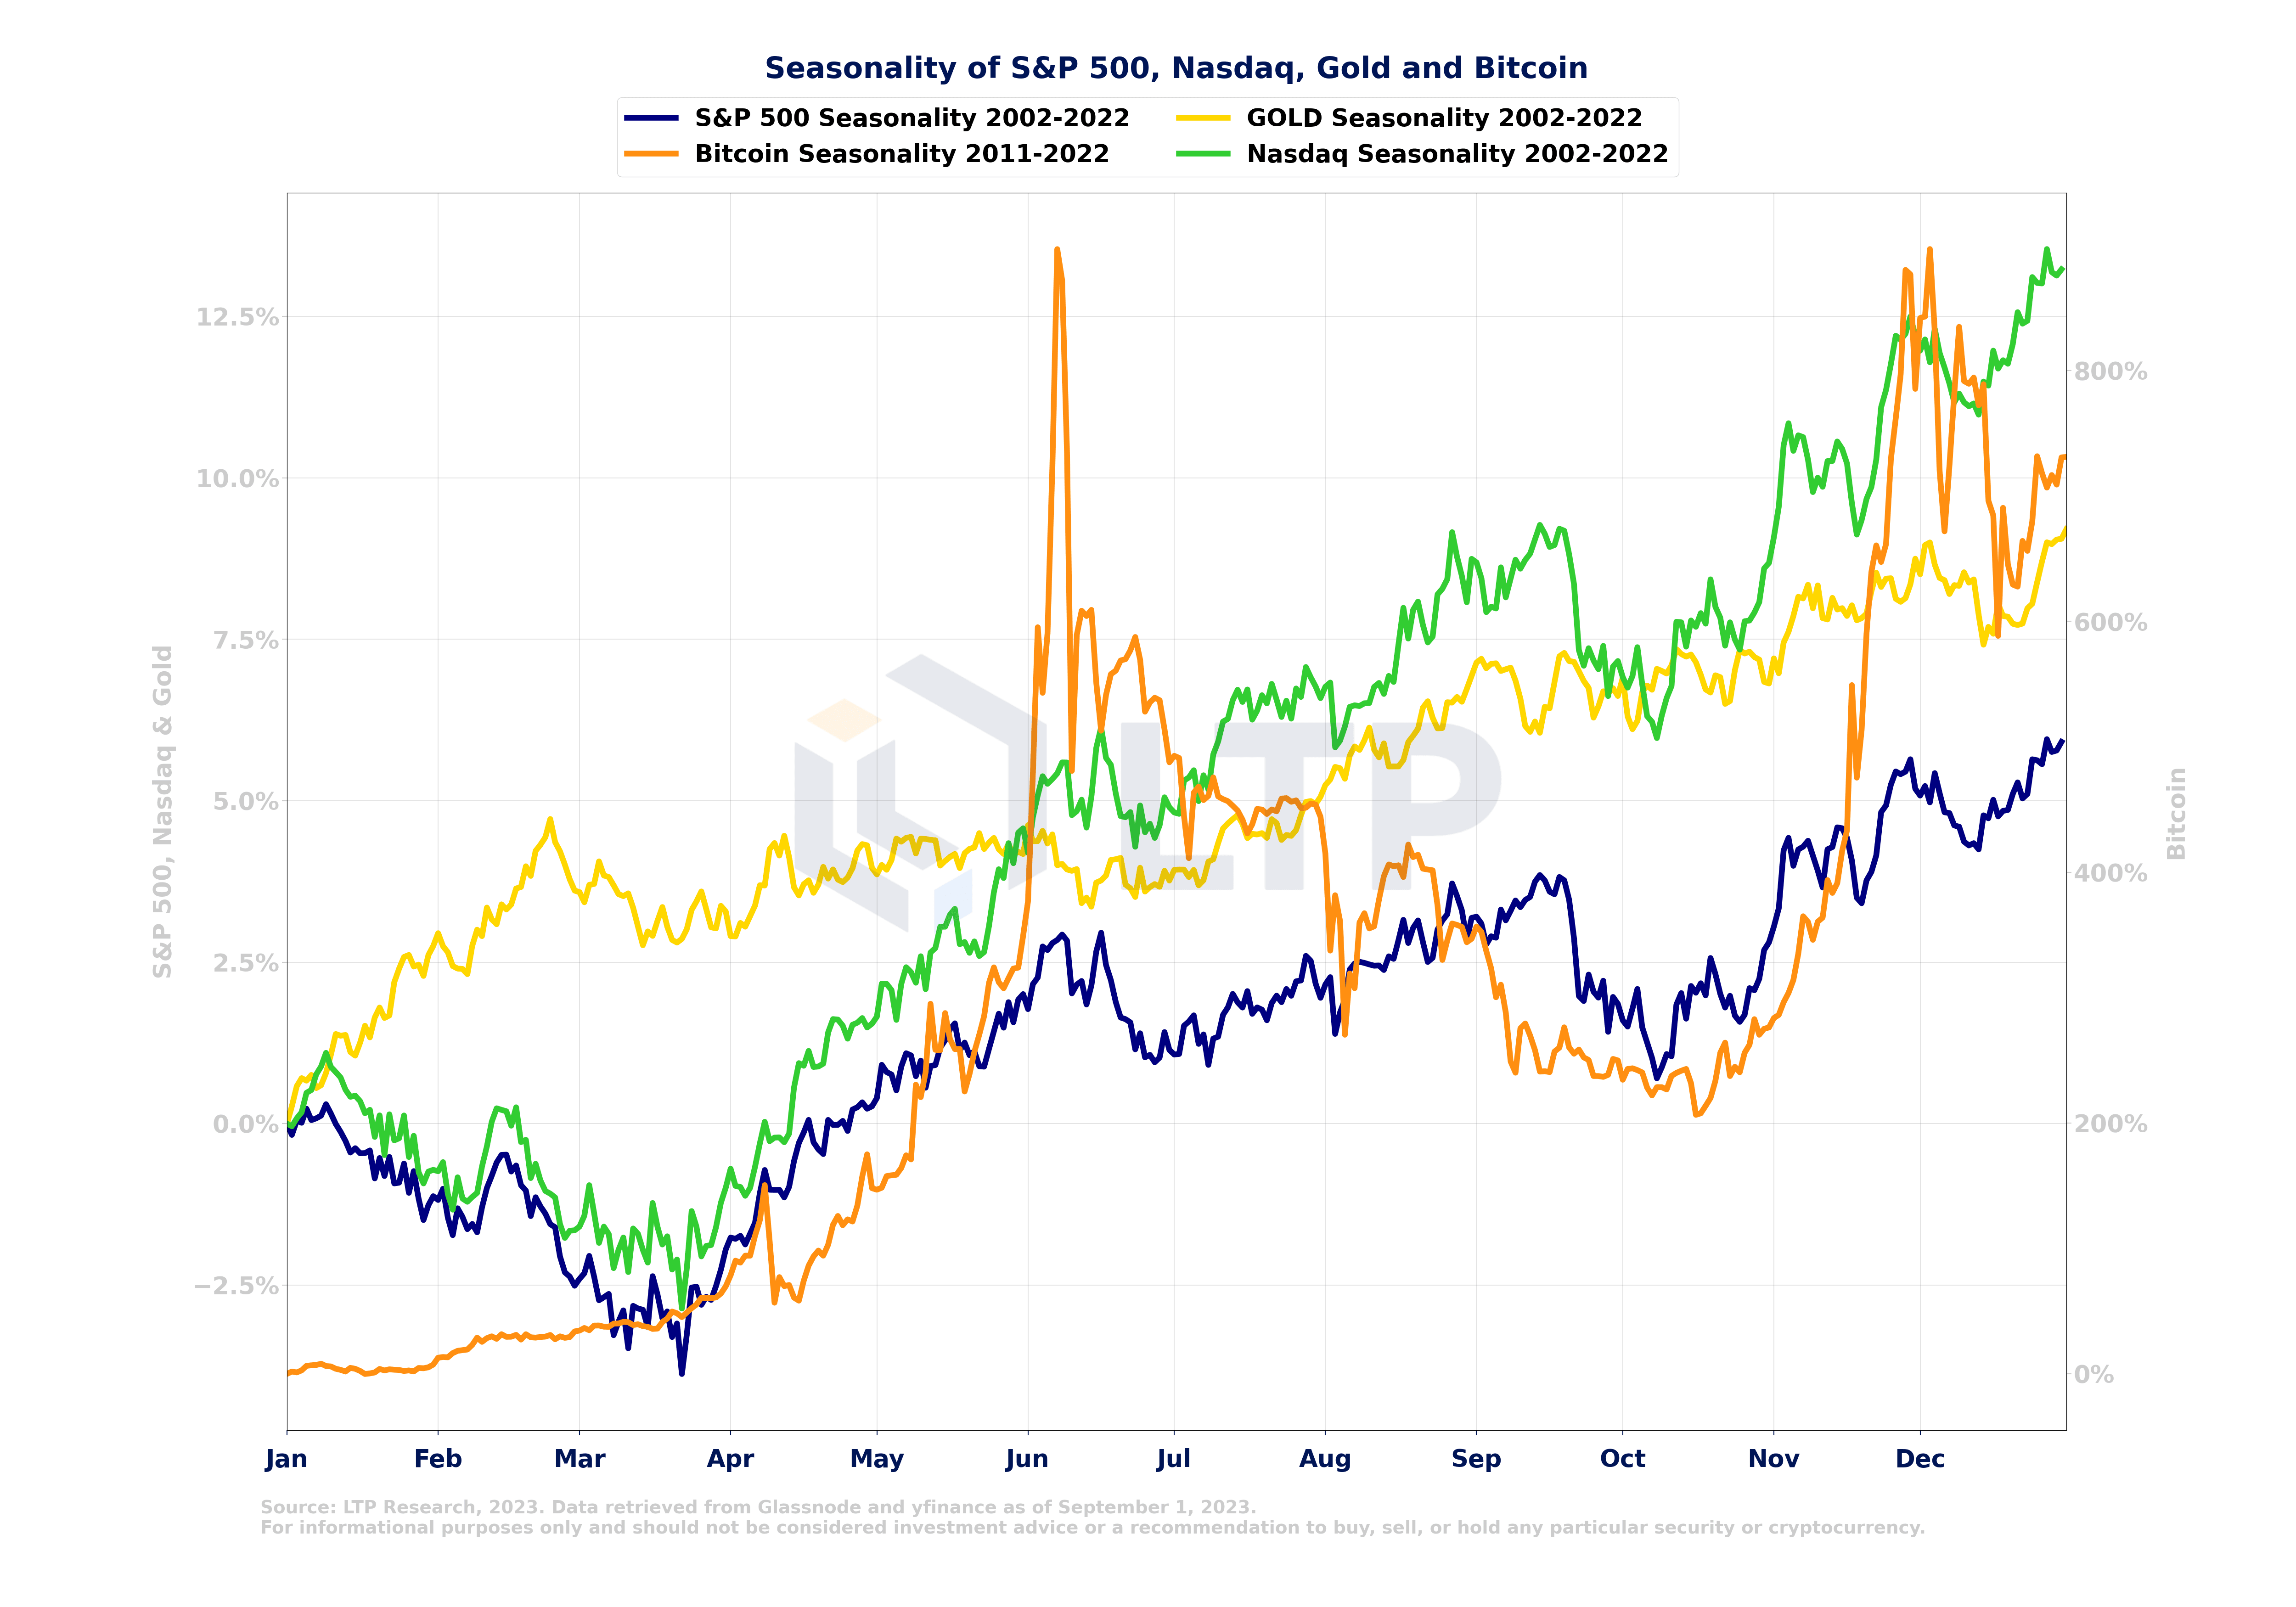
Past performance is no guarantee of future results. In terms of seasonality, October has historically been a turning point for market corrections.
News
Shock in India: An unexpected global call for crypto regulation
Coinbase launches crypto lending platform for US institutions
Coinbase, Aave, And Circle Form Coalition to Promote Tokenized Assets: Report
U.S. CPI Inflation Jumped to 3.7% in August, More Than Expected
Hong Kong Probe Into Crypto Exchanges JPEX Results in Arrest
9 US senators publicly back Elizabeth Warren’s crypto bill
South Korea focuses on OTC crypto regulations as unlawful deals reach $4B
India working on 5-point crypto legislation as ban is ruled out
EU parliament votes overwhelmingly in support of DAC8 crypto tax reporting rule
Grayscale files for new Ether futures ETF — Official
Bybit expects to exit UK market as new regulations loom
SEC Delays Spot Bitcoin ETF Decision for All Applicants Including BlackRock, Fidelity
OKX Planning Web3 Foray Into India, Chief Marketing Officer Says
Robinhood to Buy Back Sam Bankman-Fried's Stake for $605.7M
Bitcoin's Use as Margin Collateral in Crypto Futures Trading Is Growing
Crypto funds hit $342 million outflow streak as bitcoin bucks trend
Genesis to Shutter Crypto Trading Desk for U.S. Market
Solana users fall to lowest level in more than 2 years
Following SEC delays, ARK Invest and 21Shares file for spot Ether ETF
Vitalik Buterin’s X account hacked to carry out phishing attack that stole $700,000 in crypto, NFTs
Messaging App Telegram Gives Endorsement to TON Project; Token Surges
Judge Allows Bankrupt FTX to Sell Its Crypto Holdings, Including BTC and SOL
A Year After Ethereum Merge, Net Supply Down Nearly 300K Ether
Bybit expects to exit UK market as new regulations loom
JPEX exchange suspends certain operations, hikes fees amid liquidity crisis
Mark Cuban loses $860,000 of crypto to phishing attack
Hong Kong regulator: Crypto firms cannot claim to be 'banks'
Grayscale Investments files for new ether futures ETF
Hong Kong looks to release stablecoin regulations by mid-2024, lawmaker says
Tether reportedly shuts USDT redemption for some Singapore customers
Tension rises between Coinbase and SEC over Celsius bankruptcy plan
SEC Extends Ark, Global X ETF Deadlines as Government Shutdown Looms
Binance Sells Russian Unit to Day-Old CommEX, Exits Country
US Treasury sanctions Ethereum wallet tied to cartel over ‘illicit fentanyl trafficking’
Coinbase rolling out perpetual futures trading for retail users outside US
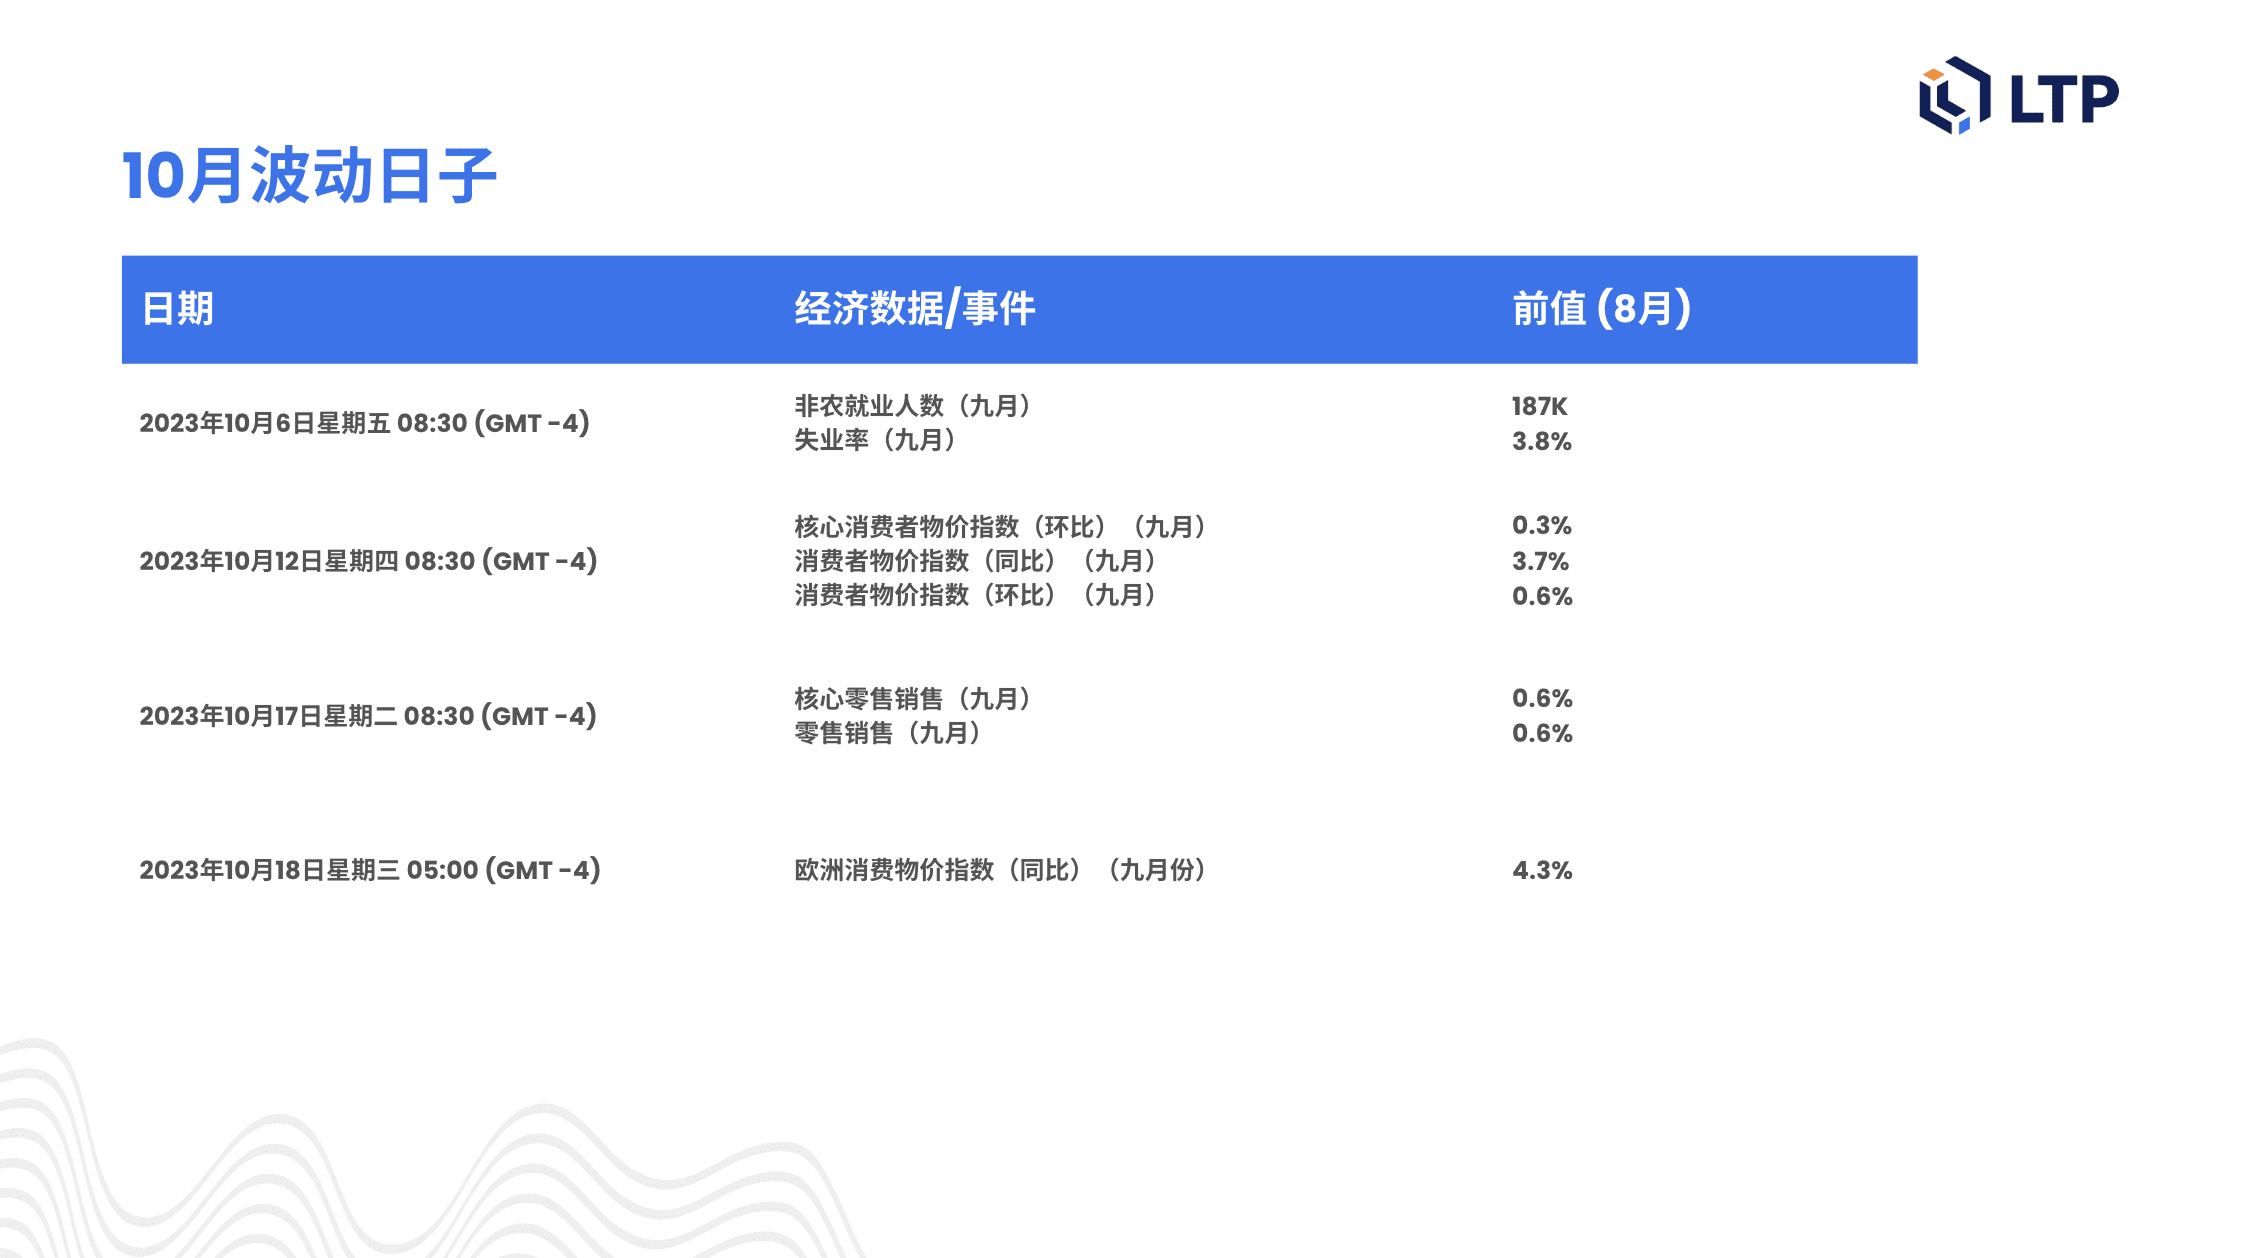
October Volatility Day
appendix
Figure A. Fed Balance Sheet, US Treasury General Account (TGA), Reverse Repo (RRP), and ECB Total Assets
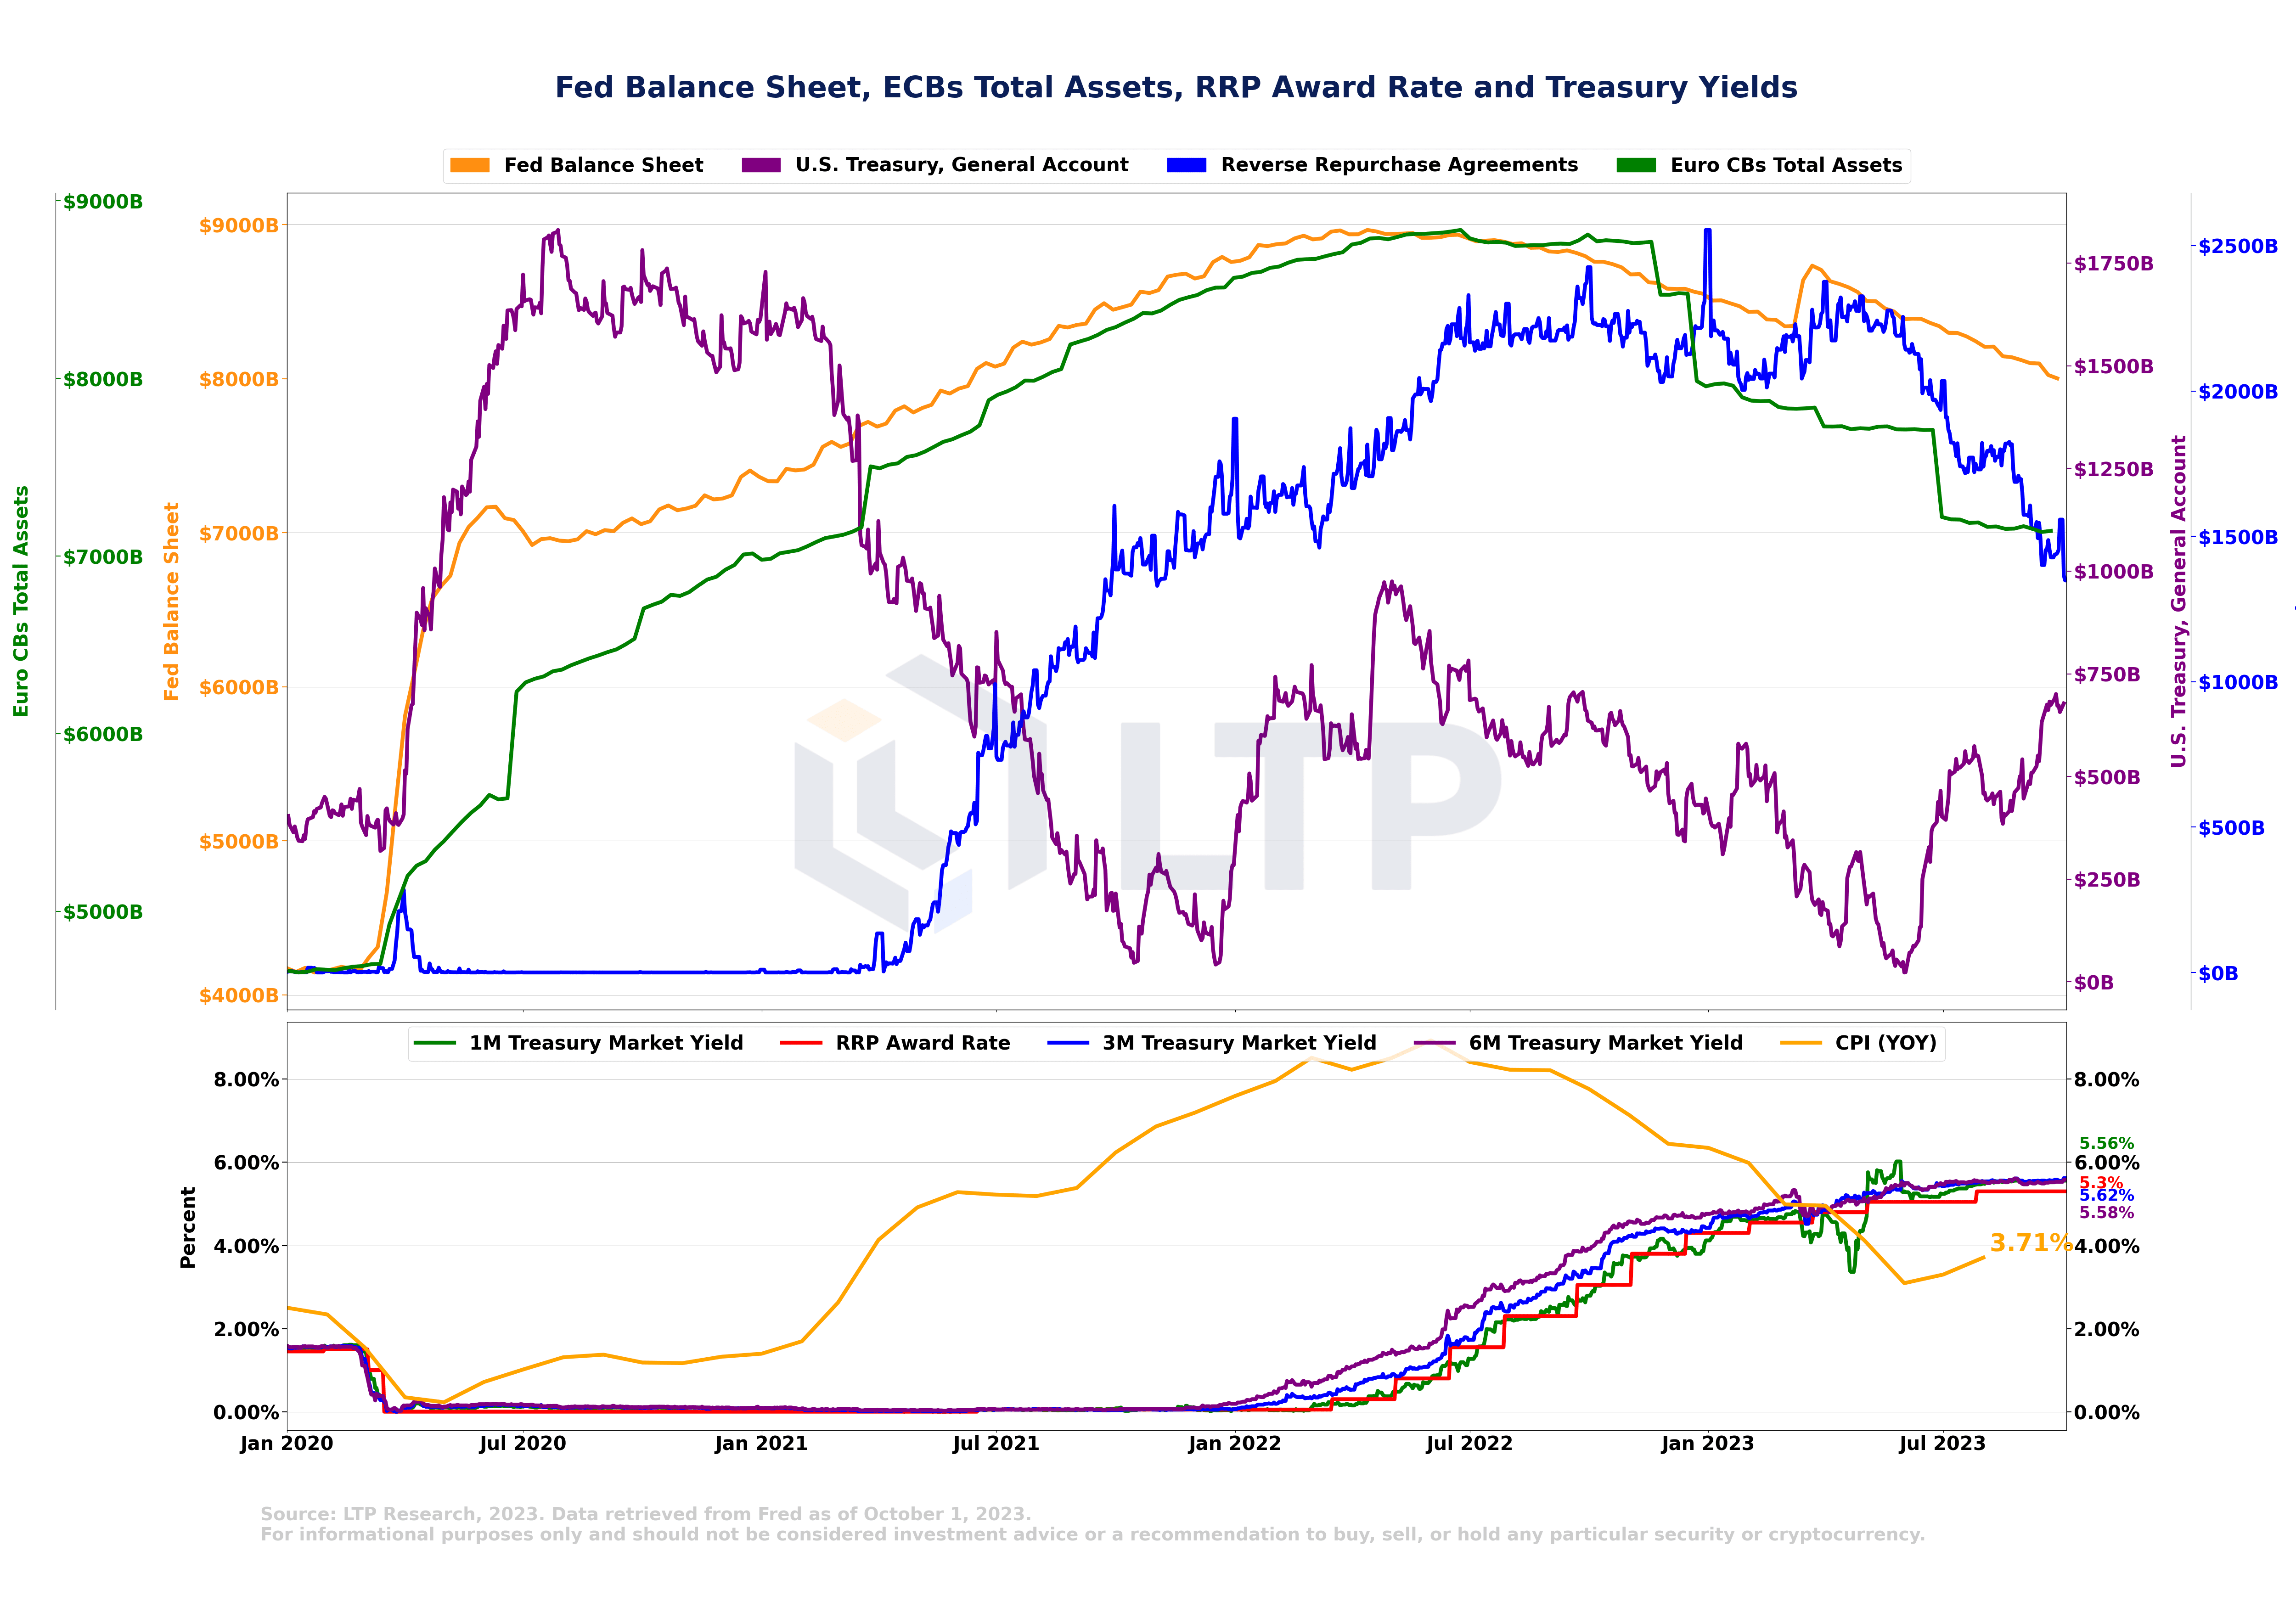
In September, funds continued to withdraw from the Federal Reserve's reverse repurchase agreement (RRP) and move into Treasury bonds because the yield on Treasury bonds was higher than the reverse repurchase agreement.
Figure B. Year-on-year change in CPI, crude oil prices and gasoline prices
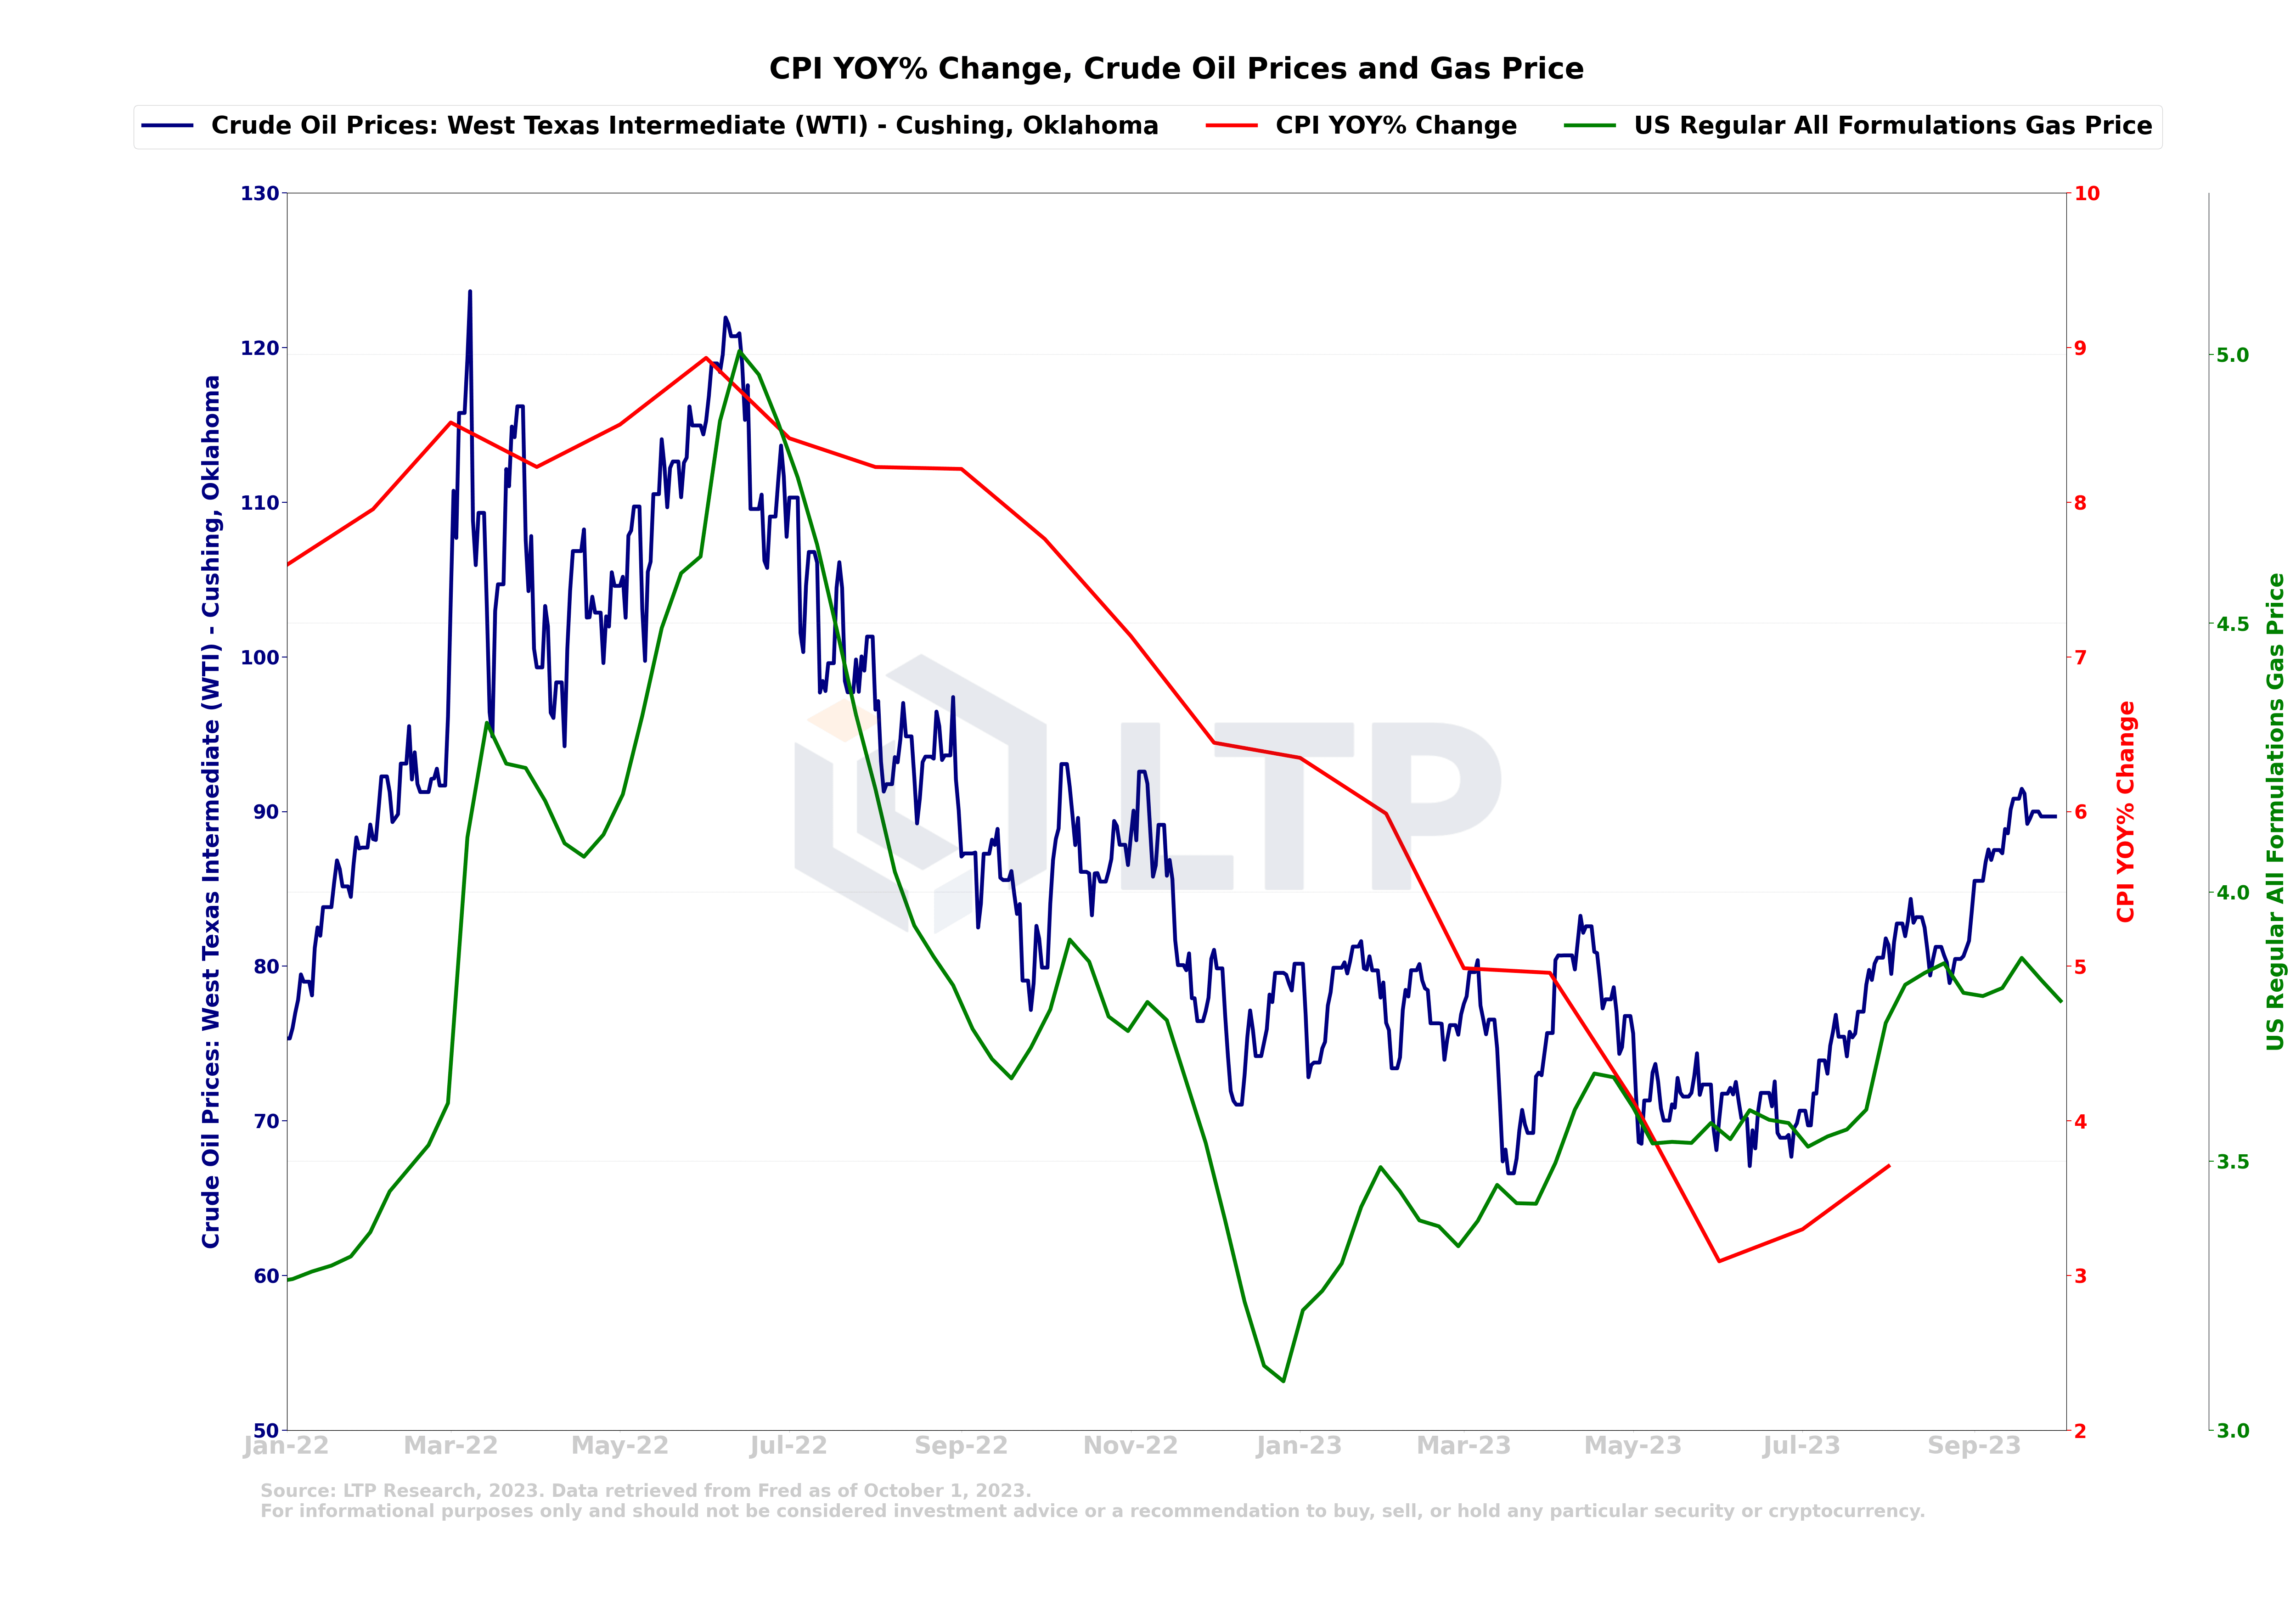
Oil and gas prices have reached their highest point of the year, and considering that energy prices are an important factor leading to inflation, the surge in energy prices has exacerbated overall concerns about fighting inflation.
Figure C. Bitcoin liquidation heat map (Hyblockcapital)
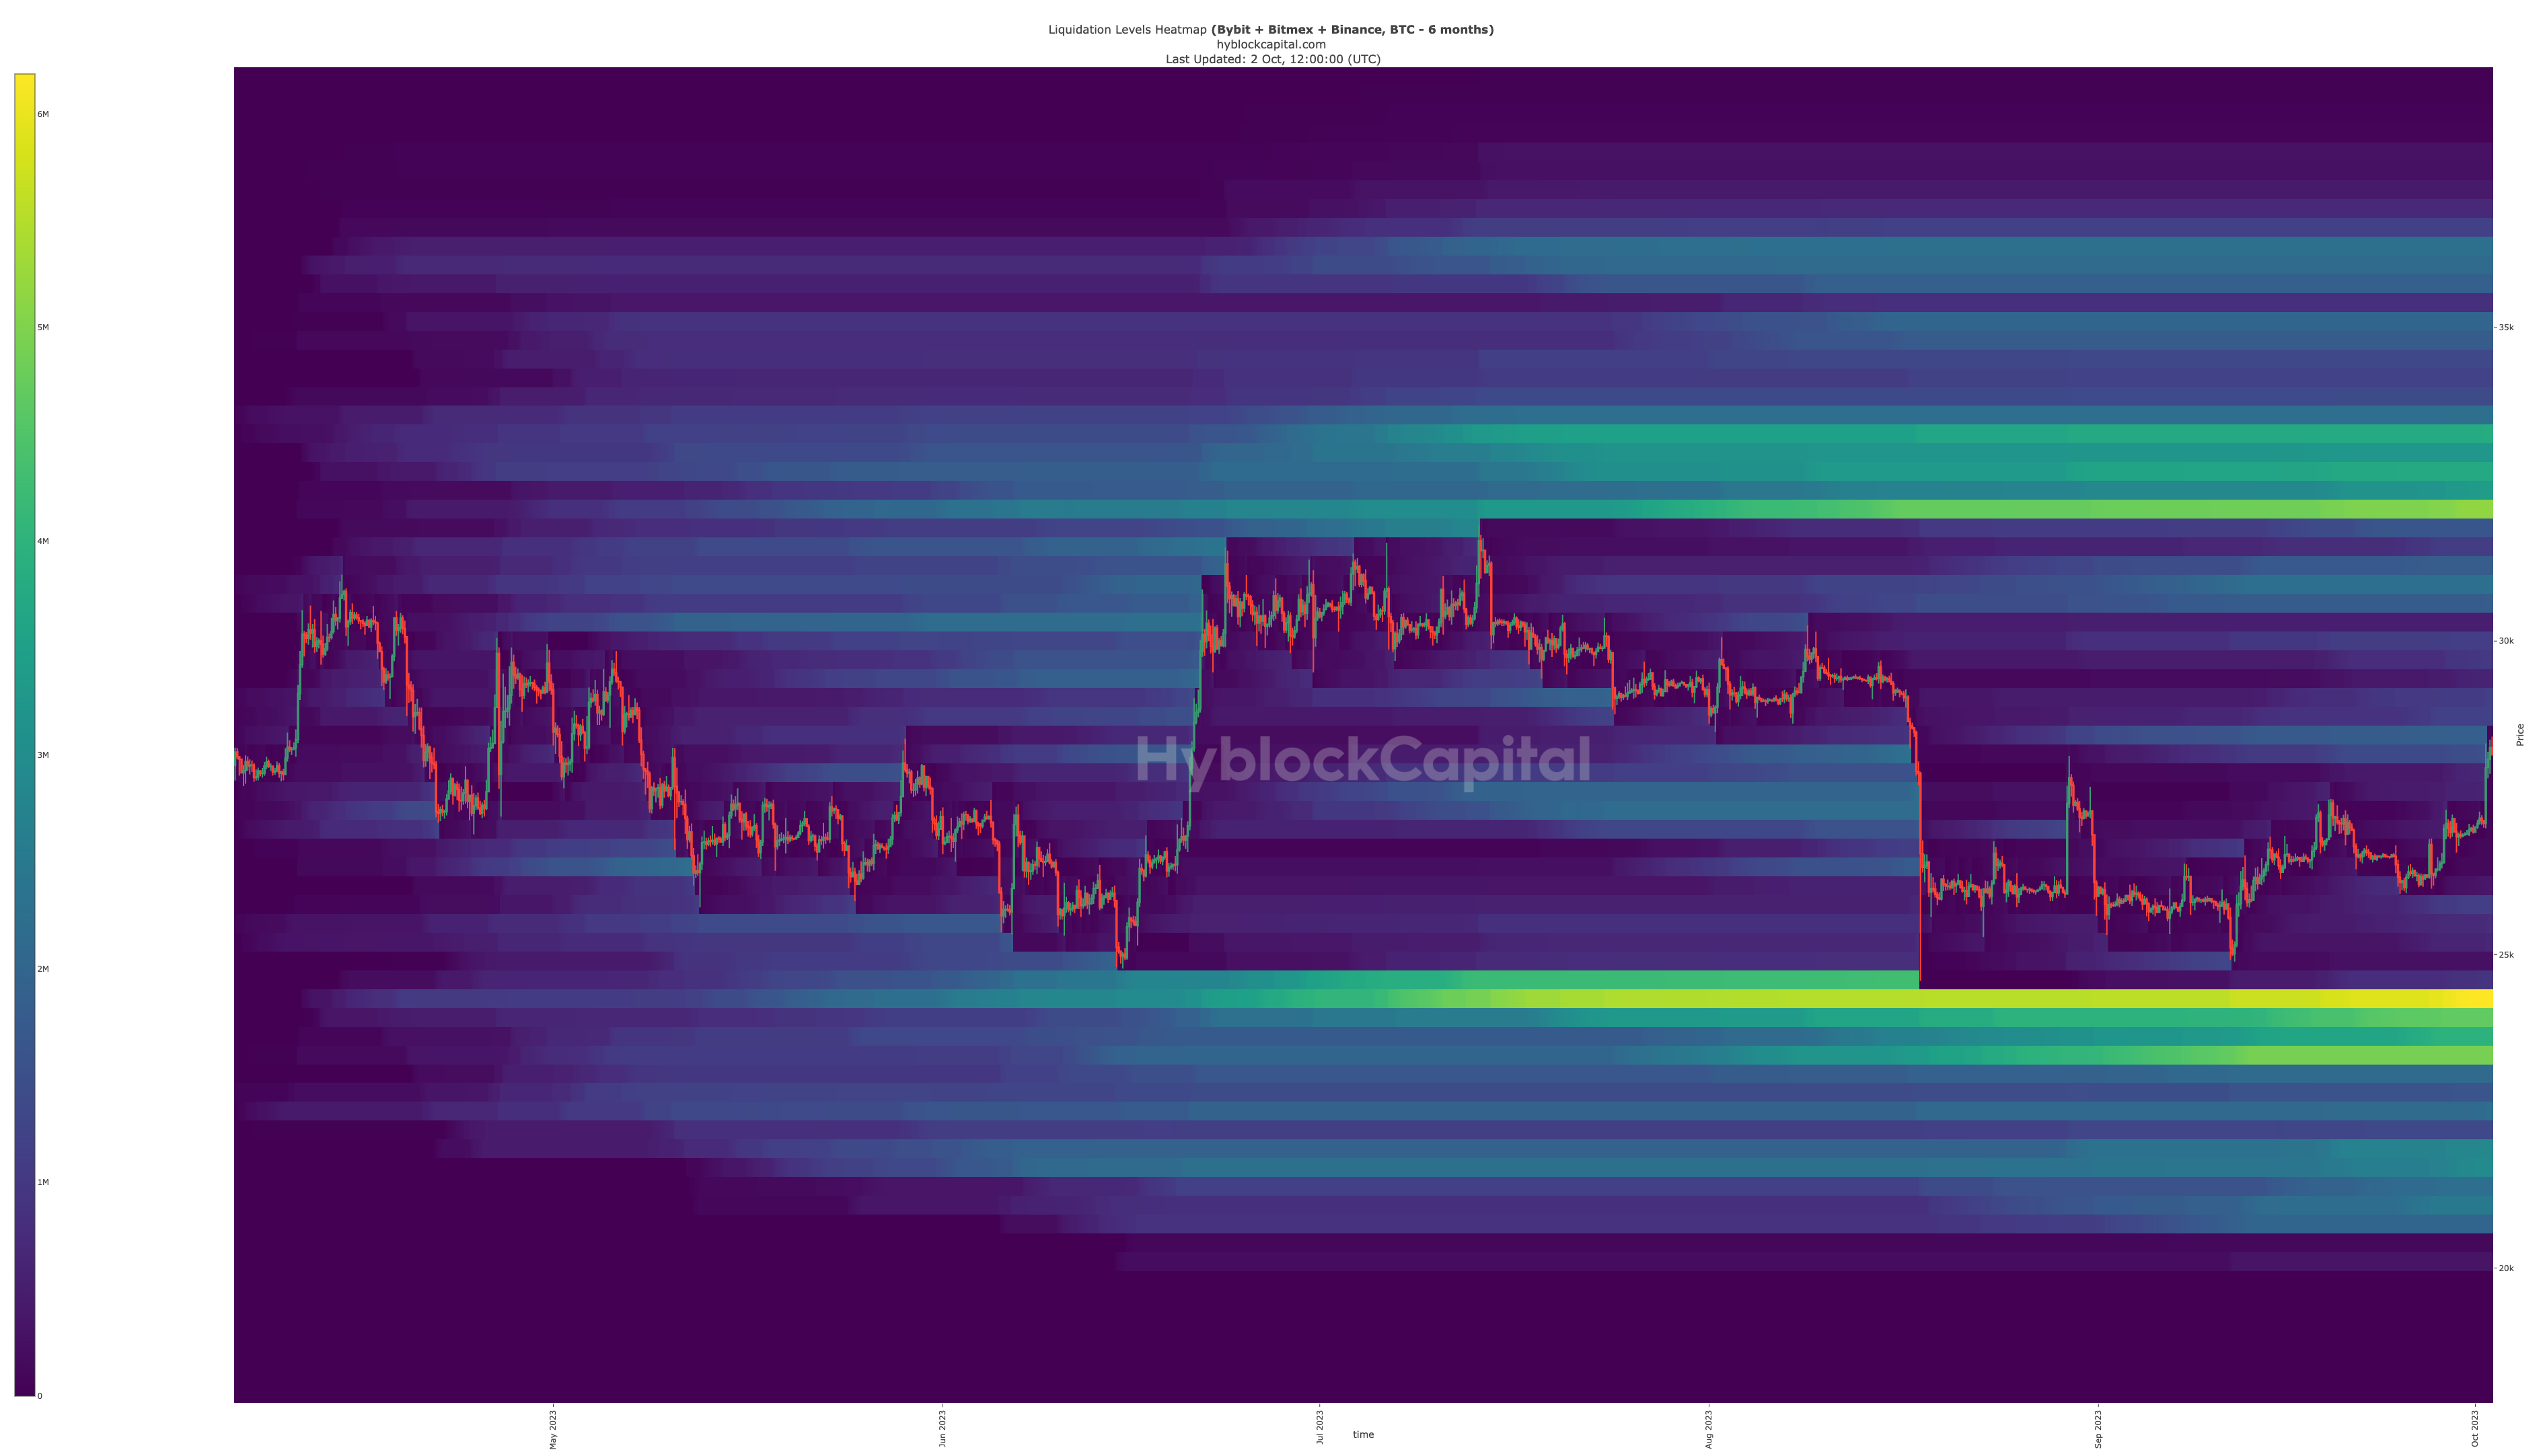
Liquidation zone above market price:
$32,000 - $34,000.
Liquidation zone below market price:
$22,000 - $24,000.
Source: Hyblock Capital, as of October 2, 2023.
It is provided for informational purposes only and should not be construed as investment advice to buy, sell or hold any specific security or cryptocurrency.
Disclaimer
The information, opinions, estimates and forecasts contained in this cryptocurrency market review (collectively, the "Information") are provided by Liquidity Technologies Inc. (the "Company"). The Information is provided for informational purposes only and is not intended to provide investors with any formal understanding or recommendation. The Company has made reasonable efforts to ensure the accuracy and validity of the information provided, but does not make any guarantee as to its accuracy or completeness. The financial opinions expressed reflect the judgment of the author as of the date of publication and are subject to change without notice. This Information should not be construed as an offer or solicitation to buy, sell or trade any cryptocurrency, security or financial instrument. It does not take into account the personal investment objectives or situation of any reader. Cryptocurrencies are highly volatile and complex products and are subject to significant risks, including the risk of sudden and large price fluctuations. Investors in cryptocurrencies do not have any legal liability protection in the event of bankruptcy of the Company. Investors whose value of cryptocurrencies may be affected by changes in currency exchange rates, regulatory intervention or other political and economic developments should be aware that the value of their investment may decline and they may not be able to recover. Any historical information contained in this information is based on our own analysis and is provided for illustrative purposes only. Past performance is not an indicator of future results and results may vary. In no event shall the Company, its directors, employees, agents, partners, suppliers or affiliates be responsible or liable for any indirect, incidental, special, consequential or punitive damages, including but not limited to loss of profits, data, use or other intangible losses, arising out of the use of this information. The Company reserves the right to modify, change, add or delete portions of this information at any time and for any reason without prior notice.