

the introduction
Traders use technical indicators to gain additional insight into the price movements of an asset. These indicators make it easier to identify patterns and immediate buy or sell signals in the current market environment. There are many different types of indicators, and their use is widespread among day traders, swing traders, and sometimes even longer-term investors. Some professional analysts and advanced traders even create their own indicators. In this article we provide a brief description of some of the most common indicators in technical analysis, which can benefit any trader who uses them in his market analysis toolkit.
1. Relative Strength Index (RSI)
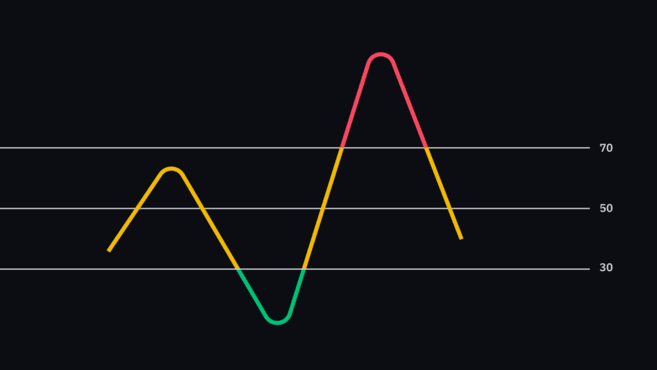
The Relative Strength Index is a momentum indicator that shows whether an asset is more bought or more sold than normal. The indicator does this by measuring the amount of recent price changes (the standard setting is to measure the amount of changes over a previous period of 14 units – i.e. 14 days, 14 hours, etc.). The data is then displayed as an oscillator with values ranging from 0 to 100.
Because the RSI indicates momentum, it shows the rate (or momentum) of price change. That is, if the momentum increases while the price is rising, the uptrend is strong, and more and more buyers are entering the market. Conversely, if momentum decreases while the price is rising, this may show that sellers may soon take control of the market.
The traditional interpretation of the Relative Strength Index is that when it is more than 70, the asset is more bought, and when it is less than 30, then the asset is more sold. Hence, extreme values may indicate an impending trend reversal or pullback. However, it is best not to take these values as direct signals to buy and sell. Like many other technical analysis (TA) methods, the RSI can give false or misleading signals, so it is always useful to consider other factors before entering a trade.
Do you want to know more? See our article on the Relative Strength Index (RSI).
2. Moving Average (MA)
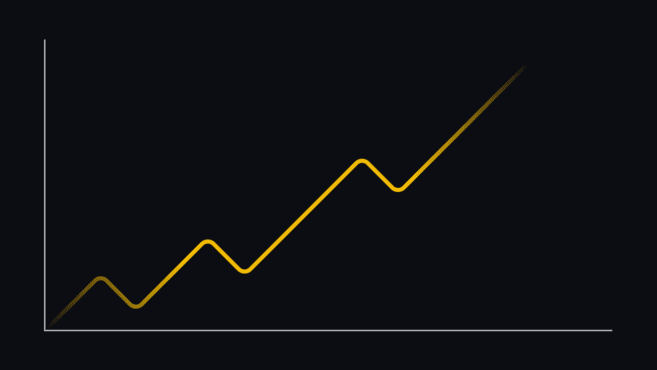
A moving average simplifies price movements by filtering out market noise and highlighting the trend. Since it is based on historical price data, it is a lagging indicator.
The two most common moving averages are the simple moving average (SMA or MA) and the exponential moving average (EMA). A simple moving average is represented on a chart by taking price data for the specified period and calculating the average. For example, a 10-day simple moving average is represented by averaging the price over the last 10 days. The exponential moving average is calculated in a way that gives more weight to more recent price data. This makes it more reactive to recent changes in price.
As mentioned before, moving averages are lagging indicators. The longer the period it represents, the greater the delay. Hence, the 200-day SMA will react more slowly to a recent change in price, compared to the 50-day SMA.
Traders often use the relationship of price to specific moving averages to measure the current direction of the market. For example, if the price stays above the 200-day SMA for an extended period, many traders may consider the asset to be in a bull market.
Traders may also use moving average crossovers as buy or sell signals. For example, if the 100-day SMA crosses downward with the 200-day SMA, this may be considered a sell signal. But what exactly does intersectionality mean? The intersection indicates that the average price over the last 100 days is now lower than the average price over the last 200 days. The justification for selling here is that short-term price movements are no longer following the upward trend, so the trend may be on its way to reversing.
Do you want to know more? See our article on moving average.
3. Moving Average Convergence-Divergence (MACD)
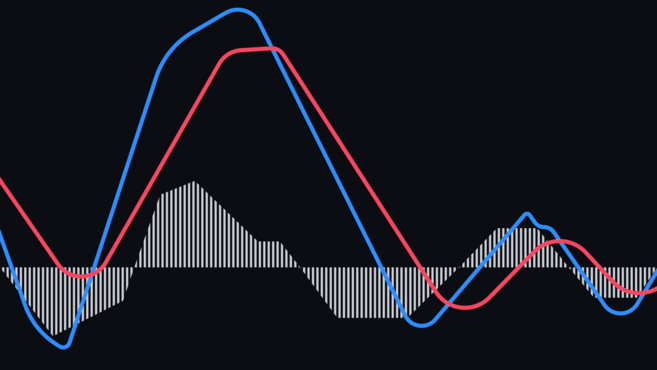
Moving Average Convergence-Divergence (MACD) is used to determine the momentum of an asset by illustrating the relationship between two averages. The MACD consists of two lines - the MACD line and the signal line. The MACD line is calculated by subtracting the 26-period EMA from the 12-period EMA. We then plot this on the 9-period EMA of the MACD line – the signal line. Many charting tools include a histogram that shows the distance between the MACD line and the signal line.
By looking for divergences between the MACD line and price action, traders may gain insight into the strength of the current trend. For example, if the price is at a very high level, while the MACD is at a lower high, this may indicate a market reversal soon. What does the MACD average tell us in this case? It tells us that price is increasing while momentum is decreasing, so there is a greater possibility of a pullback or reversal soon.
Traders may use this indicator to find the intersection between the MACD line and the signal line. For example, if the MACD line crosses upwards with the signal line, this may be a buy signal. Conversely, if the MACD line intersects downward with the signal line, this may be a sell signal.
The MACD is often used with the RSI, as both measure momentum, but with different factors. The assumption is that when taken together they may provide a more complete technical outlook for the market.
Do you want to know more? See our article on MACD.
4. Stochastic RSI indicator (or Stoch RSI)
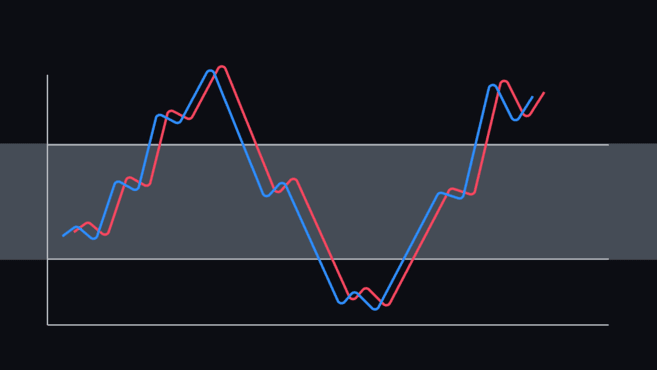
Stochastic RSI is a momentum oscillating indicator used to determine whether an asset is overbought or oversold. As the name indicates, this indicator is derived from the Relative Strength Index (RSI), because it is generated from RSI values rather than price data. This indicator is calculated by applying an equation called the Stochastic Oscillation Equation to normal values of the RSI indicator. Typically, Stochastic RSI values range between 0 and 1 (or 0 and 100).
Because of its speed and greater sensitivity, the StochRSI indicator can generate many trading signals that are elusive to interpret. In general, the Stock RSI tends to make its most use when it is near the upper or lower extreme of its range.
A stock RSI reading exceeding 0.8 is usually considered an overbought of the asset, while a value less than 0.2 is considered an oversold. A value of 0 means that the RSI is at its lowest value in the measured period (the default setting is usually 14). On the other hand, a value of 1 indicates that the RSI is at its highest value in the measured period.
Just like how you use the RSI indicator, the RSI indicates overbought or oversold does not necessarily mean the price will reverse. In the case of the Stock RSI, the indicator simply indicates that the RSI values (from which the Stock RSI is derived) are approaching the maximum of the current readings. It is also important to remember that the Stock RSI is more sensitive than the RSI, so it tends to give more false or misleading signals.
Do you want to know more? See our article on Stochastic RSI.
5. Bollinger Bands (BB)
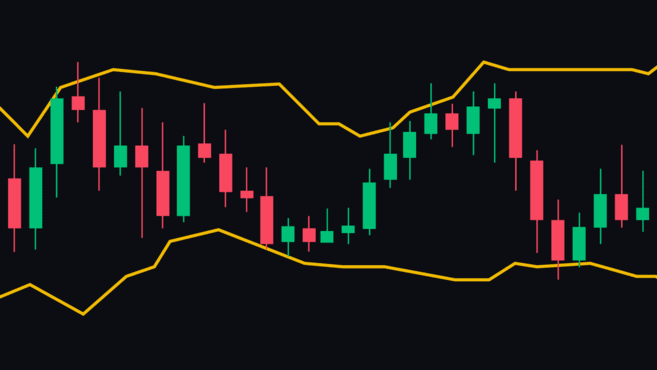
Bollinger bands measure market volatility, as well as instances of overbought and oversold conditions. This indicator consists of three lines – SMA (middle band), upper band, and lower band. Settings may vary, but typically the top and bottom bands are two standard deviations away from the middle band. As volatility increases and decreases, the distance between the bands increases and decreases.
In general, the closer the price is to the upper range, the closer the asset is to overbought status. Conversely, the closer the price is to the lower band, the closer the asset is to an oversold situation. Most of the time, the price will stay within the bands, but in rare cases it may rise above or fall below them. While this event may not be a trading signal in itself, it may indicate extreme market conditions.
Another important concept in Bollinger bands is compression. Squeeze refers to a period of low volatility, where all the bands get very close together. This may be considered a sign of potential future volatility. Conversely, if the ranges move too far apart, a period of low volatility may follow.
Concluding thoughts
Although indicators show data, it is important to note that interpretation of that data is highly subjective. Hence, it is always useful to take a step back and consider whether personal biases are influencing your decisions. What one trader may see as a signal to buy or sell, another may see as just noise in the market.
Like most other methods of market analysis, indicators are most useful when combined with other methods, such as fundamental analysis (FA).
The best way to learn Technical Analysis (TA) is to practice a lot. Head over to Binance and test your new knowledge!