


If you can't see the following pictures clearly, save them to your phone or view them on your computer.
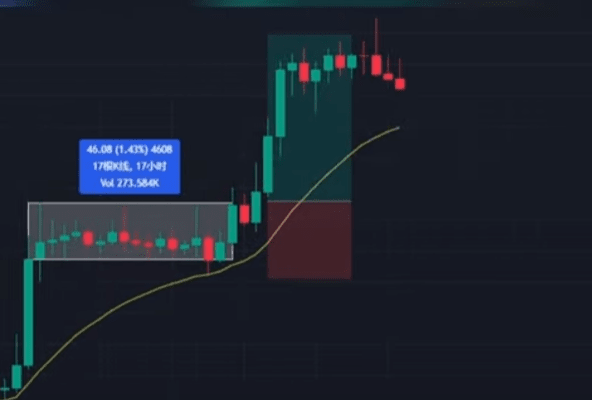
The picture shows a strong rise
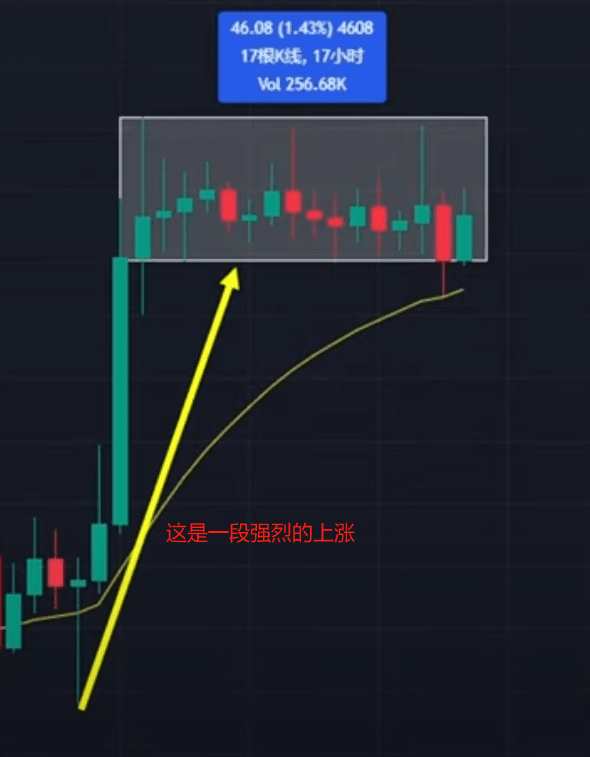
This is an EMA20
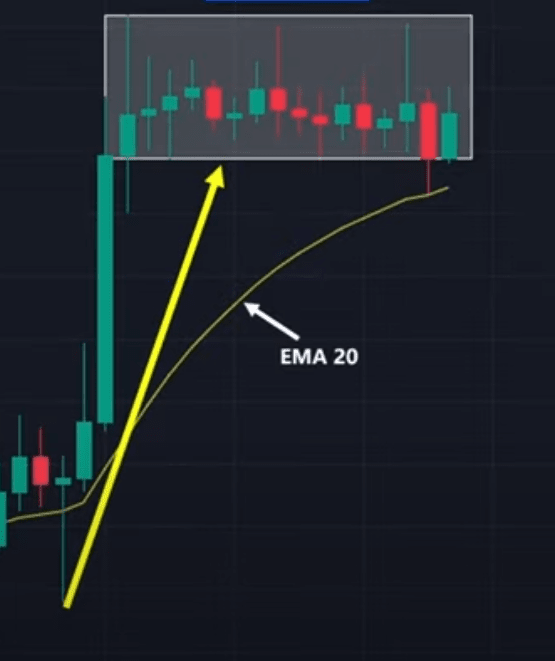
This is a horizontal correction. The positive and negative lines within this correction are very small, and most of them are non-trend K lines.
And there is no volume
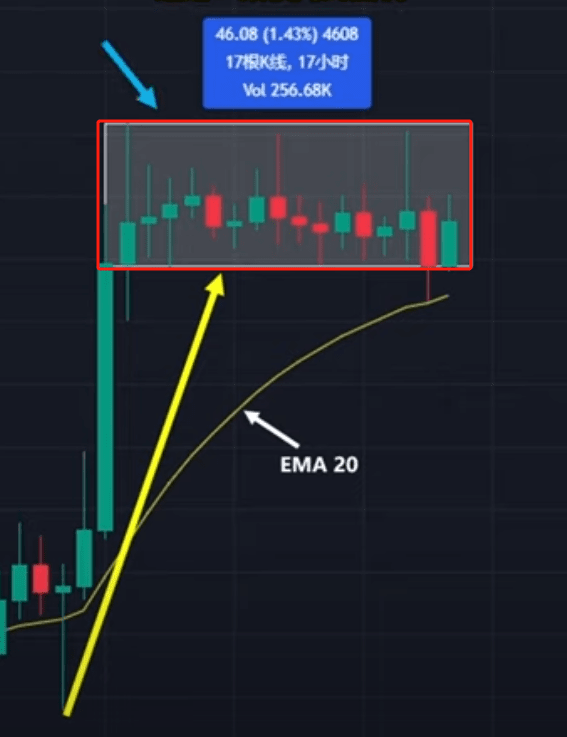
And there is no volume
And it has not fallen below the EMA20 moving average
More importantly, the fluctuation range of this callback has never exceeded 3%.
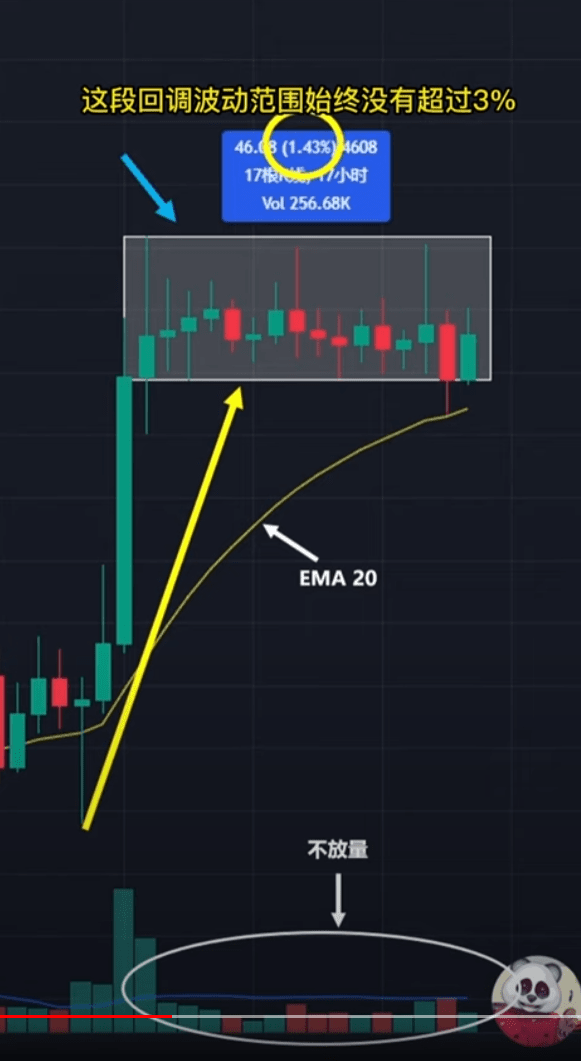
From a distance, it looks like a straight line
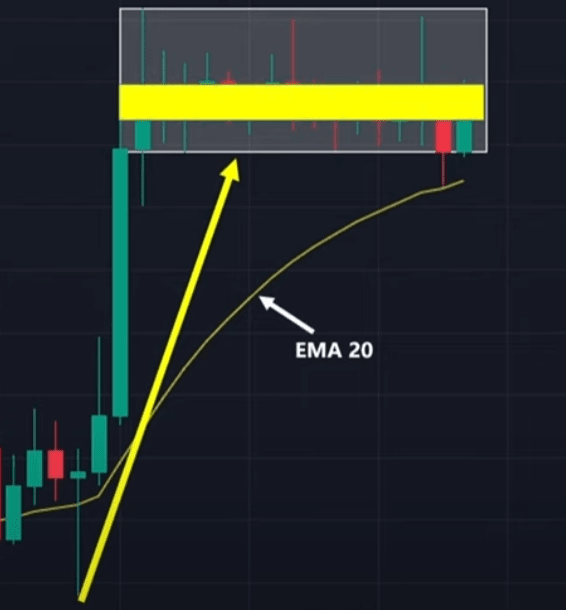
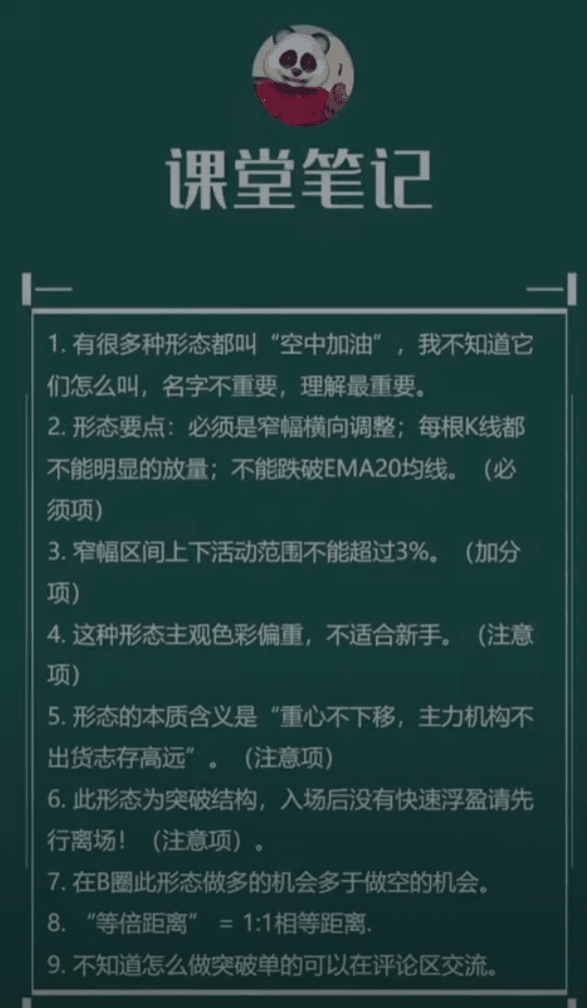
We subjectively refer to this form as "air refueling"
It will at least go out of the same distance as the previous trend.
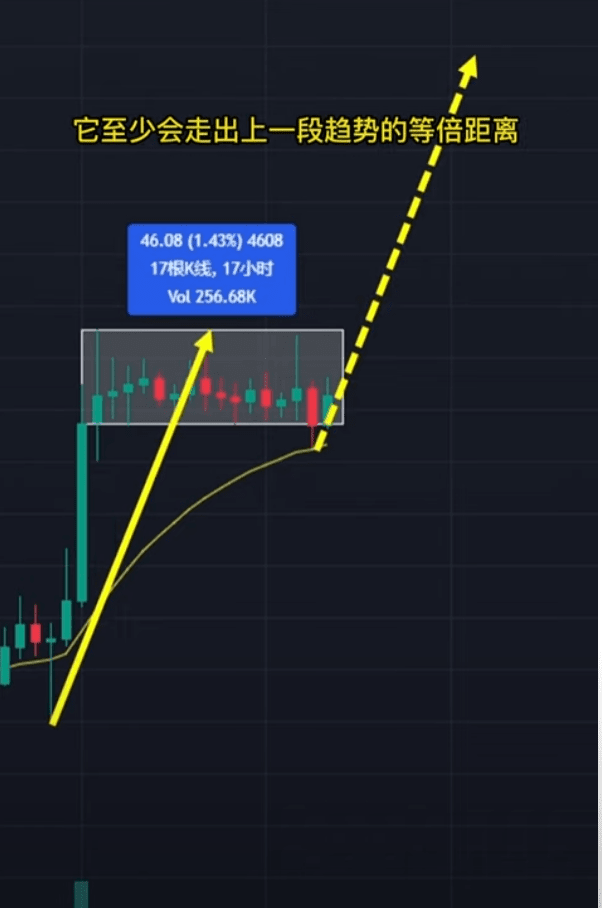
We choose to enter the market through a breakthrough, and place the stop loss at the bottom of the example pattern.
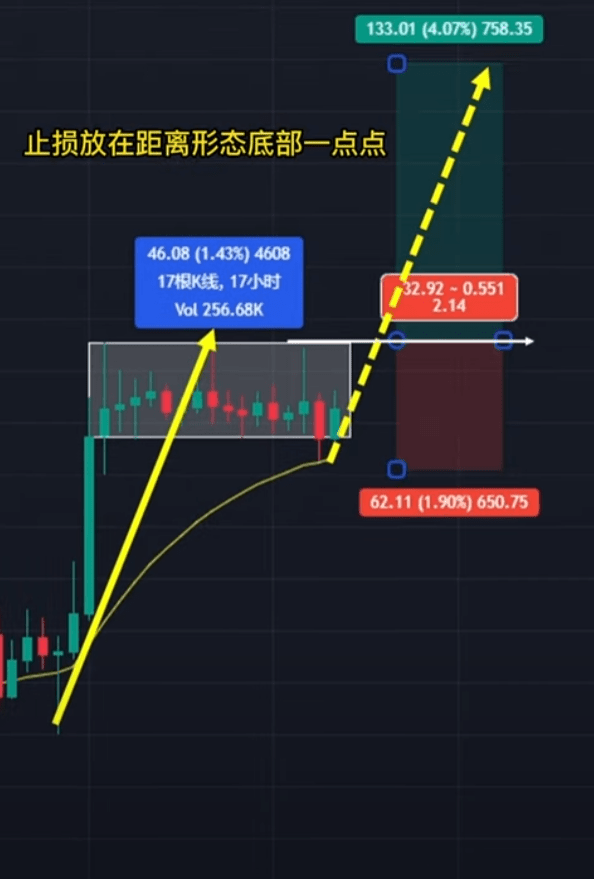
Take profit and get the same upside potential
Trading plan completed
The rest is up to time
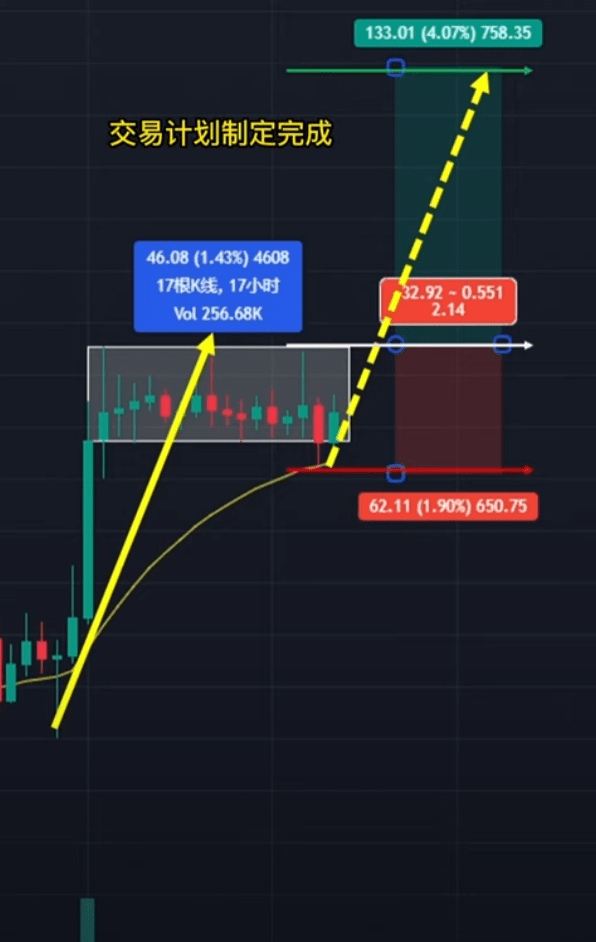
Then the price reaches the take profit level
Have you learned it?
I am Coach Panda who is good at making complex issues simpler.
If you don’t understand anything in the article, please leave a message in the comment section.
Don’t forget to like and follow.