
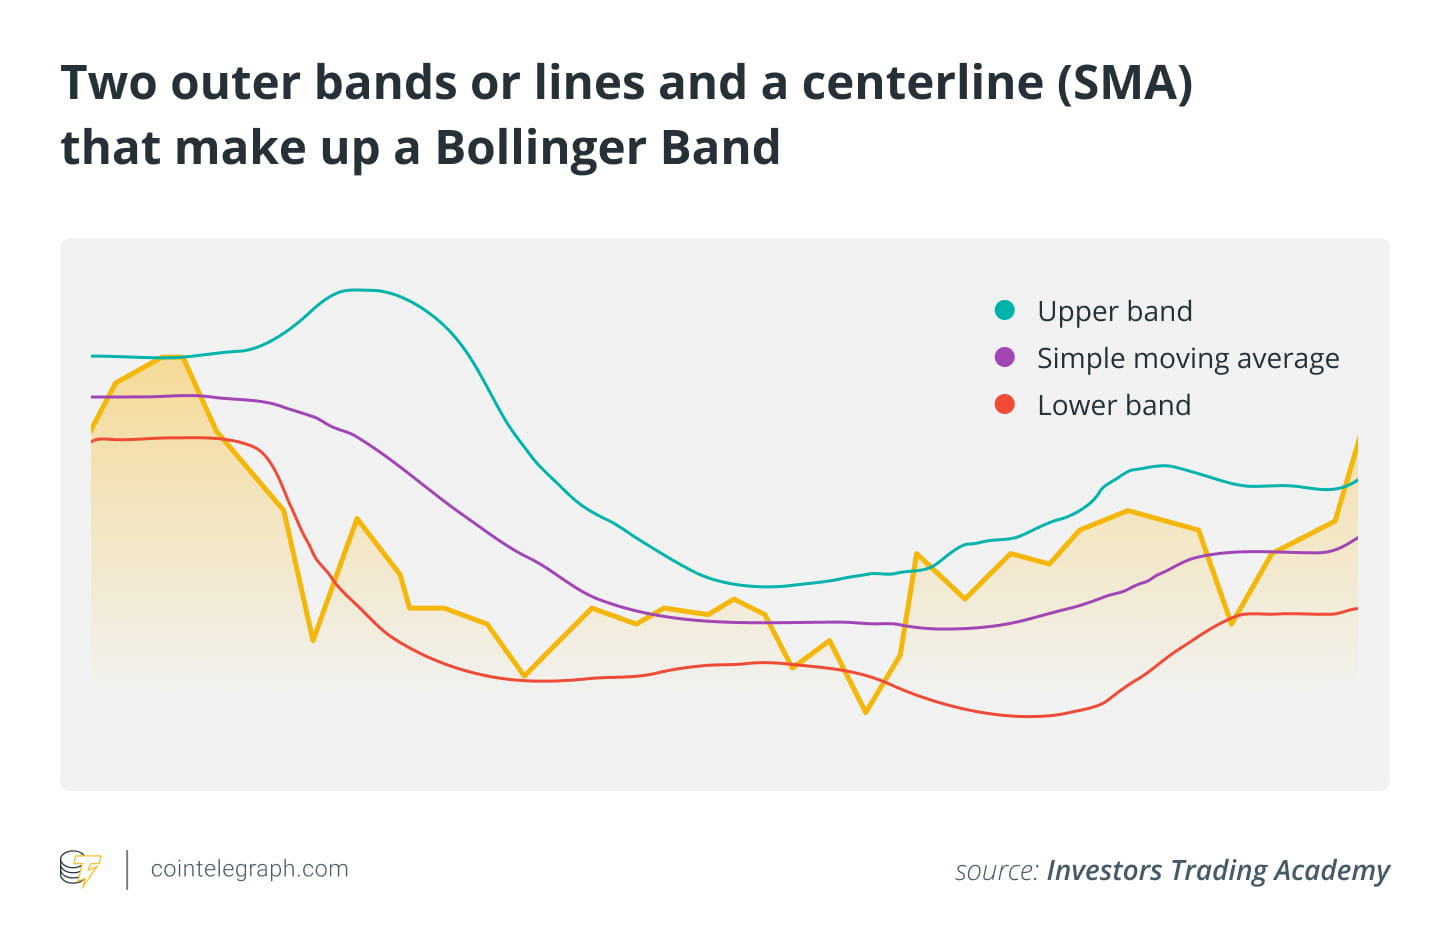
Bollinger Bands are volatility indicators that utilize price bands. Traders buy near the lower band and sell near the upper band. A technical analysis tool called Bollinger Bands utilizes price volatility to provide possible entry and exit opportunities in a trade. They consist of two outer bands or lines and a center line (a simple moving average of a 20-day period) that expands and contracts based on price changes. They are often used in conjunction with other technical indicators for a thorough market analysis.
Bollinger Bands Explained
Bollinger Bands were created by John Bollinger in the 1980s. They are a useful technical analysis tool in cryptocurrency trading and other financial markets to assess price volatility, pinpoint possible reversal points, and make trading decisions.
The three bands that help construct the Bollinger Bands include:
Upper belt
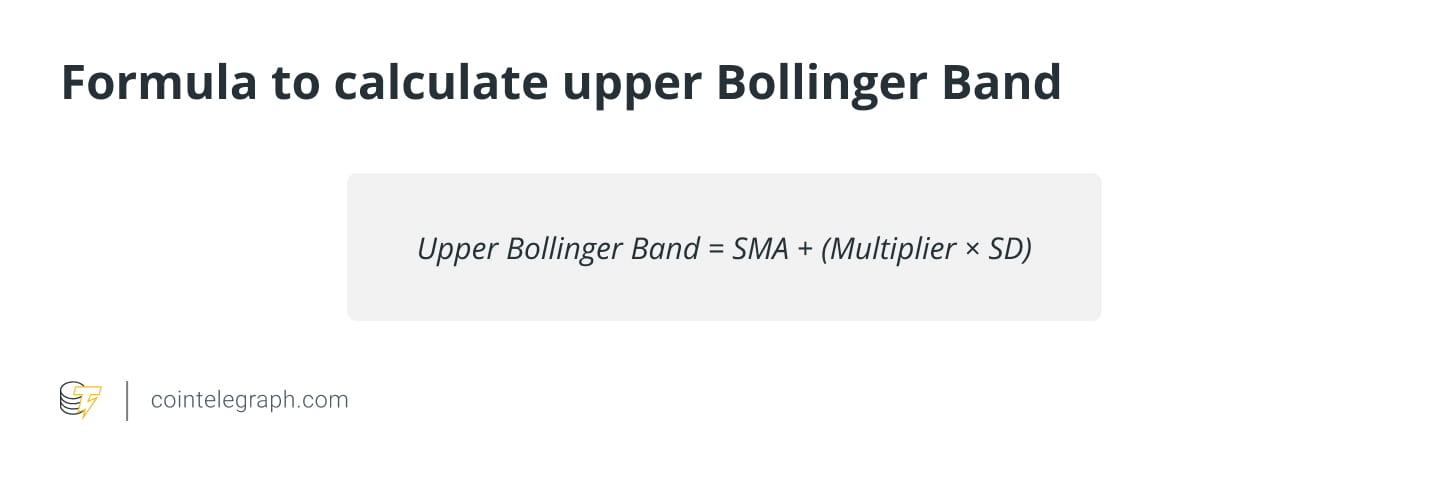
The upper band is created by multiplying the middle band by the standard deviation of the price. The volatility of the price is quantified by the standard deviation. Traders often use a multiplier of 2 for the standard deviation (SD), but this can be changed based on market conditions and personal preference.
 Middle Band (SMA)
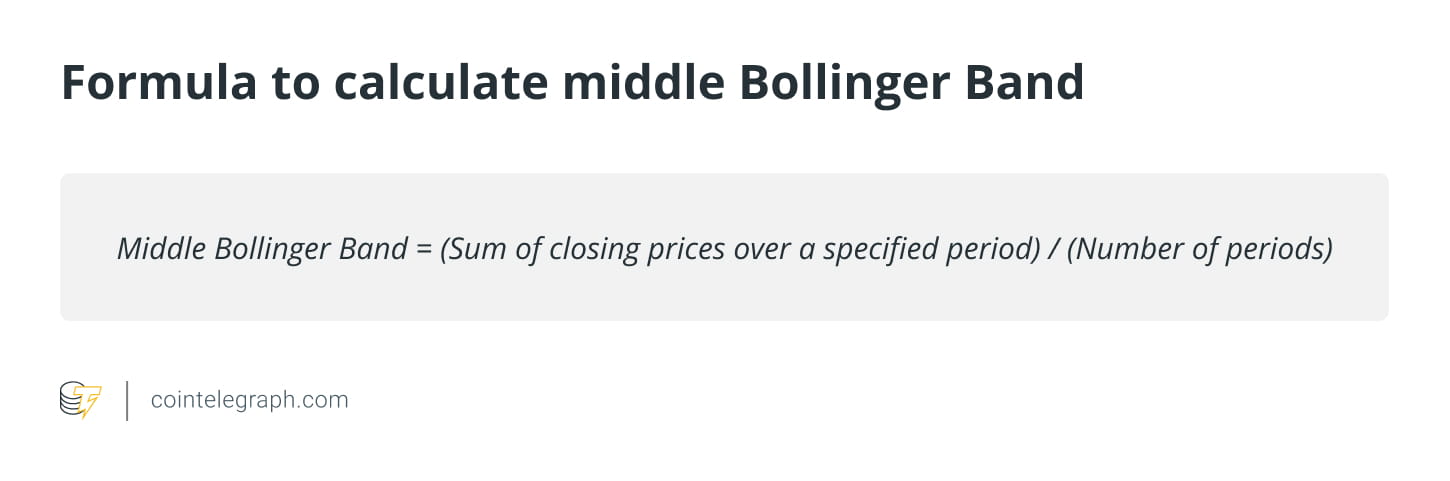
The middle band usually represents the price of an asset over a given period in the form of a simple moving average (SMA). It serves as an axis and depicts the average price of a cryptocurrency over the selected timeframe.
Lower belt
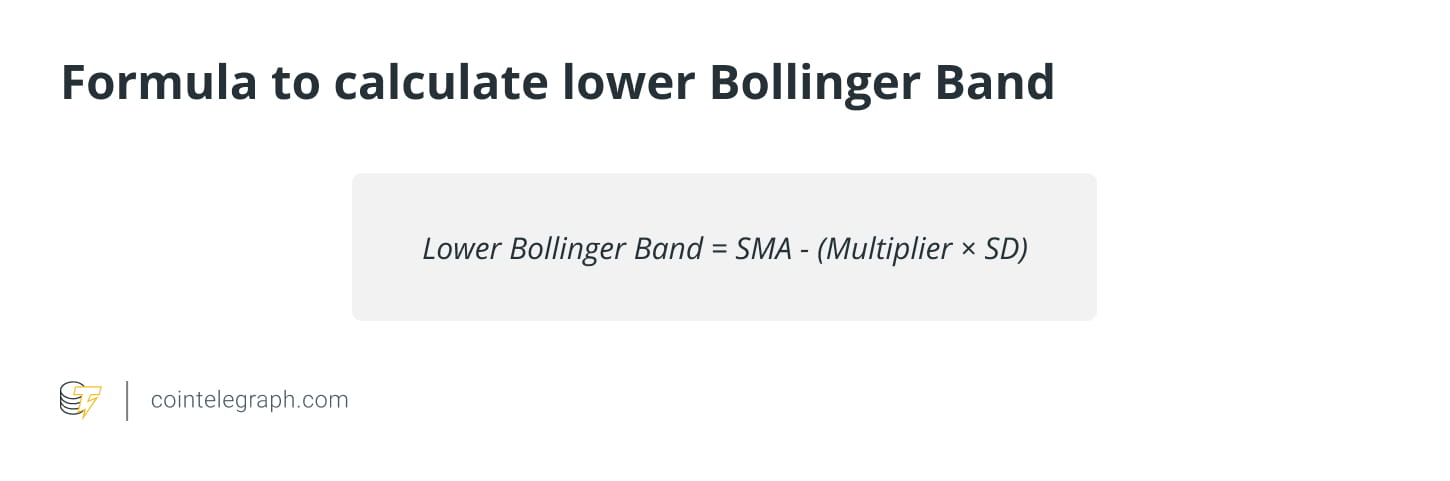
Subtract multiples of the standard deviation from the middle band to determine the lower band.
Uses of Bollinger Bands in Cryptocurrency Trading
In cryptocurrency trading, Bollinger Bands are an important technical analysis technique that enables traders to:
Assessing price fluctuations
Traders can use Bollinger Bands to assess the degree of price volatility in the cryptocurrency market. When the range widens, there may be potential for trading as it indicates higher volatility. On the other hand, a narrowing band indicates less volatility and the possibility of price consolidation or a trend reversal.
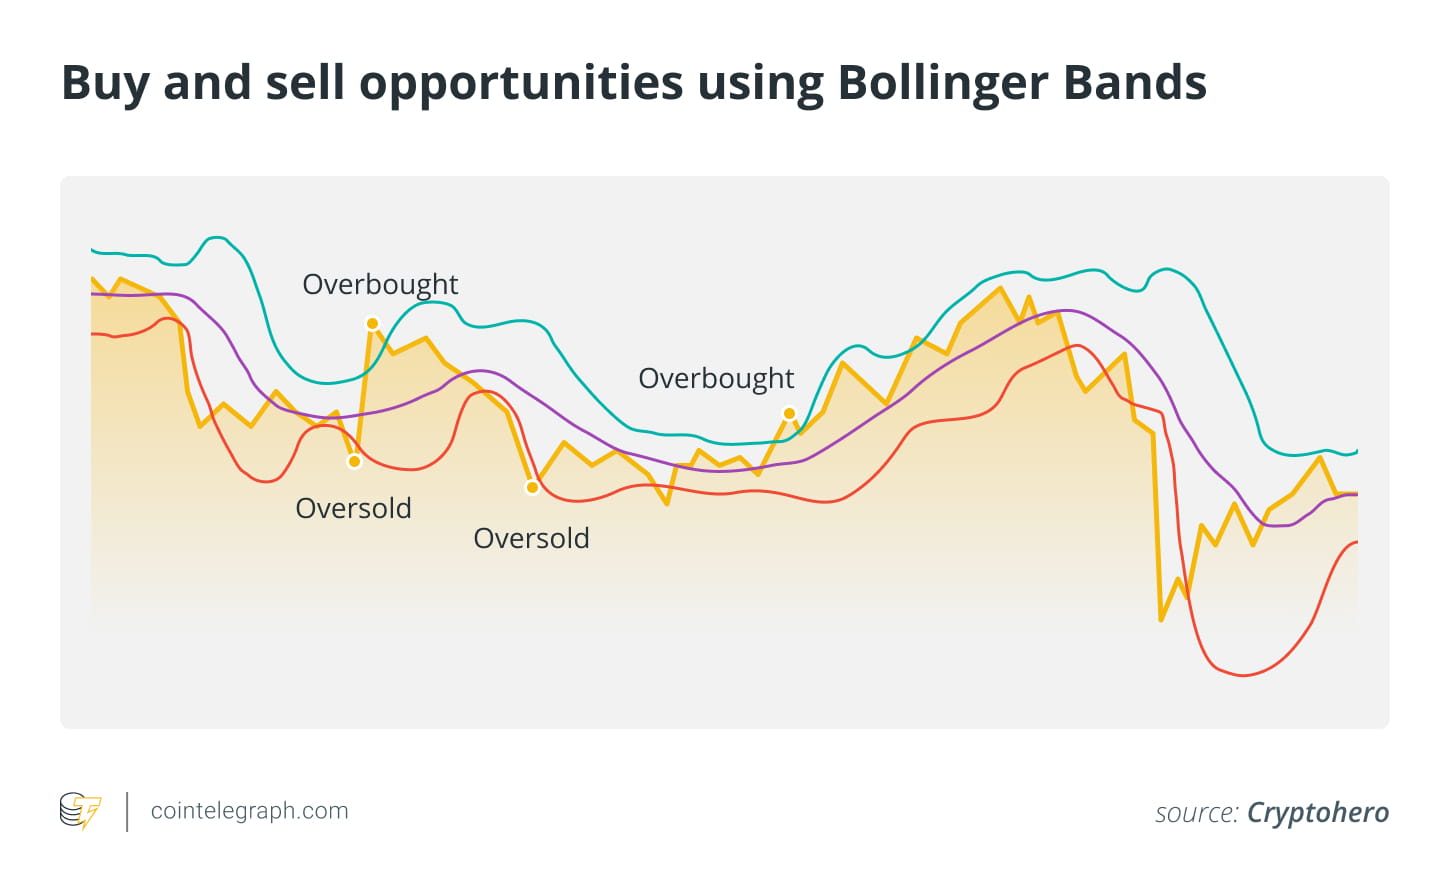
Identifying overbought and oversold conditions
Bollinger Bands are used to detect possible overbought and oversold conditions, helping traders identify them. A potential selling opportunity occurs when the price reaches or exceeds the upper band, which is a sign that the price is overbought. On the other hand, if the price reaches or falls below the lower band, it can be considered oversold, indicating a potential buying opportunity.
Determine trend direction
Traders can use Bollinger Bands to determine the current trend direction. If the price continues to move along the top channel, it may indicate an uptrend. On the other hand, if it frequently touches or remains close to the lower band, it may be a sign of a downtrend.
Generates a reverse signal
Bollinger Bands can be used to create reversal signals, which are indicators of a possible trend reversal. For example, when price moves out of the bands and then re-enters (below the lower band in a downtrend or above the upper band in an uptrend), it can indicate a possible reversal from an overextended state.
How are Bollinger Bands constructed?
Simple Moving Average and Standard Deviation are two basic components of Bollinger Bands and are used in their construction. These bands provide insightful information about the price volatility and possible trading opportunities in the cryptocurrency market.
Here is a step-by-step guide to constructing Bollinger Bands:
Step 1: Calculate SMA
Depending on their trading technique, traders select a specific timeframe for analysis, such as daily, hourly, or other timeframes. Within the selected timeframe, previous closing prices of the cryptocurrency being examined are collected. The closing price is often used since it represents the last traded price at the end of each time period. The SMA is calculated by adding up the closing prices for the selected time period and then dividing the total by the number of data points. For example, if a trader examines the daily closing prices of a cryptocurrency over a 20-day period, they would add up the closing prices of the previous 20 days, divide by 20, and then find the SMA for that day.
Step 2: Calculate SD
After calculating the SMA, traders determine the standard deviation of closing prices over the same time period. Standard deviation is crucial in assessing price volatility in the cryptocurrency market, as it quantifies the dispersion or variability of the SMA price.
Step 3: Construct the upper and lower Bollinger Bands
The upper Bollinger Band is derived by multiplying the SMA by the standard deviation. The typical multiplier is 2, although (as mentioned above) this can be changed based on trader preference and market conditions. Subtracting the same multiple of the SD from the SMA gives the lower Bollinger Band.
Step 4: Draw Bollinger Bands on the Price Chart
Traders can plot the SMA, standard deviation, upper Bollinger Band, and lower Bollinger Band on a price chart after calculation. The centerline of the Bollinger Bands and moving averages is represented by the median line. Plotting the upper and lower bands above and below the SMA creates a channel around the price chart.
Step 5: Explanation
To understand how to trade cryptocurrencies with Bollinger Bands, it is crucial to interpret price signals. For example, when the price reaches or moves outside of the upper band, it may signal overbought conditions and a selling opportunity.
On the other hand, if the price touches or swings beyond the lower band, it could indicate an oversold market with a potential buying opportunity. The width of the bands provides information about market volatility; wider bands indicate higher volatility, while narrower bands indicate lower volatility.
Cryptocurrency trading strategy with Bollinger Bands
The various cryptocurrency trading strategies that traders use that utilize Bollinger Bands include:
Bollinger Band Squeeze Strategy for Cryptocurrencies
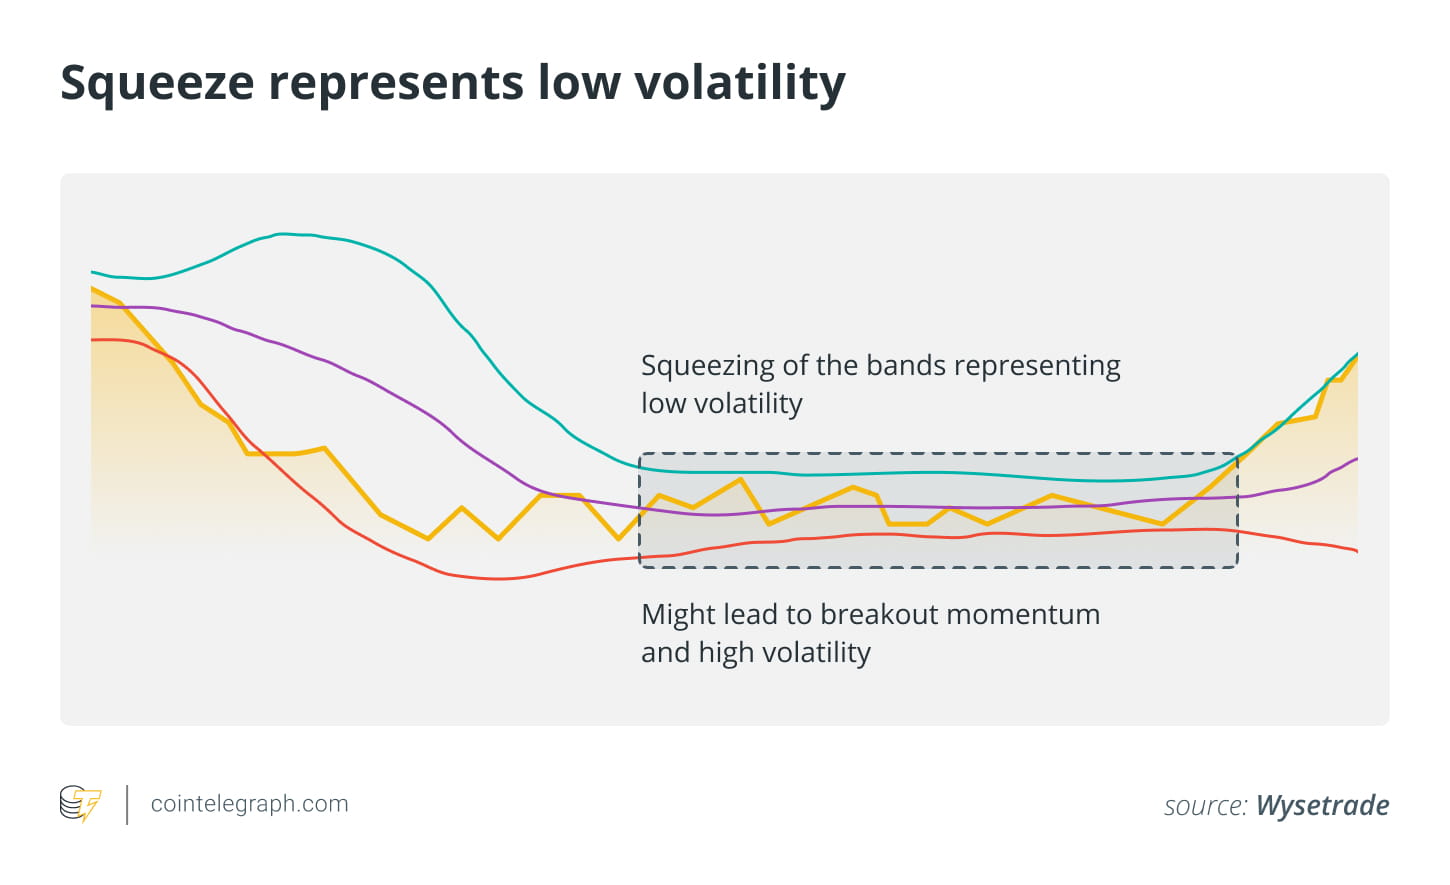
The Bollinger Band Squeeze method is based on the idea that periods of low volatility in cryptocurrency prices (called “squeezes”) are often followed by periods of high volatility (called “expansions”). Here’s how it works:
Look for the squeeze: Watch for times when the Bollinger Bands narrow and move closer together, which is a sign of decreasing price volatility.
Be prepared for a breakout: After a squeeze, traders anticipate a strong move in price. They cannot foresee the direction of the breakout, but they do prepare for it.
Entry point: Traders enter a position after the price breaks out of the Bollinger Bands (above the upper Bollinger Band for upside and below the lower Bollinger Band for downside), often using additional confirmation indicators such as volume.
Stop Loss and Take Profit: Implement a stop loss order to limit potential losses if the breakout fails to hold, and set a take profit level based on your trading strategy.
Bollinger Bands for setting entry and exit points in cryptocurrency trading
When trading cryptocurrencies, whether for short-term investing or day trading, you can use Bollinger Bands to find the best entry and exit points.
Entry Point
When prices reach or break below the lower Bollinger Band, it indicates oversold conditions and traders may look for buy signals. Conversely, when prices reach or exceed the upper Bollinger Band, they view overbought conditions as sell signals. However, more technical investigation and verification may be necessary.
Exit Point
Traders can use Bollinger Bands to determine when to close a position. For example, if a trader is long a cryptocurrency and the price is near the upper band, this could be a sign of profit taking. Conversely, if short and the price is near the lower band, it could be time to close the position.
Combining Bollinger Bands with other trading indicators
Traders often use Bollinger Bands along with other indicators to complement their trading strategies.
Bollinger Bands and RSI
Combining the Bollinger Bands and the Relative Strength Index (RSI) may help traders spot possible reversals. For example, if the price approaches the upper Bollinger Band and the RSI shows overbought conditions, it could indicate a possible plunge.
Volume Analysis
Bollinger Bands and volume analysis can be used to confirm price action. An increase in volume during a Bollinger Band breakout may strengthen the signal’s validity.
Bollinger Bands and Moving Averages
Traders use moving averages in conjunction with Bollinger Bands to add more context to trend analysis. For example, the Bollinger Bands and moving average crossover method can support the confirmation of a trend change.
Bollinger Bands Limitations for Cryptocurrency Traders
Bollinger Bands are a useful tool for cryptocurrency traders, but they do have some disadvantages. First, they can generate false signals when volatility is minimal or when the market is volatile, which can lead to losses. Second, traders must utilize other indicators or analysis techniques to confirm trend direction, as they do not provide directional information on their own.
The effectiveness of Bollinger Bands may also vary across different cryptocurrencies and time frames. Additionally, unexpected market news or events may cause price gaps that are not necessarily reflected in the ranges, which can catch traders off guard.
Risk Management Strategies When Using Bollinger Bands
As with any technical indicator, cryptocurrency traders must use Bollinger Bands in conjunction with thorough risk management and analysis. To reduce the potential losses that may occur if a trade goes against them, traders should set clear stop-loss orders.
Position sizing is also important; traders should also allocate a certain amount of cash to each trade to avoid overexposure. In addition, risk can be reduced through diversification across different cryptocurrencies and limiting the percentage of total capital that can be lost in a single trade.
Finally, Bollinger Bands should always be used in conjunction with other indicators and larger market patterns for confirmation. Long-term success with Bollinger Bands depends on maintaining discipline and following a clear risk management strategy.