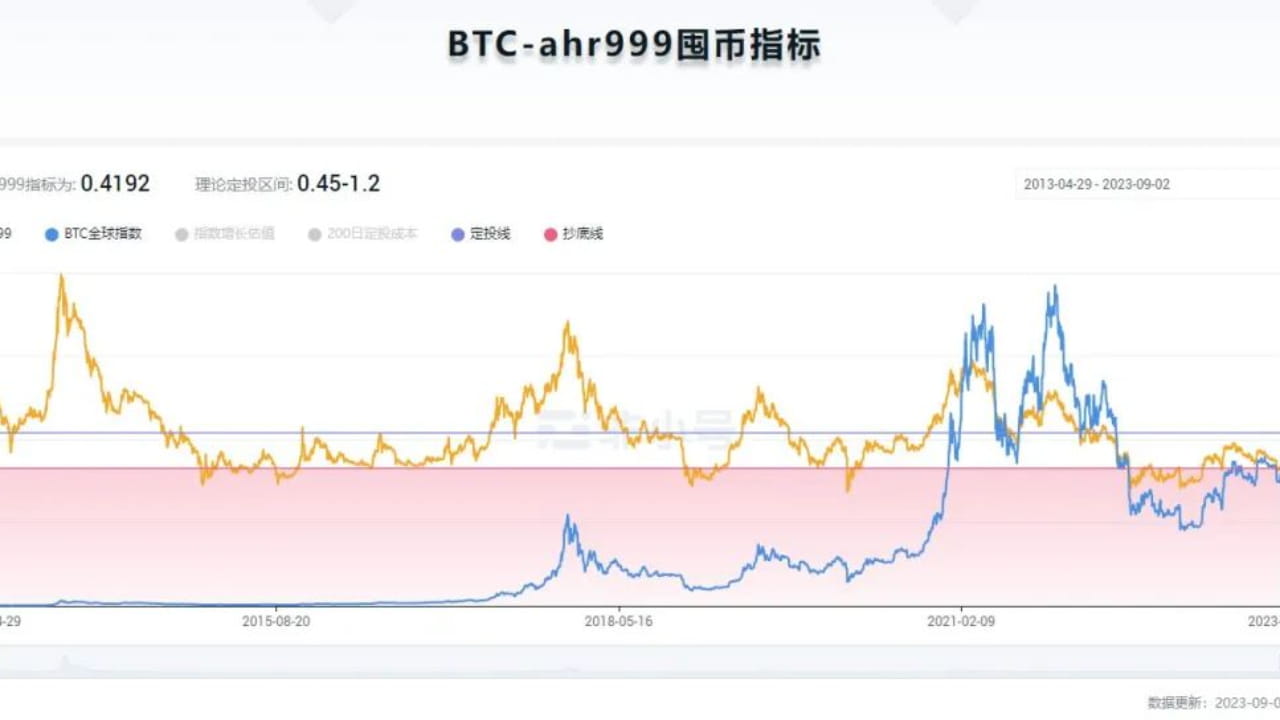

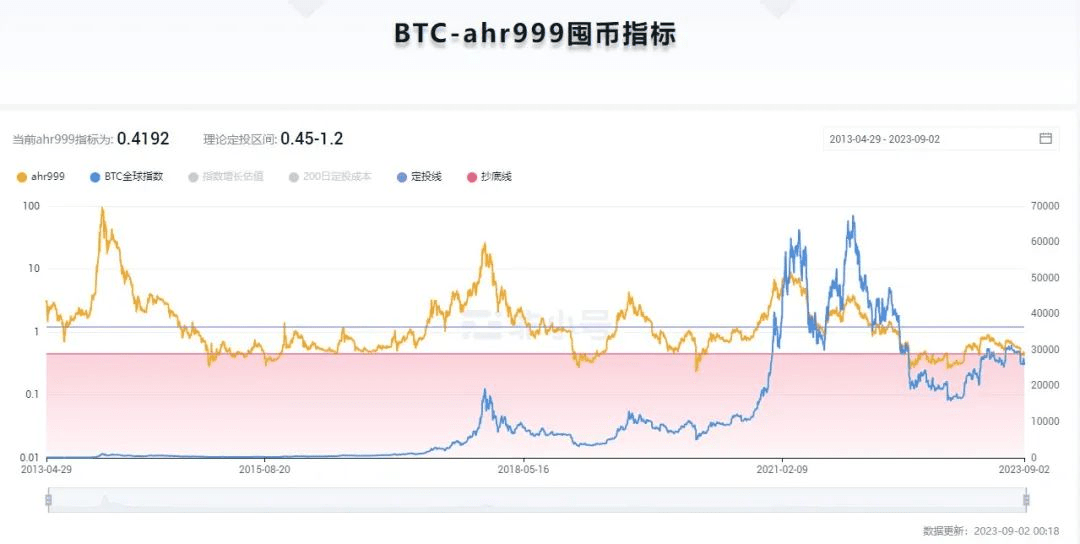
I believe friends who have hoarded coins should know a hoarding indicator ahr999.
This is a quantitative indicator invented by the author of the "Hoarding Bitcoin" booklet known as the 9 God to evaluate whether the price of Bitcoin is undervalued.
Qualitatively, this indicator combines two parameters. One is the ratio of Bitcoin price to the cost of a 200-day fixed investment, which measures whether the current purchase price is more cost-effective than the average cost of a 200-day fixed investment. The other is the ratio of Bitcoin price to exponential growth forecasts, which measures the gap between Bitcoin’s current price and expected growth.
The ahr999 indicator directly multiplies two ratios to simplify the complexity of the indicator. But this multiplication does not make sense. After multiplication, the numerator becomes the square of the Bitcoin price, and the denominator becomes the product of the 200-day investment cost (lower bound) and the exponential growth forecast (upper bound).
Then, the indicators were proposed after the 2018 cycle, so the parameters were determined based on data fitting from the previous eight years. The first is exponential growth fitting, using price-time logarithmic coordinates (this is similar to the logarithmic corridor model), and the resulting fitting function is price = 10 ^ (5.84 x log(coin age) - 17.01) . Then there is the statistics of the historical price range. 8.5% of the time the index is less than 0.45, which is defined as the bottom-buying range; 46.3% of the time it is between 0.45 and 1.2, which is defined as the fixed investment range; 29.3% of the time, it is between 1.2 and 5. This is the stop investment waiting interval. The sum of these three ratios is only 84.1%, and the remaining 15.9% of the time exceeds 5.
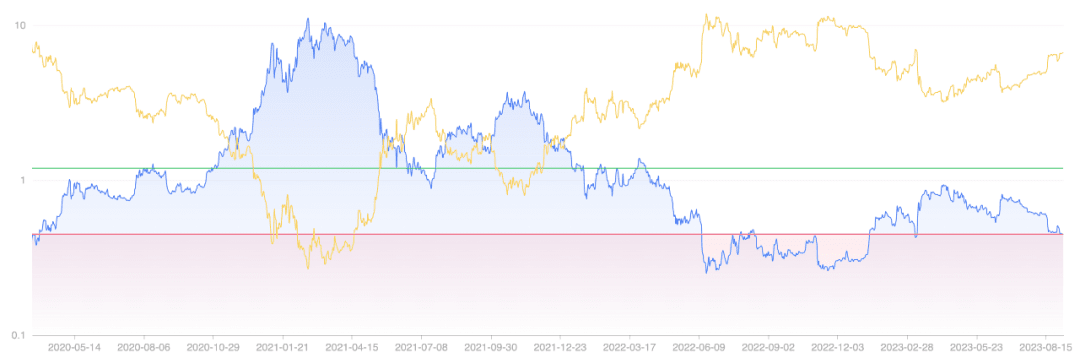
Let’s briefly look back at the performance of this indicator in the past bull market (2020-2022): it broke through the fixed investment line 1.2 on October 27, 2020, and the price was about 13,000 dollars. On July 5, 2021, it fell below the fixed investment line of 1.2, and the price was about 35,000 U.S. dollars; on July 28, 2021, it broke through the fixed investment line of 1.2, and the price was about 40,000 U.S. dollars. In fact, the short period of falling below the fixed investment line in just one month can be ignored, because even if you add positions every week, you can't add them a few times. Then on January 19, 2022, it fell below the fixed investment line of 1.2, and the price was about $42,000. It has been below the fixed investment line so far (ignoring the short-term piercing of the fixed investment line from January to April).
Among them, on June 13, 2022, it fell below the bottom line of 0.45, and the price was about 23,000 U.S. dollars; on January 16, 2023, it exceeded the bottom line of 0.45, and the price was about 21,000 U.S. dollars.
It can be seen that after the investment stop of 13,000 dollars in October 2020, the price obtained by entering the adding range again is higher than 13,000 dollars. Even during the bottom-buying range window from June 13, 2022 to January 16, 2023, Bitcoin was always above $15,000 and never returned below $13,000.
This also means that if the funds you had before the investment was stopped, you can only buy fewer Bitcoins if you re-enter it at any time after the investment is stopped. After about November 2020, Bitcoin quickly exceeded 15,000 U.S. dollars. Then new funds after that, stop investing and wait until it returns to 15,000 U.S. dollars at the end of 2022 to reinvest, which may be more profitable than investing above 15,000 U.S. dollars. good.
Another cycle has passed, and it may be necessary to conduct new regression tests on the indicators.