
Read this article carefully and you will have surpassed 90% of the people in the currency circle.
an excellent blocker
Start from receiving the task
You need to start making a comprehensive plan
For example
How to choose a sniper position
Understand the target task's habits and its behavior
What equipment do you need
Your entry route
your escape route
You need to observe your surroundings
Disguises that will be used
And you have to wait patiently for the target to enter your shooting range
。。。
Thus achieving precise hunting!
The same goes for a good trader
The most important of these
Just find your sniper position
That is, how to accurately find the main support pressure level?
This article brings together my many years of trading experience
Although very long
But the value is huge
Friends who want to seriously learn technology
I strongly recommend that you read it carefully
You will definitely feel like you have found a treasure
after all
There are many courses on the market that charge over 10,000 yuan
That's all it's about
Next
I will use 6 parts to explain today's topic
1: The difference between general support pressure level and main support pressure level
2: The role of the main support pressure level
Three: 5 secrets to identify the main support pressure levels
Four: 5 mistakes in finding major support pressure levels and how to avoid them
Five: Take you to the real market to find the main support and pressure levels
Six: How to deal with the market reaction after the main support and pressure level: trend turning, breakthrough and sideways shock
are you ready?
let's start!
The difference between general support pressure level and main support pressure level 1
I dare say
At present, 90% of people in the trading market
They don’t know how to find support and pressure levels.
And the remaining 10% of people
Another 80% of people
The support and pressure levels found are wrong
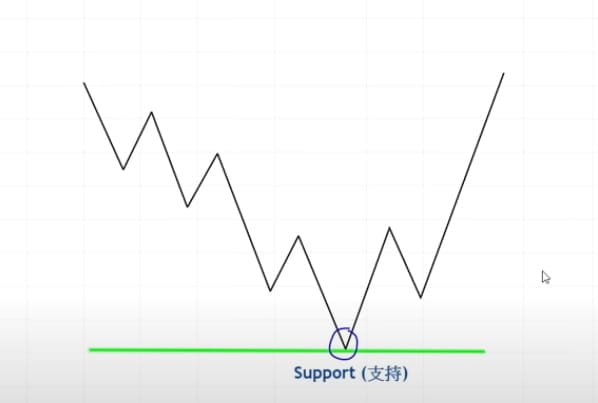
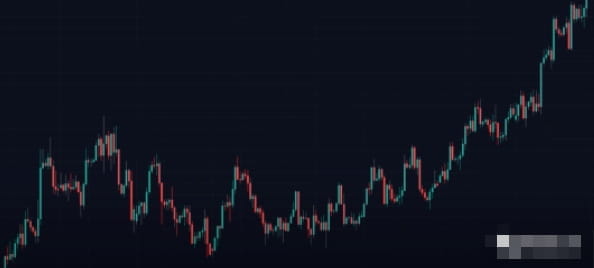
mentioned support level
Ordinary people
think of it as a floor
When the price falls to a certain level
A force in the opposite direction begins to appear
Price momentum continues to decline
Start walking in the opposite direction
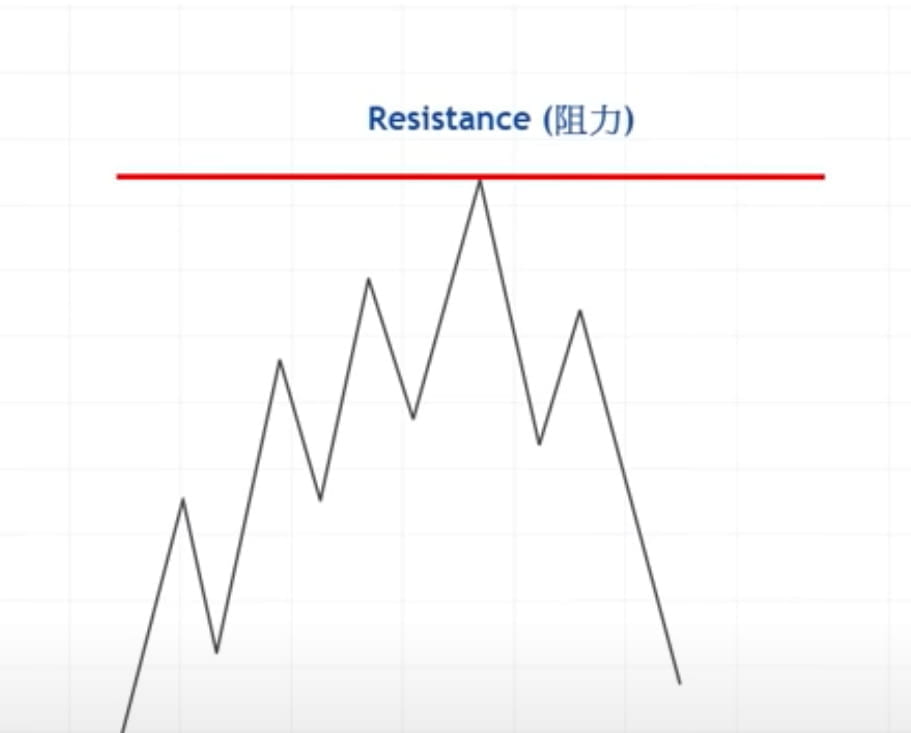
The same reason
The pressure level is
When the price rises to a certain position
A force in the opposite direction appears
The upward momentum for prices weakens
Even turn around and run
You can think of the pressure level as a ceiling
It prevents market prices from continuing to rise
The above is our understanding of the support pressure level
Isn’t this concept very simple?
If you think so too
congratulations
You are one of the 80%
The two situations listed above
It happens countless times every day on the disk
If we only start from the price line once or twice without breaking a certain support or pressure level,
If you enter easily
There is a high chance that we will learn a painful lesson
Because you don’t know what this position means to the market
Is it a truly meaningful position?
Or some randomly generated noise
So at this time we need some more advanced techniques
That is the main support and pressure level
to help us filter
to avoid confusion
Next, I will explain the main support and pressure levels that I will explain in this article.
Referred to as "key bits"
In English it is called: Keylevel
Key positions are really sensitive places in the market
The market has taken a stance on this
also made a significant response to it
It has also been price rejected many times
It may have been an enemy of the market yesterday
Become a friend of the market today
The key position is like a magnet
There is an invisible attraction that makes you want to try to get closer to this location
If the market approaches this position again
We can detect it accurately
We will have a reasonable prediction for the future
That is, prices will react to a certain extent again
So this is our opportunity to enter and make money.
The main function of supporting pressure level 2
Then learn to find the exact key positions
What practical effect does it have?
What practical help does it have for us in our transactions?
we all understand
There are two things that most traders do wrong
It is also the biggest fatal mistake
The first is random entry into the market without a plan
The second is to chase the rise and kill the fall
I will use a story to explain the above two points each.
First
Entering the market at a certain position unplanned and randomly
Just imagine a
if you are a blocker
From the moment you receive the assignment, you need to make a comprehensive plan
For example, choosing a sniper position
Understand the target person’s habits and behavior
What equipment do you need
Your entry route
your escape route
You need to observe your surroundings
The disguise you will use
And you have to wait patiently for the target to enter your range
The same goes for trading
every successful trader
Have a comprehensive plan before every transaction
Instead of entering aimlessly and randomly
The key position is an excellent deployment blocking point.
Because usually the market will make a very significant reaction at the key position.
This is where you have the greatest chance of catching the next big trend in the market.
All you have to do is create your trading plan here
Formulate a series of ifs:
If prices do come back here...
If the price shows a turning Yin and Yang line pattern here...
If price forms a double top pattern here...
If there is enough profit margin from the next key level...
If the price goes there
I'm going to stop profiting!
If the price is wrong
If you come here
Then I have to cut my losses
When you make the above plan before every transaction
Cooperate well with key positions
This first-class strategically located
Your chances of success will naturally be greater!
the second
Just chasing the rise and killing the fall
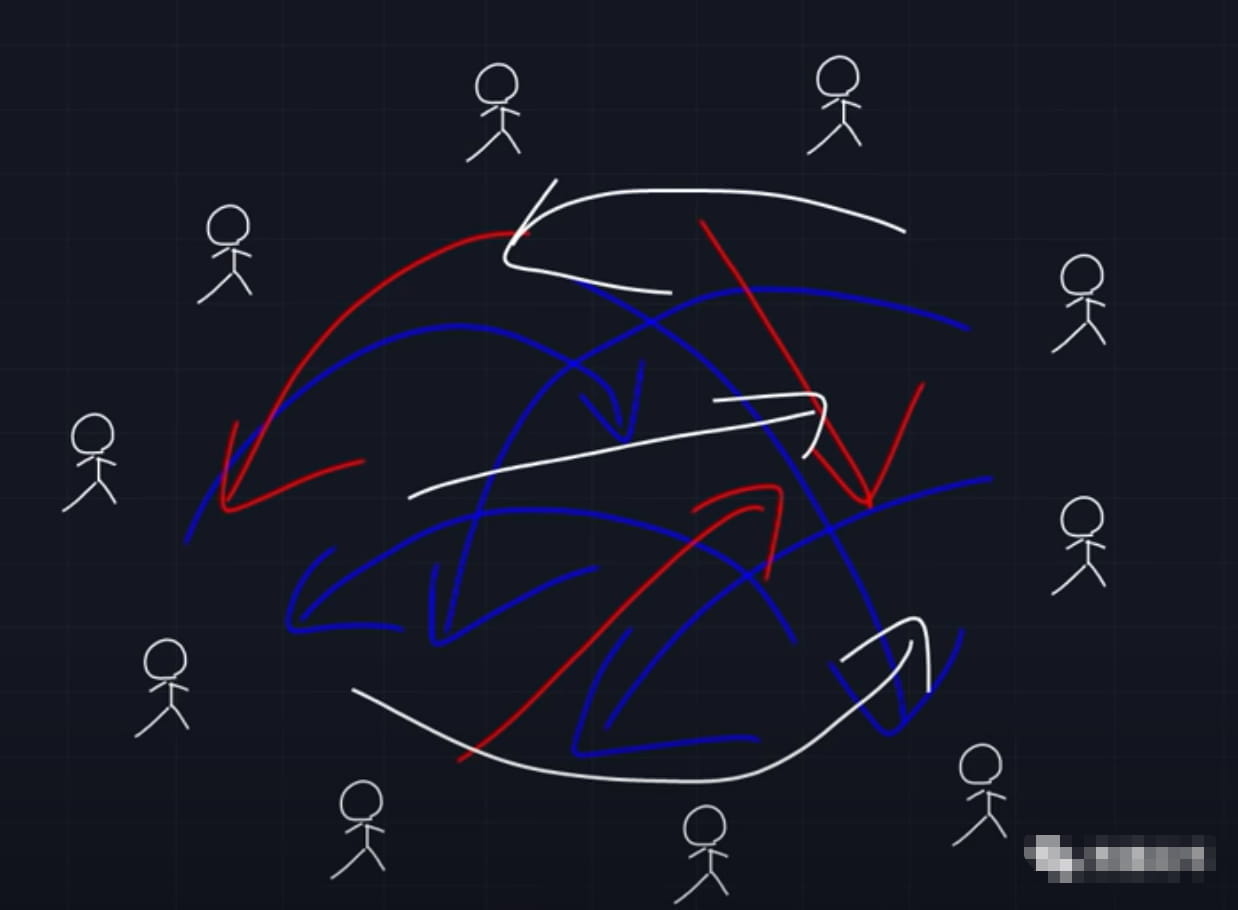
I don’t know if you have ever played the game monkey grab the ball.
The rules of monkey grabbing the ball are very simple
Just one person playing the role of a monkey
The others surrounded the monkey and kept passing the ball.
at this time
The monkey will keep running around
to grab the ball
。。。
played this game
Friends who have been monkeys should know very well
Every time you run up to the ball
The ball was suddenly passed to the other side again
Then you have to run there again
in the trading market
If you are chasing the currency price aimlessly
In fact, you are playing the role of a monkey
Every time you see prices have gone up
Once you have it, you feel like you can’t miss it.
Rush to enter immediately
But when you enter
The ball has been passed to someone else
That is after you hit your stop loss
Then continue walking in the opposite direction
this situation
I believe many friends have encountered it
you will feel discouraged
As if I can never win this game
To get out of this predicament
The only solution is to let go of your excitement
And the plan to chase that ball run.
In conjunction with the sniper example I just mentioned,
Develop a trading plan
Change from chasing the market to waiting for the market to fall into your trap.
Take action only when you see the opportunity
This way the chance of grabbing the ball will naturally be greater.
So another meaning of "key position" is
We no longer need to chase prices
But deploy your strategy
Waiting for the price to come back again
Find an entry signal with a high winning rate
when you keep doing it over and over again
Paired with proper risk management and the right trading mindset
I believe
You will be more successful than 90% of people in the market
5 secrets to identify key bits 3
So how can we correctly identify the "key positions" in the K-line chart?
Remember the following 5 conditions
The more contacts the better
Had a strong reaction
Very clear and easy to see at a glance
been rejected many times
Act as support level and pressure level at the same time
The above 5 conditions
It is not necessary to satisfy all of them to be called a key position.
But the more satisfied you are
It means that the position is more powerful and effective.
Next
I will break down the above 5 points step by step.
The more contacts the better
Prove whether a certain price is a key level
There is a very simple way
It is the number of market contacts
in our daily life
When you find a situation that keeps happening over and over again
Once or twice you may think it's just a coincidence
But when this happened for the third or fourth time
Do you think this is suspicious?
It seems that this thing has some purpose and happened for a reason.
same location
In different times
The price has never reached this level several times.
Have encountered resistance or support at this position
We will doubt something
It is this position for the market
Does it have any special significance?
So is this position a very critical position?
Is it a high or low this year?
In conclusion
A position has reacted to the price line once or twice
Maybe it's really just a coincidence
But when this happens more often,
The probability that it is a key position will be much greater.
Had a strong reaction
We know history repeats itself
If the price passes a certain position
I haven’t had a strong reaction
So how can we have a reasonable expectation?
What about expecting price to react significantly again at the same level in the future?
The market is actually just like humans
They all have memories
But we usually only remember some things that are more impressive
for example
I will remember that day when BTC fell 5,000 points
but
I won’t remember the day ETH went up 50 points
Everything is based on a concept
Just a reasonable expectation
When the market returns to a position where it once rose or plummeted
We have a reasonable doubt that price history will repeat itself
Make a significant reaction again in the same position
And that big response is our profit margin
And in this position
In fact, many orders placed by investment institutions have already been laid in wait.
When the price returns to this key level again
There will be a chance to trigger their orders
As retail investors, we
If this position is temporarily consistent with the views of institutional investors,
The price will quickly move in the direction you want.
Stay away from your stop loss
Move towards your profit-taking goal
As the saying goes
"Follow the dealer, there will be a bull market every day"
This is also why I have been working in finance for many years.
One of the banker’s thoughts learned
Very clear and easy to see at a glance
A good key position
There is one condition: it must be very clear, definite, and easy to see at a glance.
If one day
When you open a chart
You find a position that looks like a key position
It doesn’t seem like it?
You see the price tried and experienced pressure there
or support
The price seems to have reacted
But it’s not too much of a reaction
I advise you to give up this position immediately!
immediately! immediately!
Because even if you can barely find a reason
Think of this as a key position
In fact, your confidence in this position has been affected unconsciously.
why?
Because when a trading signal actually appears
You will definitely have hesitation
Will largely affect your trading decisions
Even if you really enter the market
As long as the price line moves slightly in the opposite direction,
you will be scared
Even if there is a strong WeChat account
prompted you to make this transaction
You're probably going to be in this position because of self-doubt
And gave up the real key position too early
Make you leave early
Then you give up your original trading plan
This transaction will end in failure
Then you won’t be able to achieve the big principle of consistency.
What this market lacks the least is trading opportunities
There are over 200 currency pairs in the digital currency market that you can trade
There are different foreign exchange, futures, and securities products
I'm never afraid that you won't get a chance to enter the market.
What I fear most is not following my own trading plan
Entering the market reluctantly due to lack of confidence
Speaking of which
It also involves trading mentality
I will also compile some articles on trading psychology in the future.
I will give you a detailed explanation at that time
It allows you to effectively avoid losses
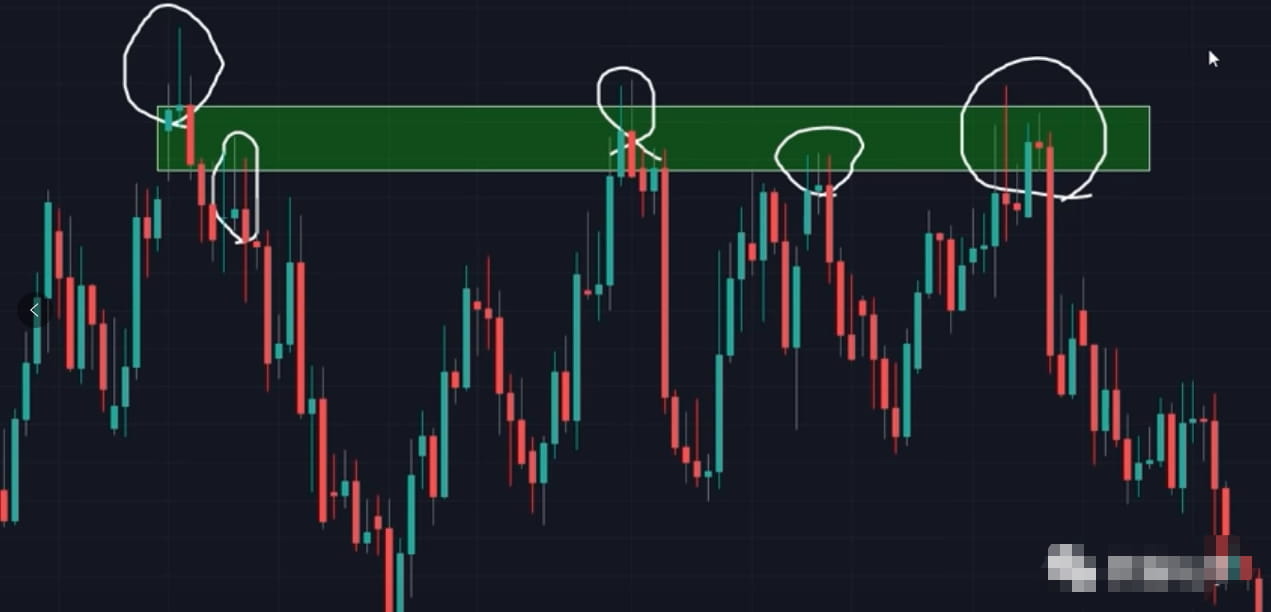
been rejected many times
When we were chasing girls
The most painful thing is not being rejected by the person you like
Instead, he was madly rejected by the person he liked.
。。。。。。
The same goes for finding key positions.
We need to find the pain points of the market
We would like to see a certain location
many times at different times
Or make a continuous rejection situation
Each time this reaction is repeated
We have one more chance to enter the market
simply put
You will see that the K line will be generated near this position
One or several consecutive long upper or lower leads
The price will move in the opposite direction every time it is rejected.
It means that the price has expressed to the market many times
It has risen or fallen many times
But they were all rejected by the market
Immediately pulled back by a force in the opposite direction
in this situation
It means that there is a strong force waiting for you in this position.
Whenever this happens
Especially when the daily price successfully breaks through this area
We all regard this as a powerful and effective key position
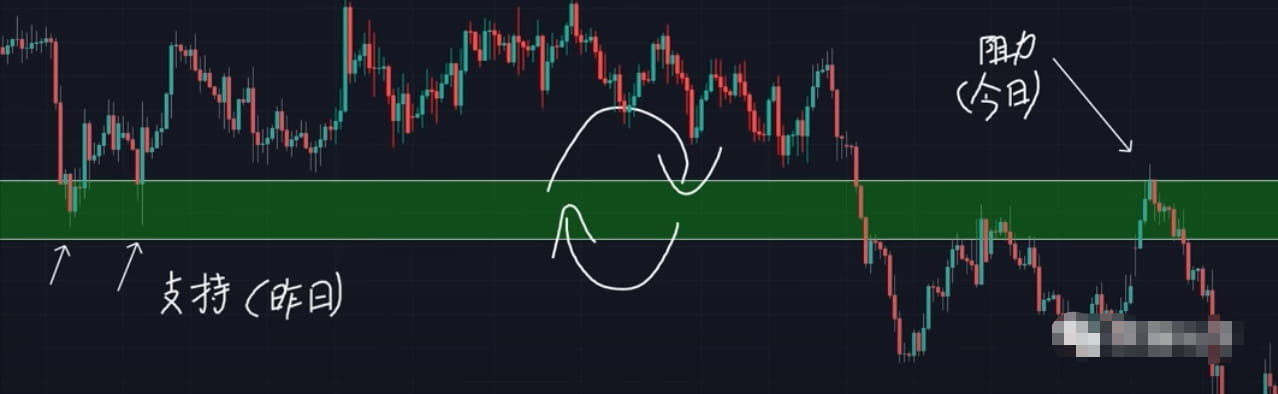
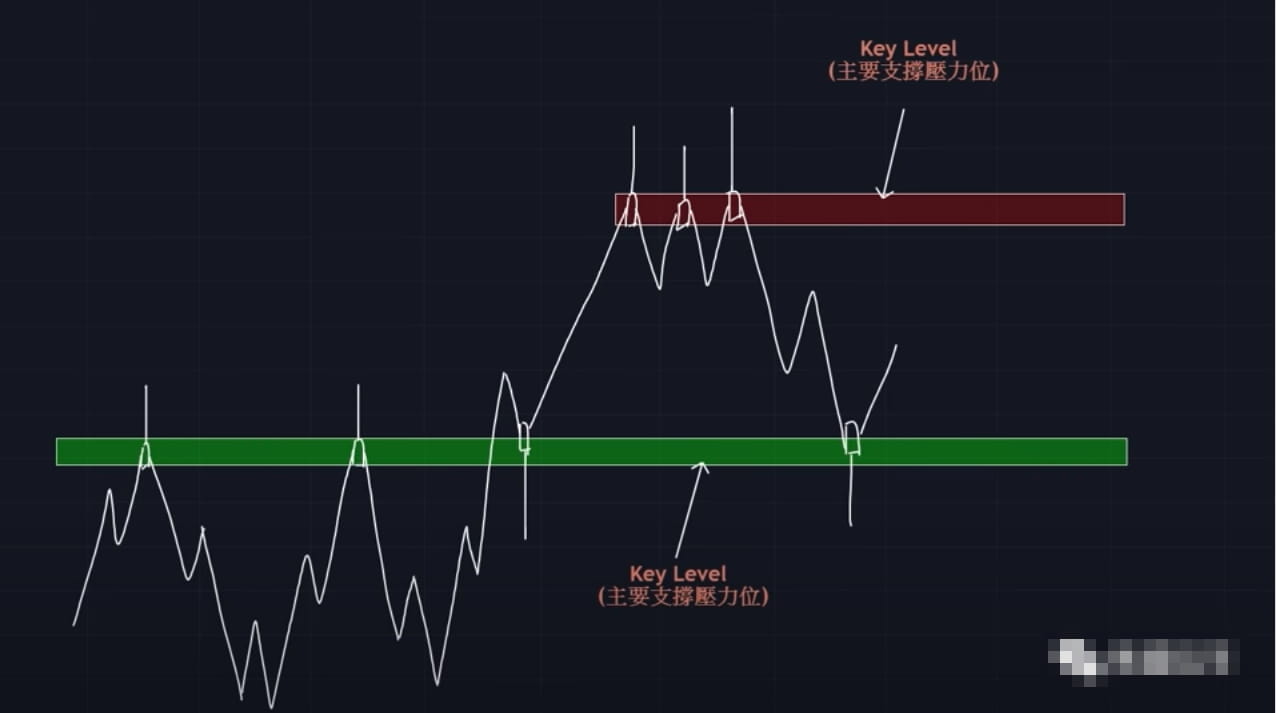
Performed support and pressure positions at the same time
In the world of trading
no permanent friends
There is no eternal enemy
A situation we would like to see
Yesterday’s support level becomes today’s pressure level
Or maybe yesterday’s pressure level becomes today’s support level?
Whenever prices break out of previous pressures
Many times, I will return to the same position and rebound again.
At this time, if the price is rejected
Then this means that yesterday’s pressure has turned into today’s support.
This situation also means that this position has considerable status in the world.
Both black and white will give him face
That is to say, both bulls and bears have held on to this position.
every time when we see a certain location
If you have done support and pressure levels at the same time
Then we can judge that it is a key position.
There's a high probability that you can't be wrong
After explaining the conditions of the 5 key bits
Next I will explain 5 things about application
A mistake that many coin enthusiasts make
And some practical tips for everyone
If you like what I say
Please give me a like at the bottom of the article
I will have updates in the near future with more on technical analysis
For example, search for articles such as technical indicators, yin and yang patterns, chart patterns, trading strategies, trading psychology, market analysis, etc.
5 examples of critical bit mistakes and how to avoid them
5 mistakes in finding key bits and how to avoid them
Too many lines drawn
Reckless entry
It's an area, not a line
The range is too large
Large cycle charts are more accurate
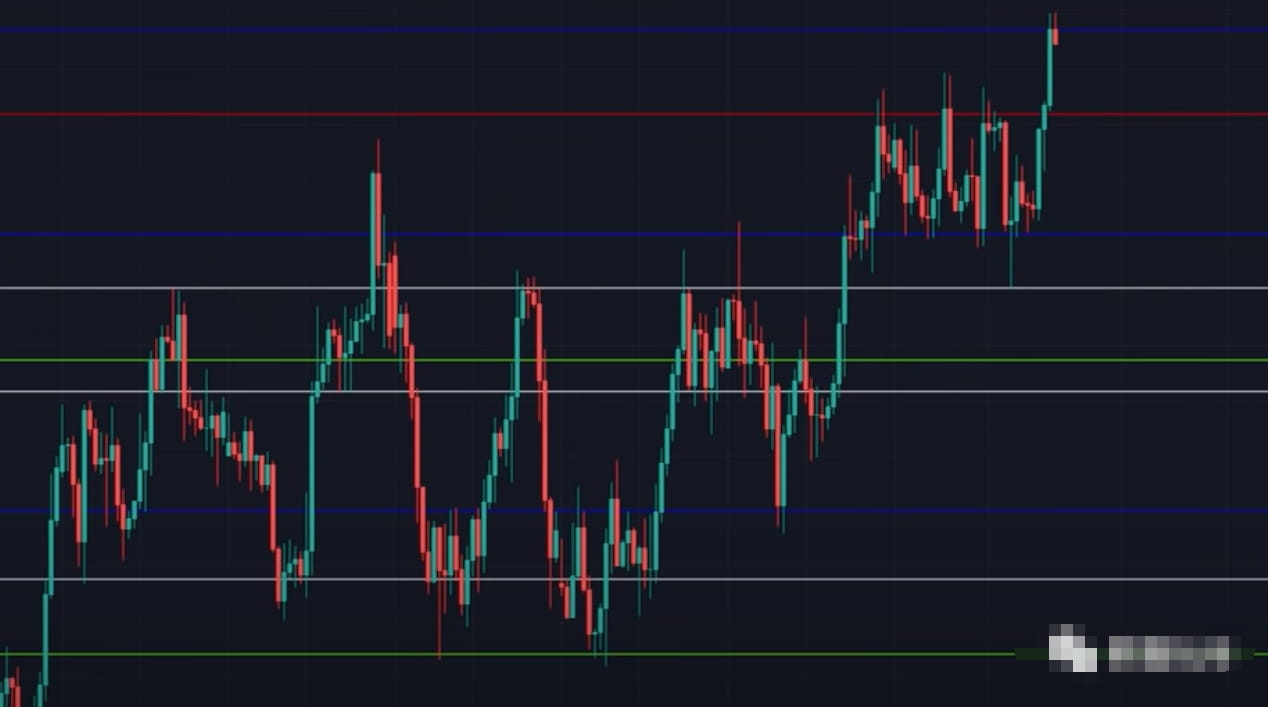
Too many lines drawn
In the application of finding key bits
The first common mistake
That is to draw a line for all the so-called support levels or pressure levels seen in the charts.
The more lines you draw
It does not mean that you will have more trading opportunities.
It doesn’t mean that you will make more money
Because many of the lines you draw are just market noise.
According to the five conditions just mentioned
Many of these are not qualified key positions.
If the chart is made like this
In the end it will only dazzle us
Influence our trading decisions
Everyone should know a principle
The basic point when we look at charts is to keep them simple and clear
Make sure we can clearly see the price action
The main thing we want to see is the price reaction
If there are too many things covering the K line
Words that distract us or cause us to hesitate
Definitely putting the cart before the horse
So we only need to focus on the most obvious and important
And the nearest major support level and pressure level is enough.
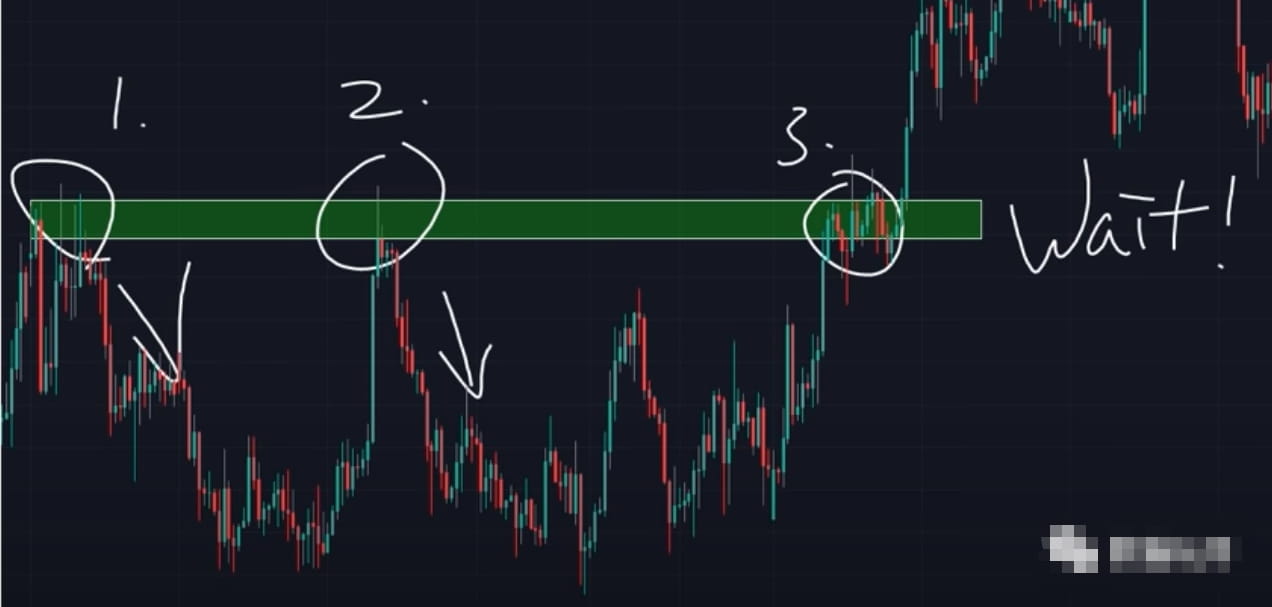
Reckless entry
The second point is to enter the market recklessly.
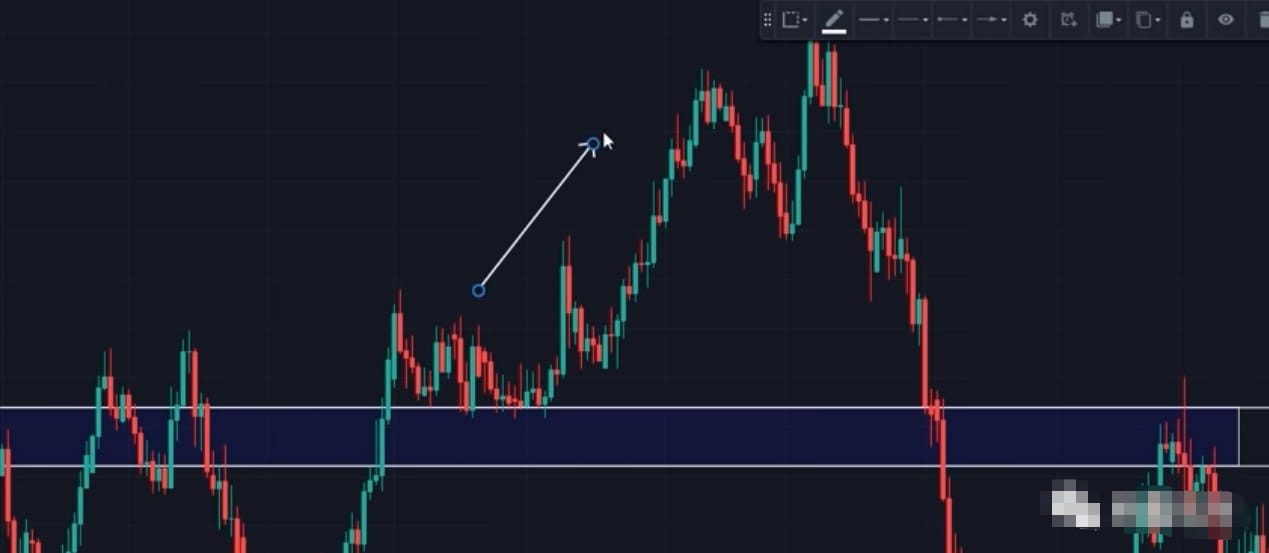
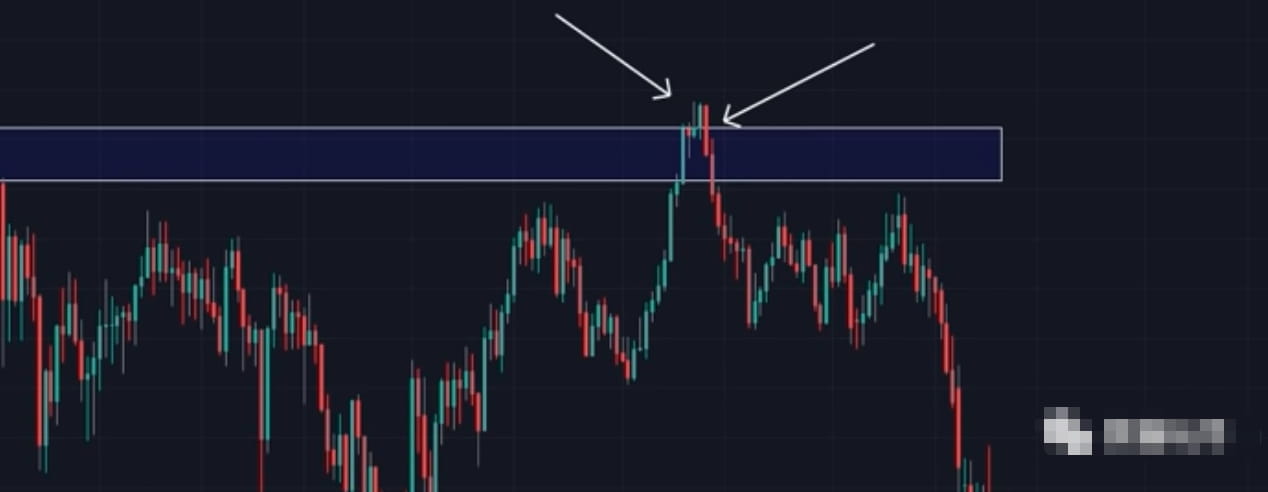
Let’s use an example of real offer
When we find a key bit (as shown in the figure)
We saw that the last time the price hit this position, it reacted strongly downward.
So the price comes back here again
Never think that prices will go down again
Enter short immediately
There is a high chance that you will learn a painful lesson if you do this.
We just mentioned
There is no permanent enemy in the world
No more permanent friends
Yesterday’s pressure level may definitely become today’s support level.
The key position is actually a market balance point
Both bulls and bears will want to make a breakthrough here or hold on here.
Therefore, the forces of both sides usually meet at this position.
What we have to do is wait for the outcome of the market war
Watch how price reacts to this position
Decide whether to enter the field based on the traces left by the battle between the two sides?
Why enter the market?
When to enter?
When to leave?
Wait for a series of trading plans
simply put
The best thing to do is to wait for a trading signal as confirmation
You just entered
And this signal can be a technical indicator
Can be in chart form
It can be a K-line form
It can even be fundamental analysis
There are over a thousand different combinations that can serve as trading signals
Because of limited space
I can't possibly say it all in this article
So this matter will not be explained in detail here today.
I will only outline two or three trading signals in the last part of this article.
future
I will target different entry signals
write an article
It's an area, not a line
Let’s continue to explain the usage of the third error
That’s the real key bit
It should be an area not a line
Although the market will continue to have history repeat itself
But the process will not be repeated 100% exactly the same every time.
not to mention
Digital currency market
from birth to present
Less than 10 years
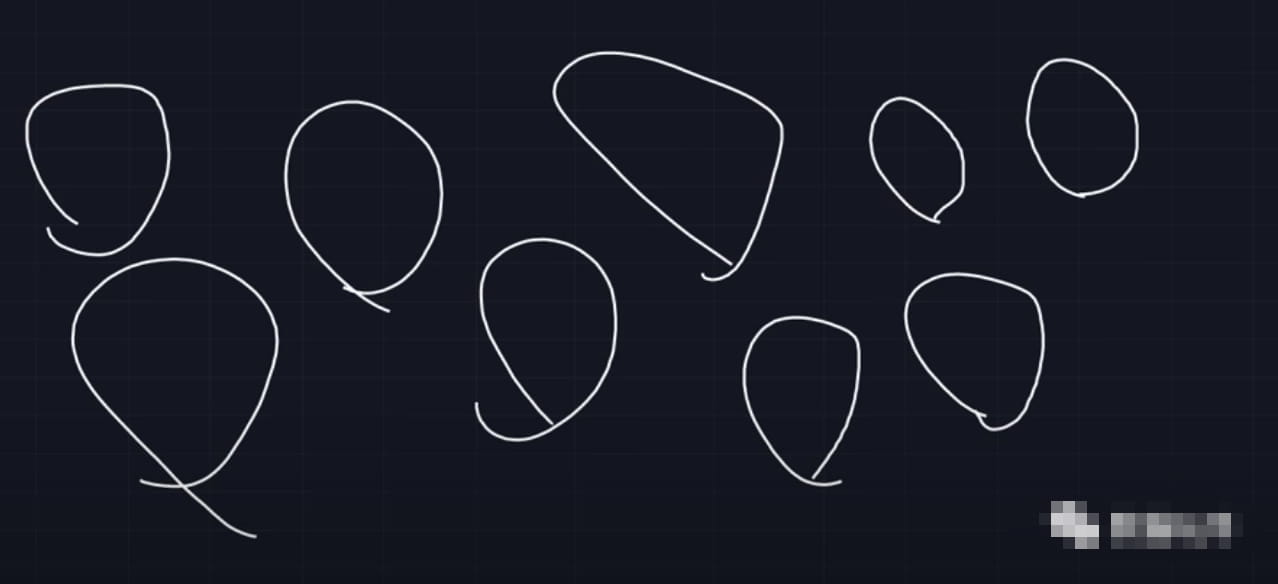
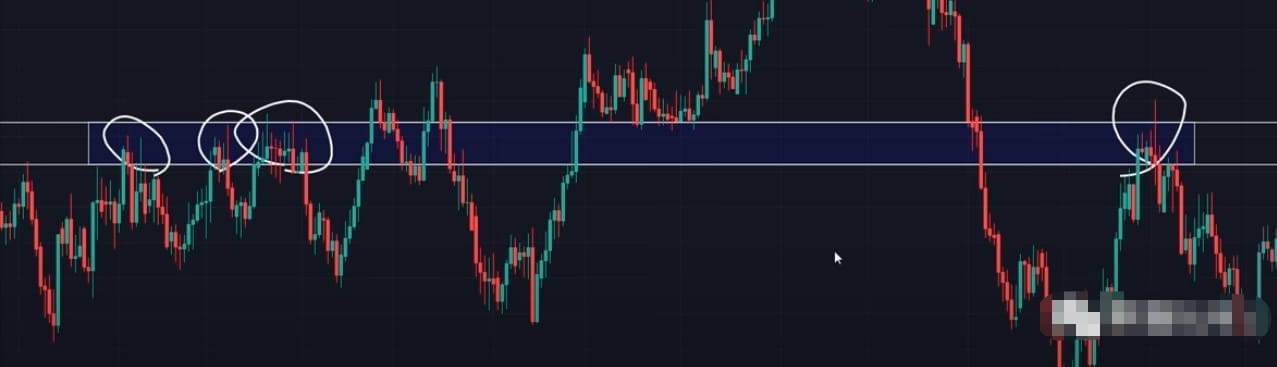
The market cycle is like the circle drawn in the picture above
Each circle will have some differences
It is difficult to draw exactly the same circle
It's not because I didn't draw it that way on purpose
But there are too many uncertainties in the market
Although the results are similar
But there is a very small chance that the process of the last time can be completely replicated.
Take here for example
The second time the price reaches this position, a signal appears and it rebounds again.
When I come back here for the third time
According to your analysis
You decide to enter
The stop loss point is placed at the height of the previous backtest
But today the price decided to go even lower
Hit your stop loss directly
If you draw this key position as an area
So your stop loss will be here
Then your transaction will be successful this time
and bring you huge profits
The difference between a successful and a failed transaction
It's just a subtle area
Draw the key position as an area
It can help us avoid many failed transactions
At the same time, the price can be driven to our profit stop point
This is the direction we want
The chance of unexpected appearances is greatly reduced
I believe seeing this
Friends who play contracts should feel deeply touched
The general market situation has obviously not changed
It is still developing according to the expected trend.
It's because of that damn needle
The warehouse is blown up
The range is too large
sometimes we find
The key bit area drawn is very large.
this situation
Especially in large areas, there is a greater chance of appearing
as the picture shows
Here a trading signal appears within the K line
Normally, if a signal appears at this location
There are enough reasons to enter the market and make a trade
But because the range we draw here is too large
It will make us hesitate
Is this K-line pattern valid?
An area that is too big can make us feel confused
Even if there is a clear signal
But there will be some unnecessary troubles
It makes us hesitate and miss opportunities
When this situation occurs
We can connect as many points as possible on the entity line itself
Try to reduce this area to a reasonable range
Also make sure to connect to a minimum of three contacts
This will make the whole incident much clearer
Large cycle charts are more accurate
Large cycle charts are more accurate
You may have heard of it
The larger the time graph is, the more accurate it is
In fact, the logic is very clear
If something takes more time to brew, plan, and prepare
Its success rate will definitely be higher than in a short period of time
Things that happen spontaneously are much higher.
It’s the same when we look for key positions
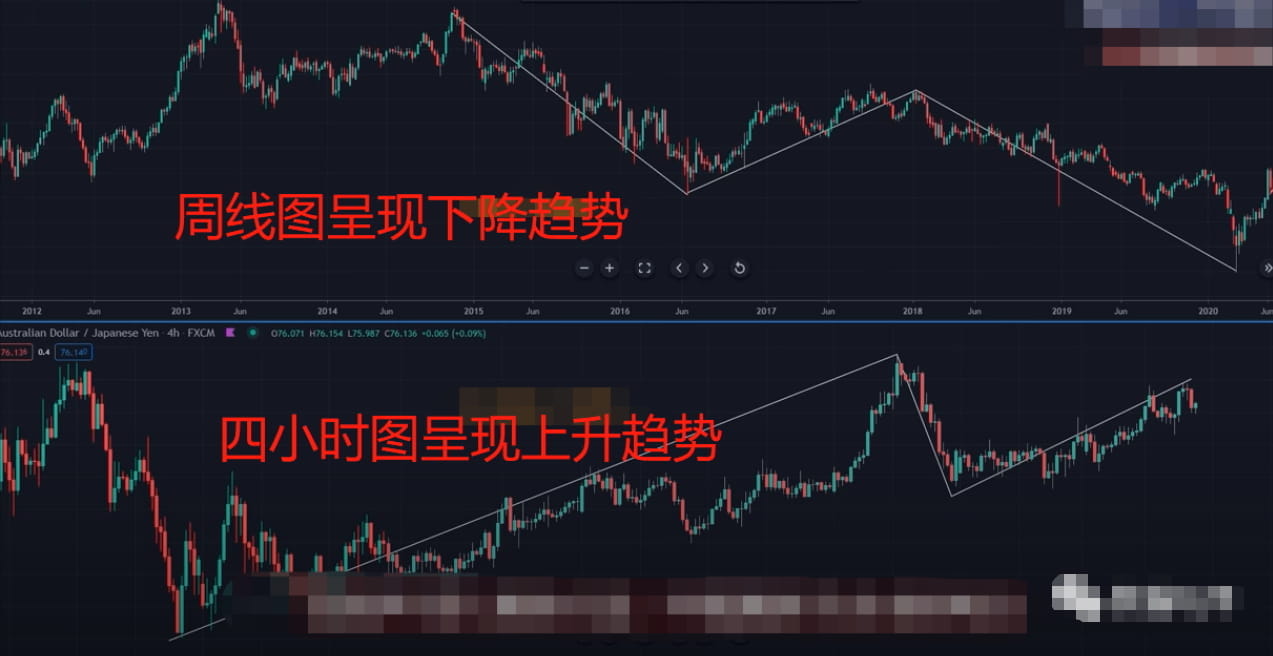
Always start with the big time picture
it's here
I will share a tape-reading technique that I have used for many years
This is what a well-known institutional trader once taught me.
From the weekly chart
Arrival map
Go to the 4 hour chart again
1 hour chart
Descending level by level
Do analysis on each currency pair
Always start with the big time picture
Make a trading plan for the next week
After you know the general trend of the market
Your chance to be on the right side
Naturally it will be bigger
If you are a person with little trading experience
I suggest you start with a big time graph
For example, the daily line or even the weekly line starts
Build your confidence in trading first
Then slowly try to move to a smaller time chart
Take you to the real market to find the main support level and pressure level five
Finally, I have finished talking about these 5 conditions for defining key positions and 5 application errors and secrets.
You may think that what I just said is a bit subjective.
It is difficult to define a clear and quantifiable condition
For example
What constitutes a strong reaction?
How many times does it take to be rejected? What does it mean to be effective?
If you also have this question
congratulations!
Your understanding is amazing!
You've probably already begun to absorb this concept and begin to digest
This is why I classify this course as advanced technical analysis
indeed
The key position thing is very subjective.
Technical analysis that includes all price action is
Show the same chart to different people
The results may not be the same
So the only way is to do the backtest yourself
Practice more and observe more charts
Action is worse than excitement
Next
Let me take you through a few examples
Immediately put into practice what you just learned
OK!
Before looking at the chart example
First I want to teach you how to draw a key position
step 1
We use a line to draw the place where the most K lines touch
And this line will follow a principle:
That is, entities are more important than leads
why?
Because we have to focus on the price at the end of the K line
That is the result
And lead means once
rather than the result
Step 2
Draw one more line above and one below the previous line.
The goal of these two lines is to contact the K line as often as possible.
Whether it’s a physical entity
Lead wire is also good
Step 3
Delete the middle line
In this way you will get a preliminary key bit area
If this area is too large
Just follow the secret I just mentioned
Adjust it based on the principle of connecting to the maximum number of contacts.
Remember a principle
The entity is more important than the lead!
If there is a conflict between the entity and the leader
We will choose the sacrificial lead!
Next
Let’s officially start looking at some chart examples
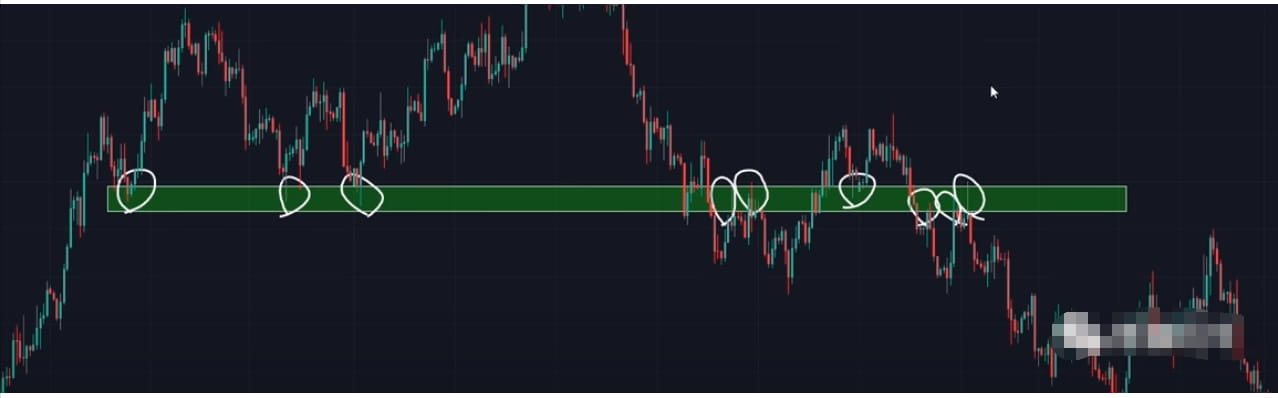
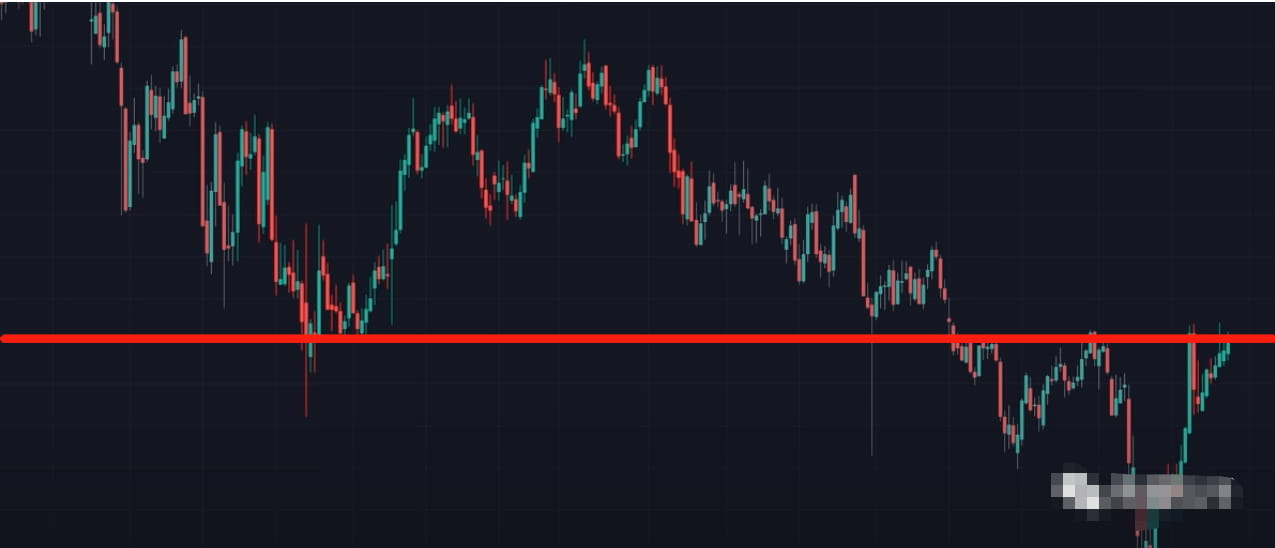
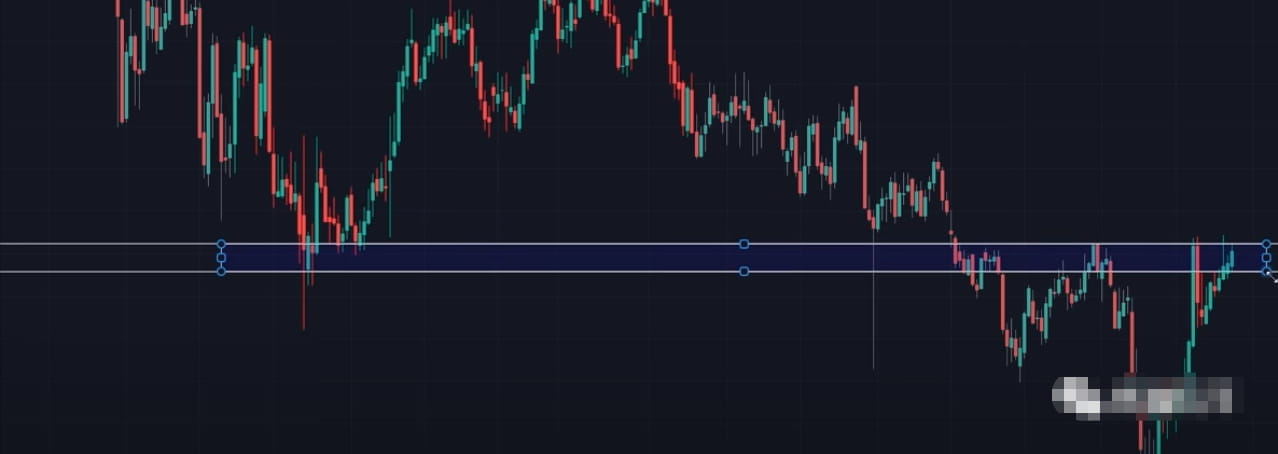
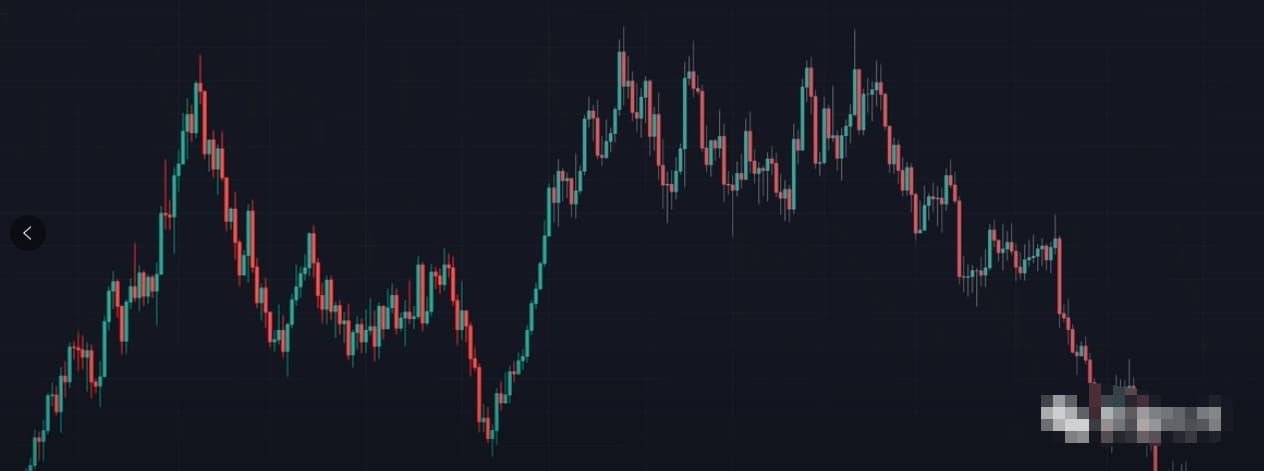
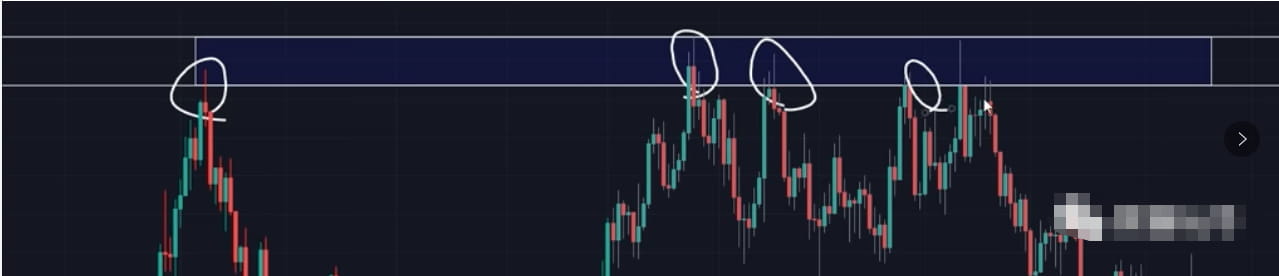
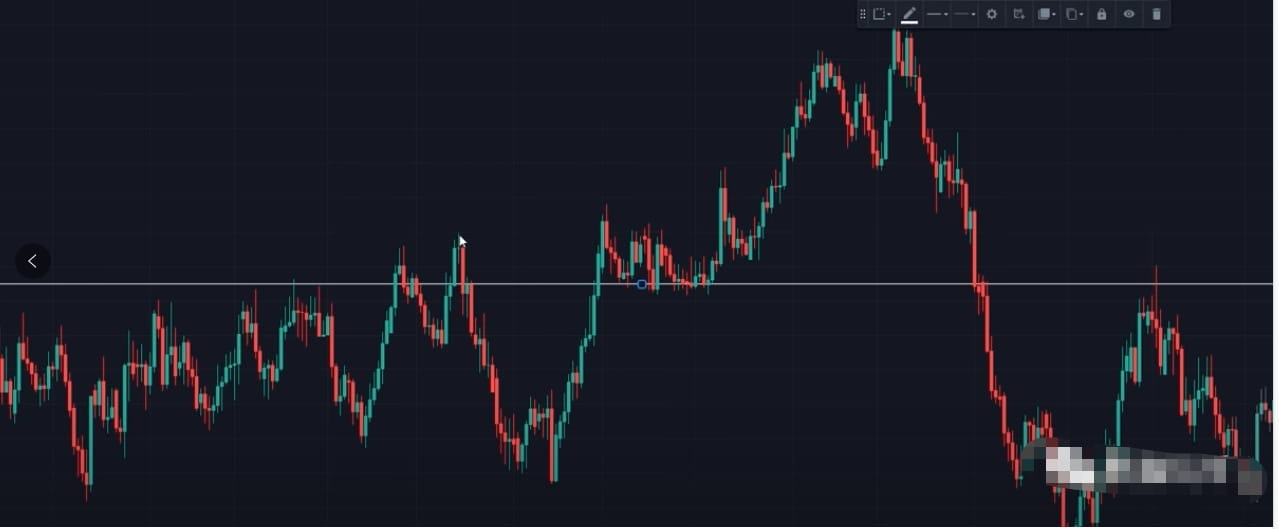
The 1st K-line chart
Can you guess where the key position is?
How many conditions does it satisfy at the same time?
That's right!
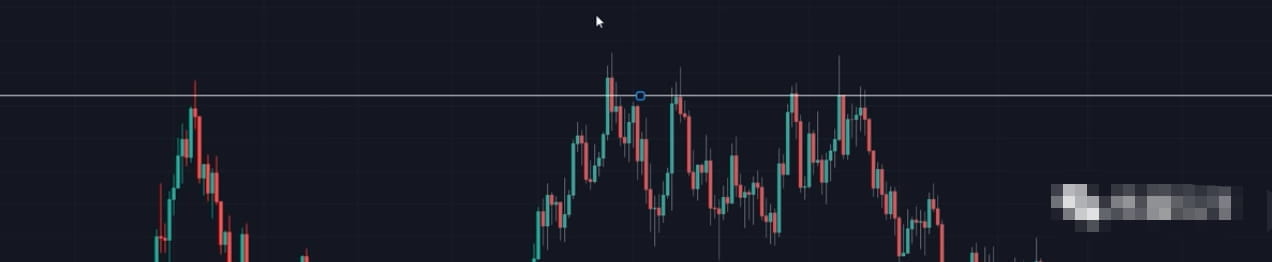
right here!
First we draw a line
Try to make it touch as many entities as possible
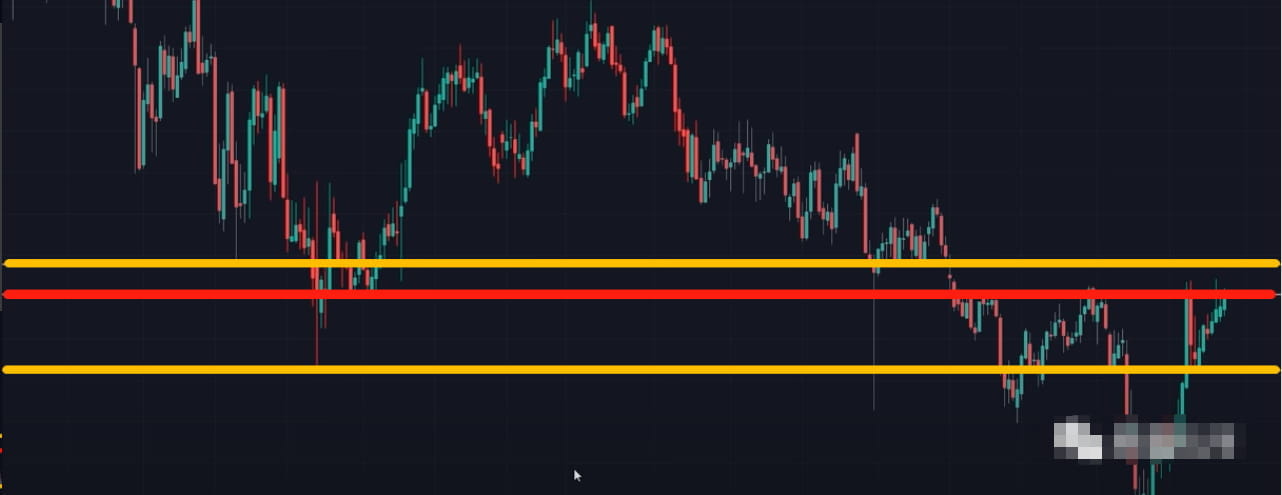
then above and below it
Draw one more line each
form a first draft
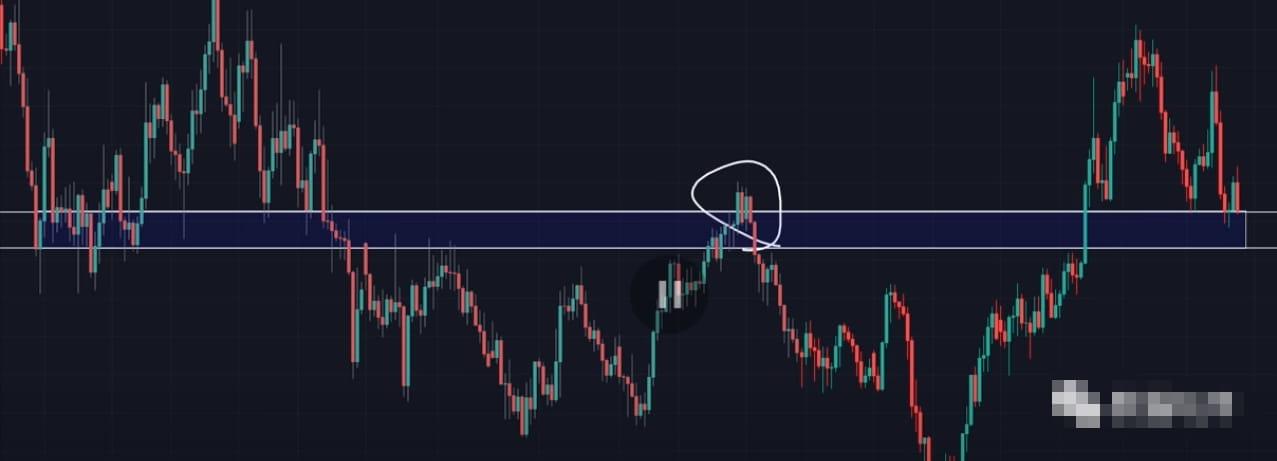
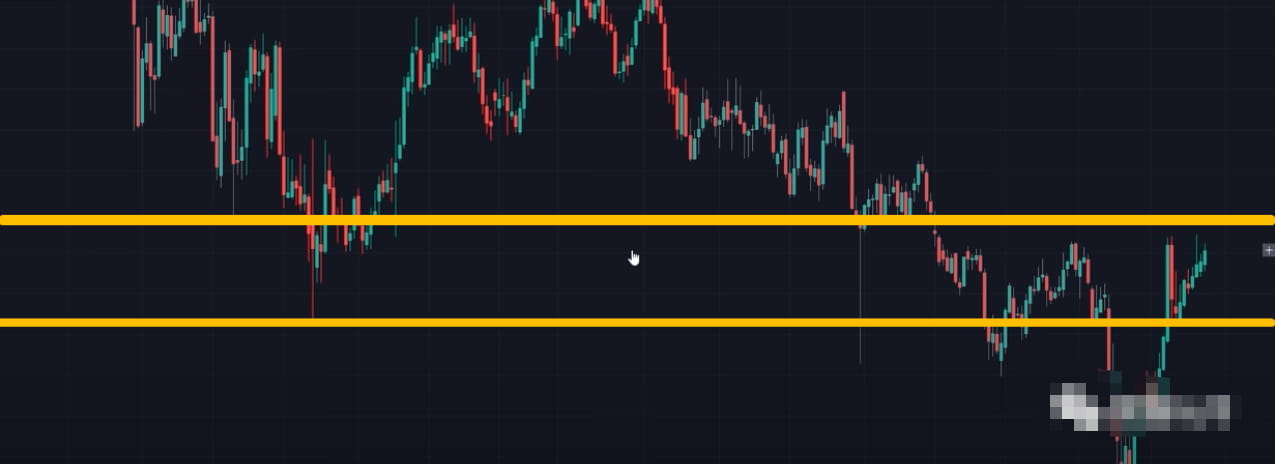
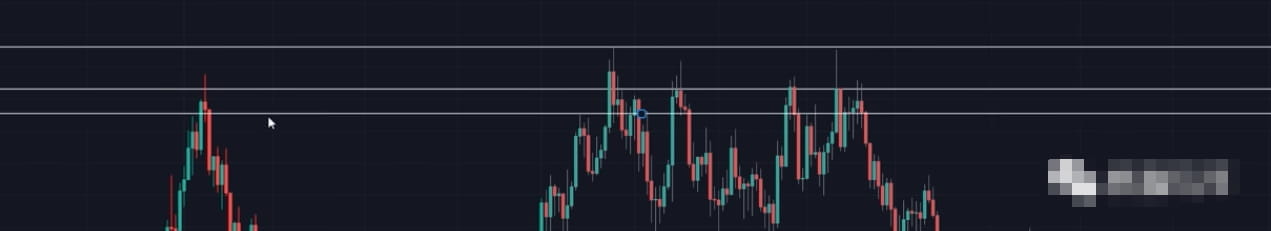
at last
Let's adjust it a little bit
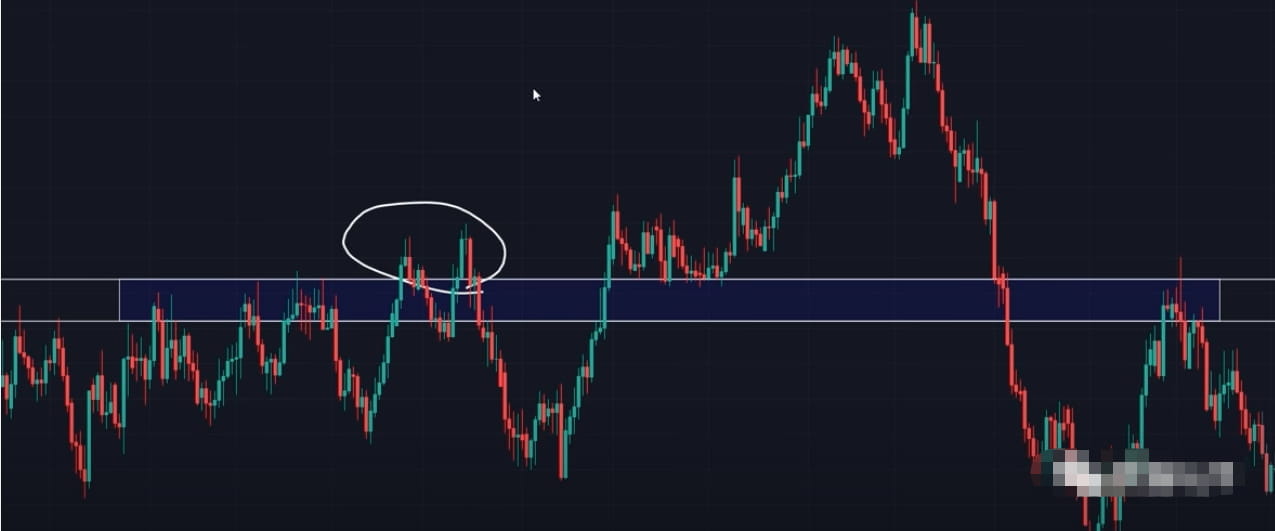
This area is the key position
Did you see that there is some overreach in this position?
To us
Actually it's acceptable
Because markets are usually not perfect
There is a very small chance that it will be like the ones drawn in some books.
There is exactly the same morphology occurring
As long as the flaw is not too big
It will not affect his qualifications as a key position
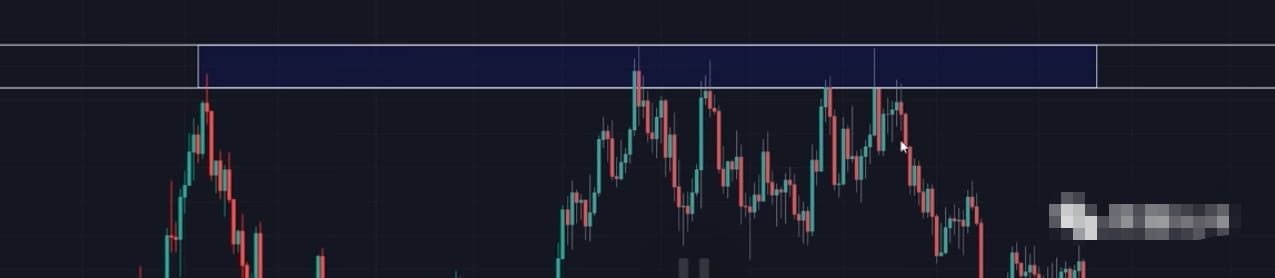
at last
Let’s see how many conditions this key bit meets?
It is clear
This location meets three conditions
1st
it has at least three contacts
No. 2
We've also all seen prices react strongly at one time or another
number 3
It has done support and pressure at the same time
Okay, let's strike while the iron is hot
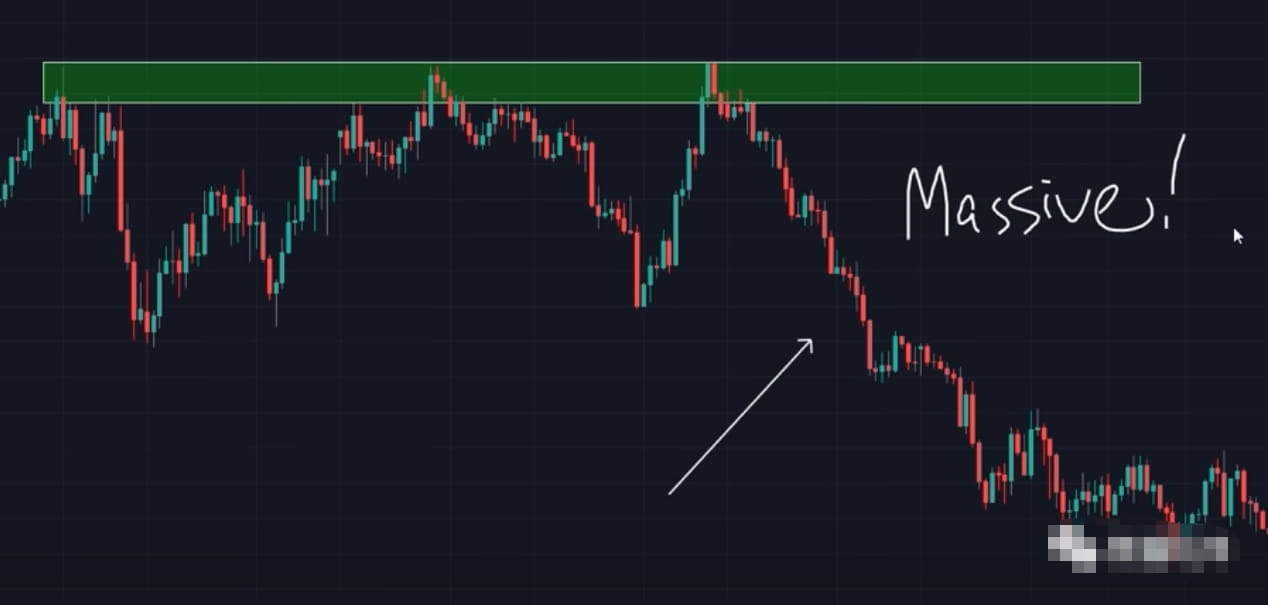
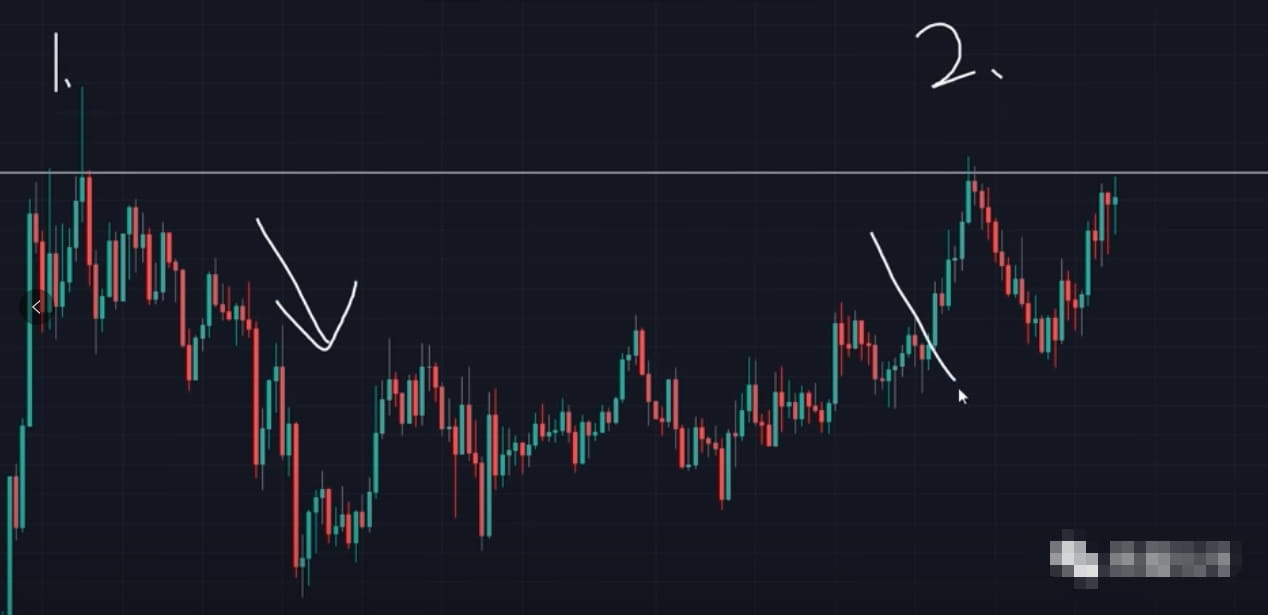
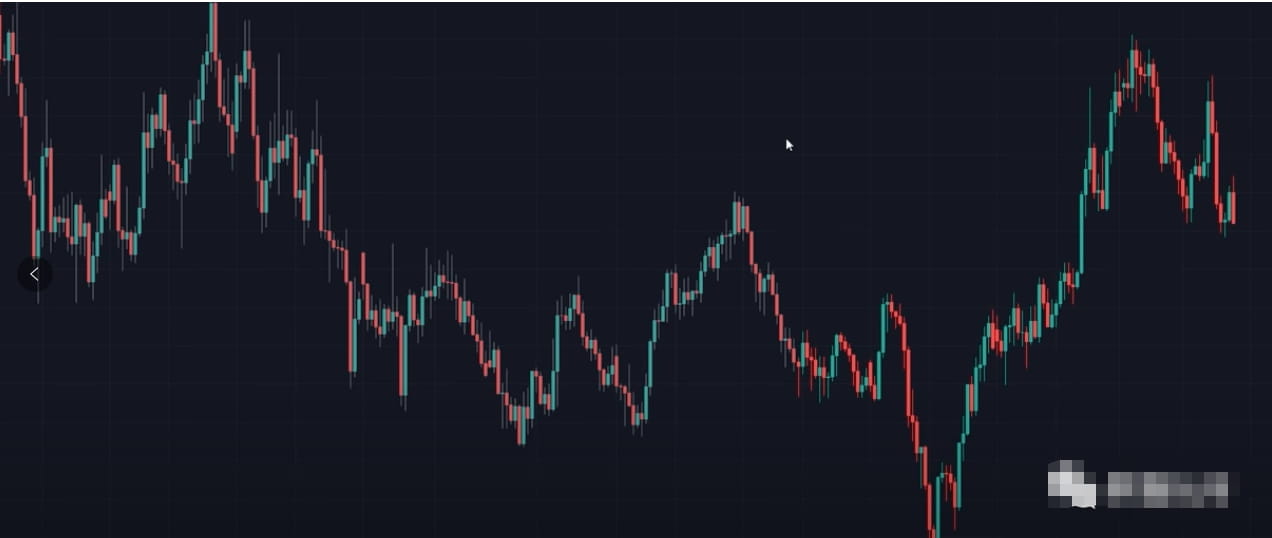
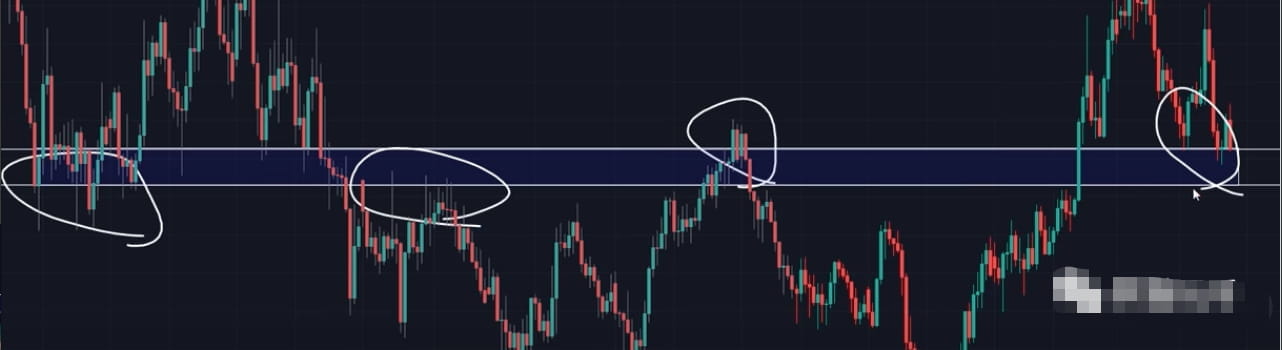
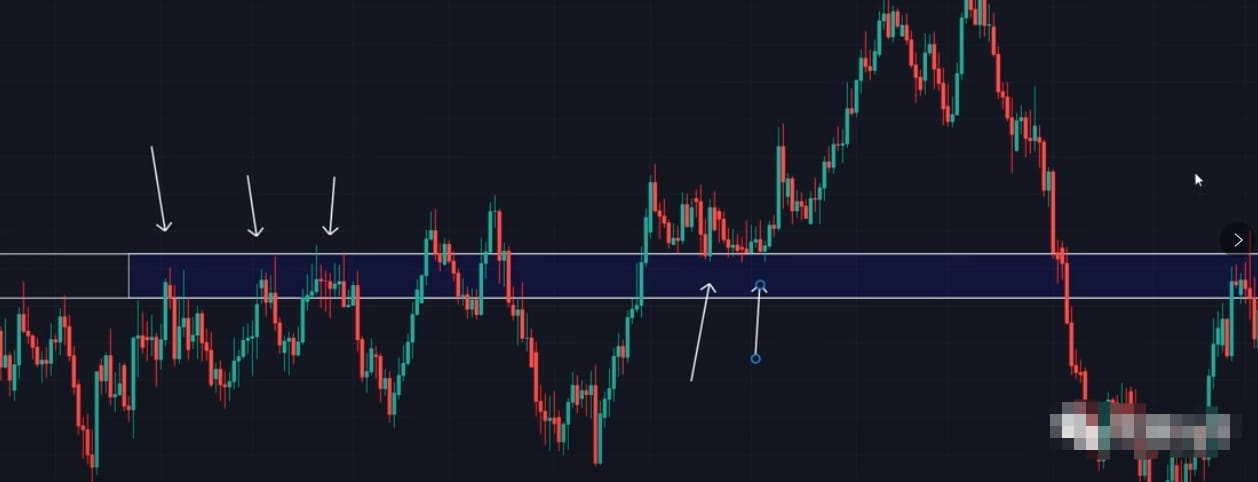
Let’s look at the second K-line chart
Let’s try to find the key bits together
Still the same way of painting
step 1
draw a line
Try to connect to all entities
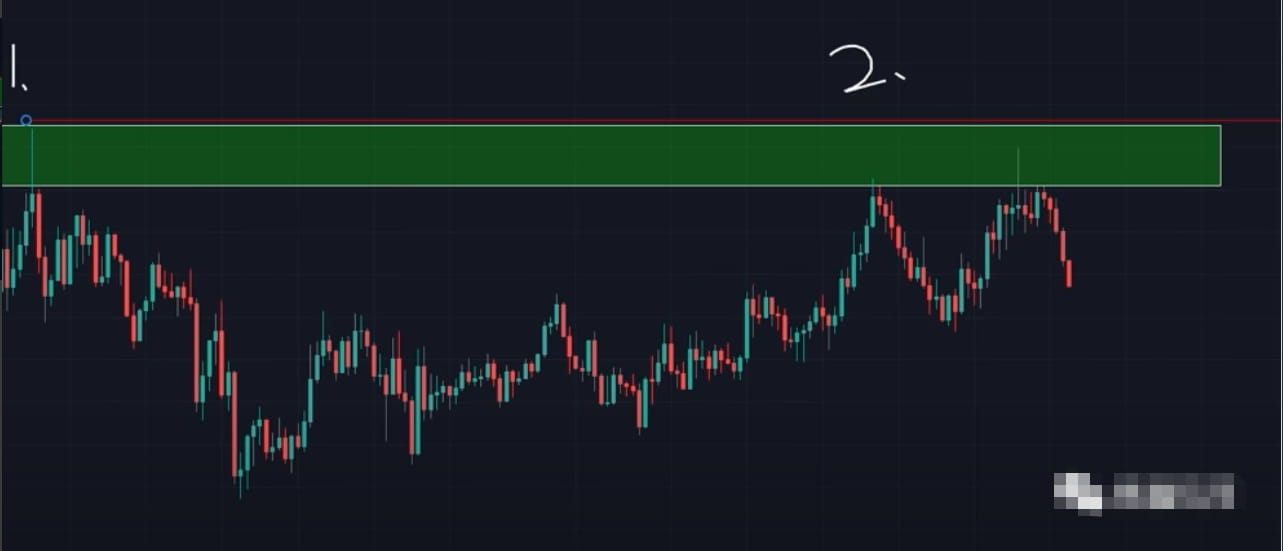
Step 2
Draw one more line above and below it
In this way we find a preliminary key position
Step 3
Let's adjust it a little bit
This key bit satisfies 4 conditions
First it has more than 3 contacts
The second position is very obvious and can be seen at a glance.
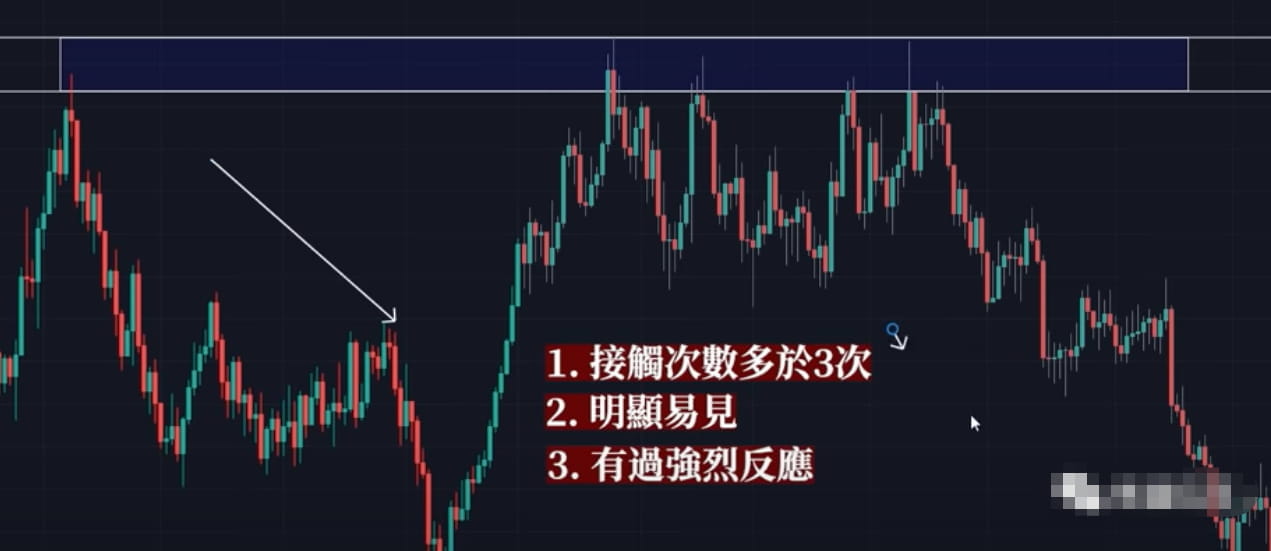
The third one has had more than one strong reaction.
4th we pass the K-line pattern
Seeing that the price has been rejected many times
good
There are only three things to do!
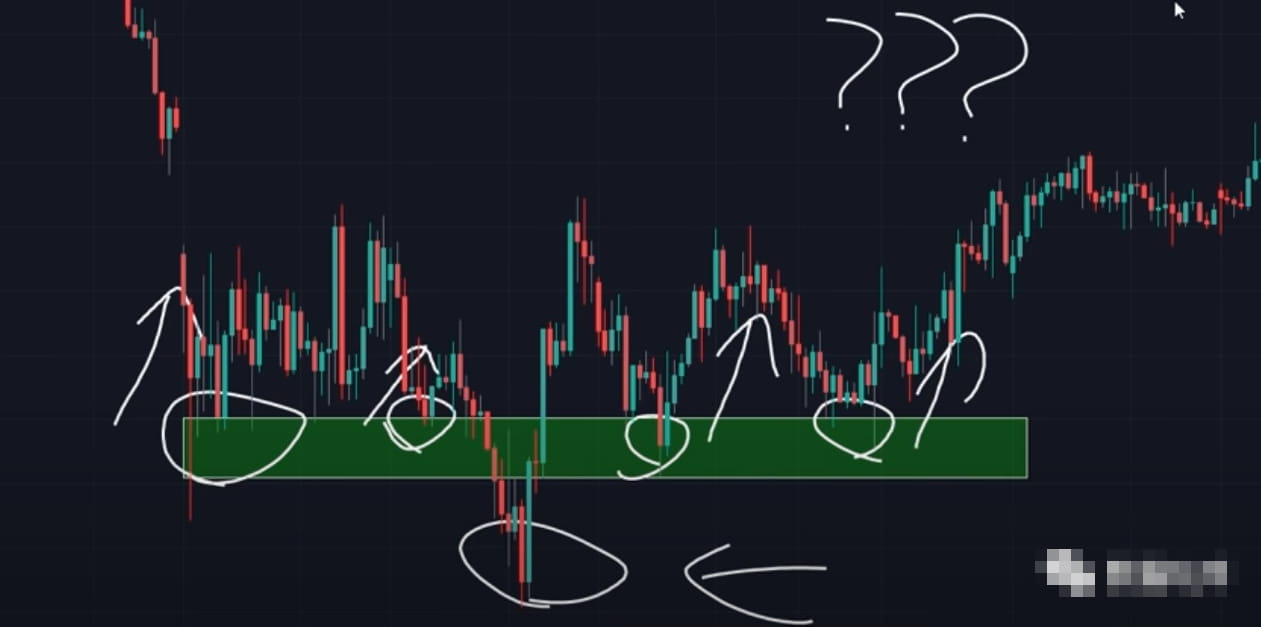
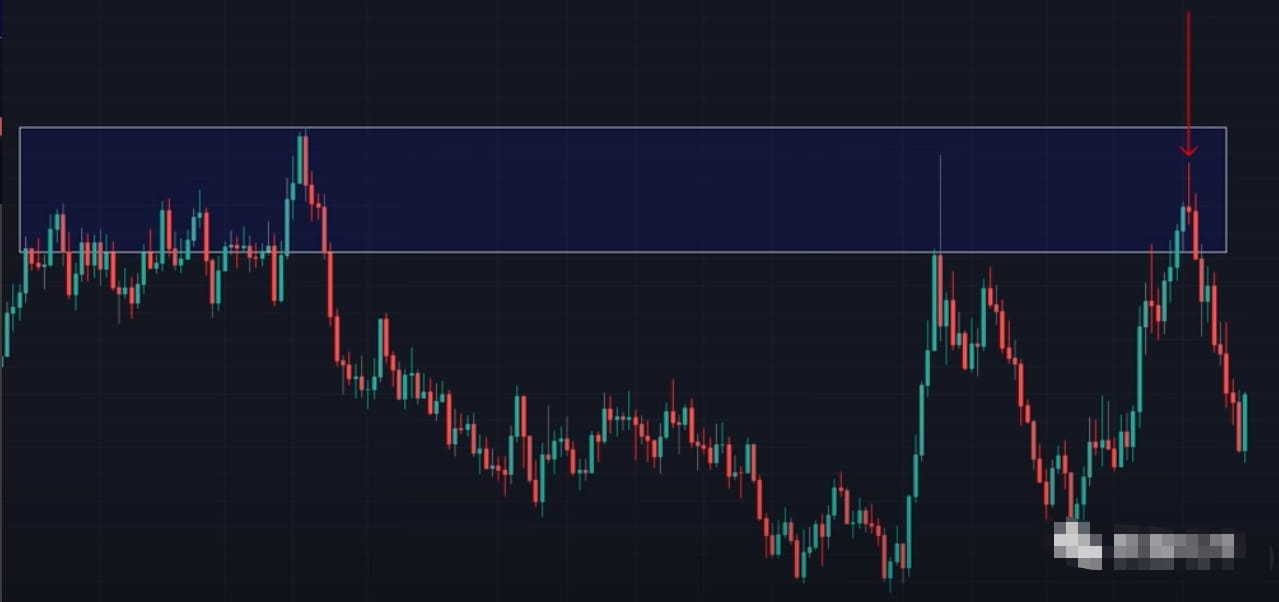
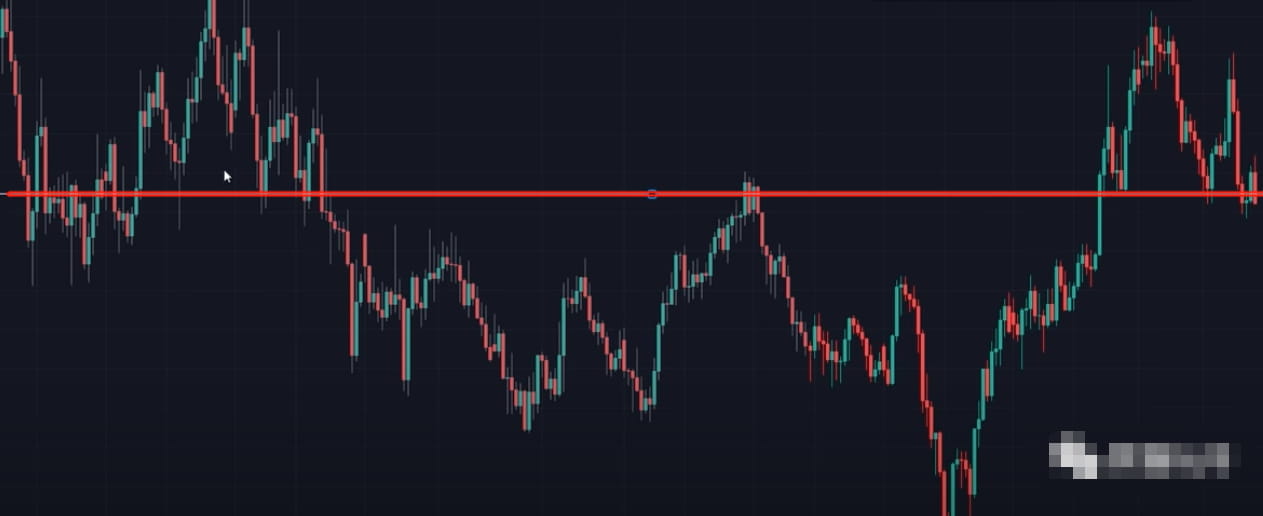
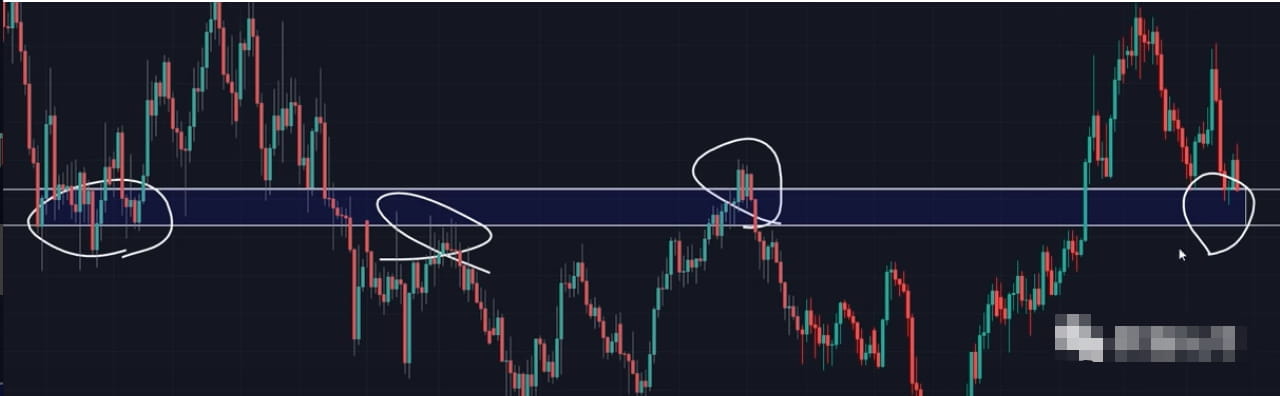
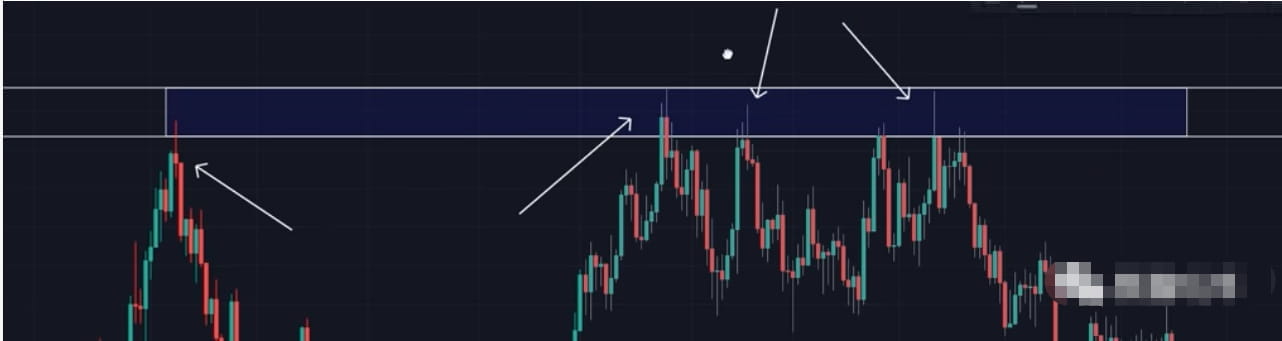
Let's do the last set of exercises
This picture looks a bit difficult
First we draw a line
Try to touch all entities
Then draw a line above and below it
OK, here comes the question!
Here is another situation where a boundary has been crossed.
How to do it?
Here I will define it as a false breakthrough event
I will explain the false breakthrough later.
Generally, my approach is to ignore this false breakthrough.
Because I don’t want the speech area to be very large
I emphasize many times
The key position thing is very subjective.
Each picture may be viewed from a different angle.
What you have to do is believe in yourself
This article I wrote today
Take you to the door of advanced technical analysis
but
This matter cannot be simply passed through an article
can fully understand
to have a thorough understanding
You have to take the time to understand it yourself.
to observe, to try
In fact, it doesn’t just refer to key positions
The world of trading is the same
There are more than a thousand ways to win money
As long as you have tested and confirmed it yourself
Or convinced that it is possible
Then it works
trust yourself
any thing
You will succeed when you do your best
Don't let others sway you with just one or two words!
alright
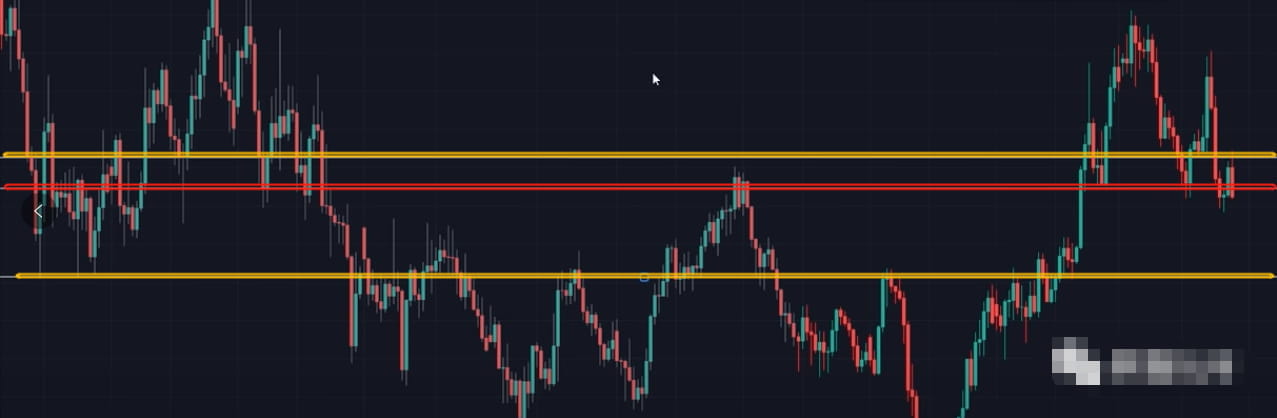
Let's continue
This is a very powerful key position
It meets 4 conditions at once:
It has been contacted more than 3 times in a row
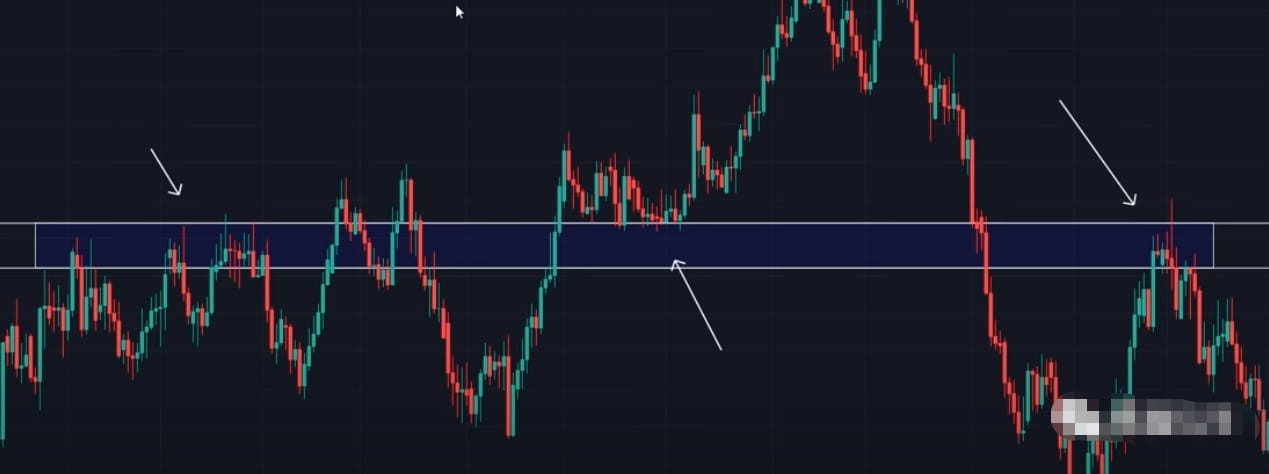
He did both support and pressure positions
Have had strong reactions
It has also been rejected many times
How to deal with the market reaction after key levels: trend turning, breakthrough and sideways shock six
First of all, thank you for persisting here.
I don’t know what knowledge this article can bring you
Can it help you achieve some success in real trading?
make some money
if you succeed
I hope you can share this good news with me
Share with other friends
I have struggled many times
Do you want to be like other bloggers?
Do some actual analysis and find out
Let currency friends follow directly
Just enter the market and earn rice.
But in the end I thought about it
Still feel inappropriate
No. 1: Transactions are timely
The currency circle is changing rapidly
Even though I have told you the exact entry position
But if the later trend does not go as I expected
I need to tell you to close your position immediately
from writing
to press time
to review
Then you pick up your phone
。。。。。。
There are too many uncertain factors to delay the timing
No. 2: It’s hard to challenge human nature
Humans are greedy
Including me too
Many people can obviously make money in the process of placing orders.
But it’s just because I think I don’t make enough money
If you earn 5%, you have to wait for 10%
When 10% is reached, you have to wait for 50%
I really waited until 50% and wanted to double it to 100%
result
A waterfall comes down
It directly became -30%
at last
Something is wrong
Decided to close the position and exit with less loss point
I believe this kind of thing happens every day
so
I'll let you set a take profit
Make some money and run
planned transaction
few people can do it
It would be okay if I earned rice
You might miss me
If you lose once
Then I will bear the title of master of deception.
Although the truth is
in 100 transactions
I made you earn 99 times
I only lost this once
this is human nature
No. 3: I don’t know you
My sharing is purely a hobby
I have already achieved financial freedom through the stock market
I don't have to prove it to anyone
I don't need to help others make money
Put pressure on yourself
did you make any money
What does it have to do with me?
How much money do you want to make
What does it have to do with me?
No. 4: It is better to teach a man to fish than to teach him to fish.
This is also the most important reason why I write and share
At that time, Mr. Lu Xun gave up medicine to pursue literature
Claiming that studying medicine cannot save China
Because I want to improve my health
Improving mental health first
Even now
People from all over the world continue to assist Africa
Donate money, materials, and people. . .
More and more every year
But I found that the more I donated, the poorer I became.
I believe you are a smart enough individual in front of the screen
Because I can understand the currency circle and have the courage to try it.
Must be the most outstanding elite in this society
So I hope to teach you the techniques and the basics.
You can use your own independent thinking ability to integrate them
Develop your own trading strategy
No longer at the mercy of others
because I know
95% of analysts on the market
Essentially, they are all looking at your principal.
You don't have to believe it
but it's true
If you believe those so-called analysts’ hindsight
Sign up for the exchanges they recommend
into their community
You will lose and even lose your pants.
(They will cleverly take advantage of your greed. If you still believe that they are just trying to earn your handling fee, then you are too naive and simple~)
It’s not convenient to say too much here
certainly
I will write a special article later to expose this dark world.
all in all
I hope you can put the knowledge into your own mind
It is better to have a father and a mother than to have one yourself
Because the trading market is the industry with the fastest technology monetization
You only need 2 months
You can master the technology
Then practice more and backtest more
Summarize your own experience framework
Finally you can make money
make big money
alright!
That’s a bit far!
return!
Let's clear up our mood
all in all
What I want to talk about next
Its value will definitely be greater than a trading strategy
And some of this knowledge will not be taught to you even in paid courses.
let's continue!
Usually after the price passes through the key level
There are three main results
They are
trend turning
breakthrough
and sideways shock
Let’s start with the trend transition
usually
There are three signs
will let us know when prices start to turn.
There is a big chance that the trend will change
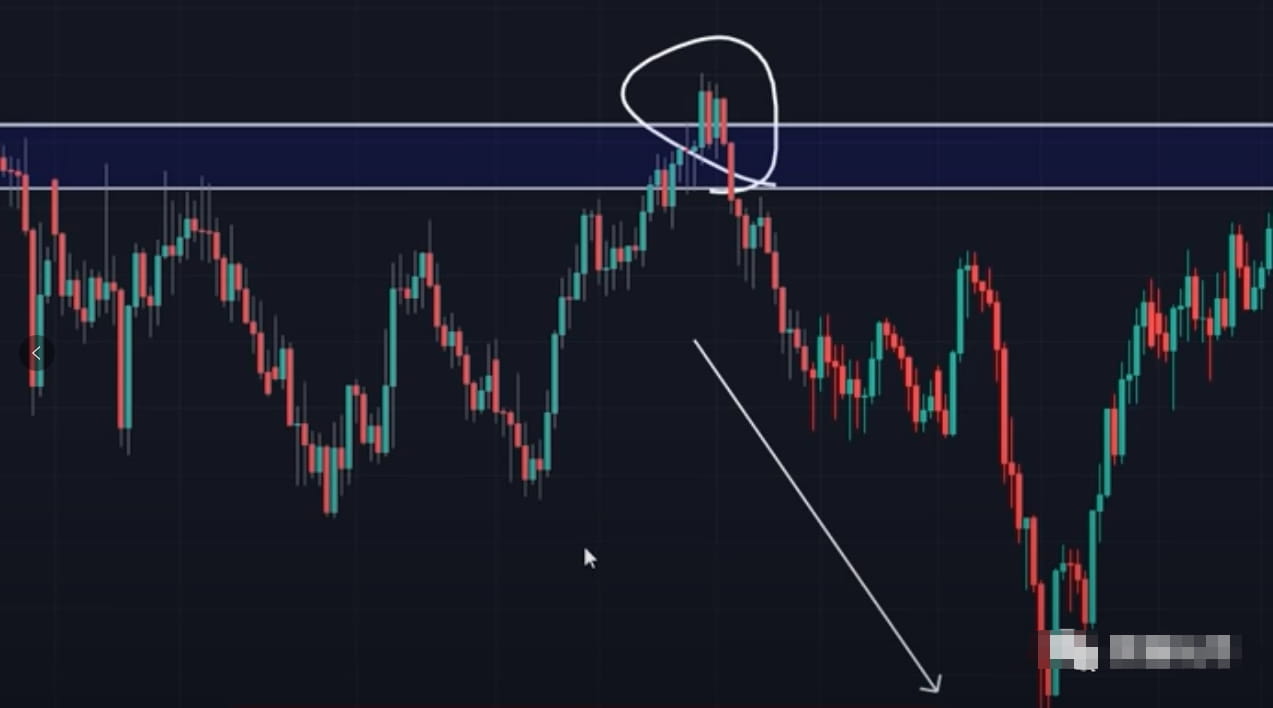
First
The price was rejected
The most typical example is the K-line shape
shooting star or hammer
The meaning was actually mentioned just now
It means that the price has tested upward or downward.
But he was immediately pulled back by the opposite force
It is a very classic, simple and effective turning K-line pattern.
Except for forms like shooting stars
We can also use a simpler way to match our identification
That is the RSI indicator
Don’t think that shooting stars, RSI indicators and the like are useless
Any K-line form, chart form, technical indicator
As long as it occurs at a key position
Its accuracy will be greatly improved!
Let's look at some examples
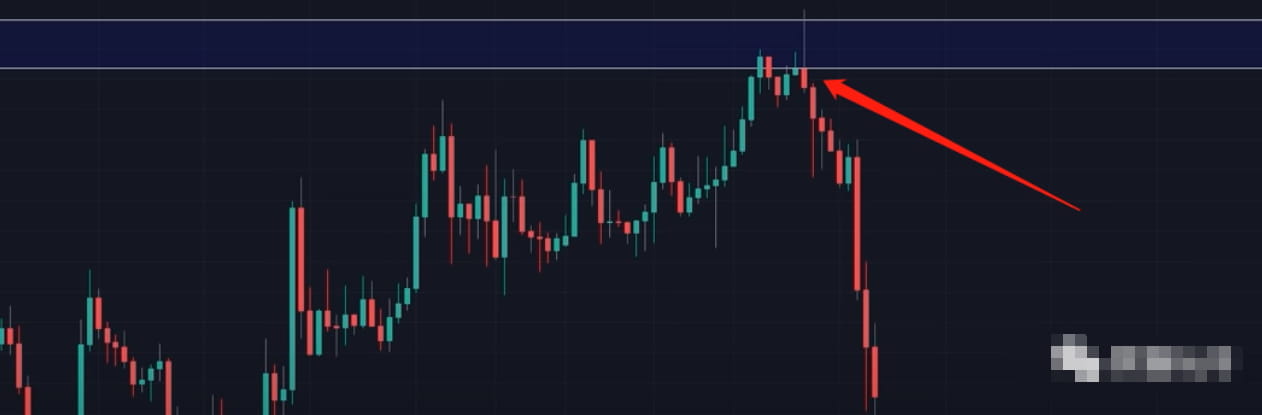
Let's take a look at the key position here
The price once tried to test upwards
Trying to break through the pressure level
But a force in the opposite direction immediately appeared
The K-line takes the form of a shooting star.
There are even more and more forces in the opposite direction
More powerful than the force of upward breakthrough
Finally, the entire trend reverses
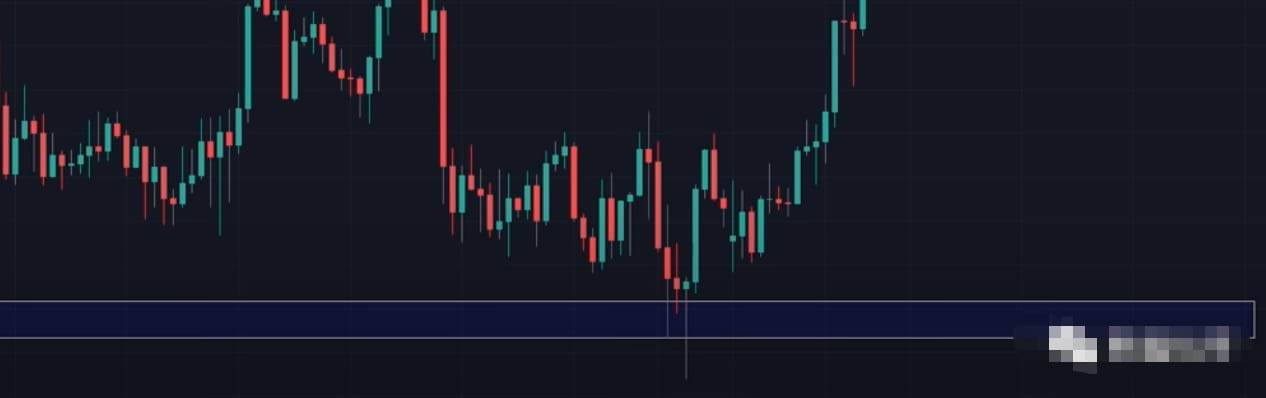
Let’s look at another example in the opposite direction.
We saw
When the price reaches a key level
The upward force begins to appear
We see a very long leading line below the real body line
That is, the shape of the inverted hammer line
This very long lead represents the downward center of gravity here.
This means that the downward force has lost control.
Until the K-line closes
Can't go any further
When the power of both parties is out of balance
Prices naturally move in the direction of those who have control.
certainly
The RSI indicator can also be used as an entry signal
Let's see what the actual situation is like
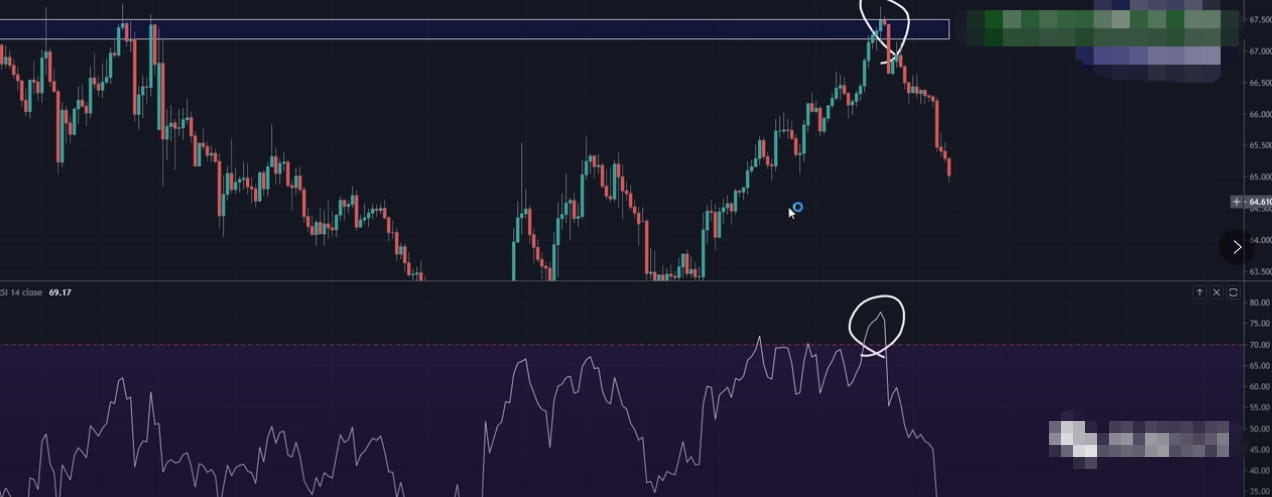
When the price reaches a key level
At the same time, the RSI indicator rose above 70
It means the market is in an overbought state
That is, a sold model
When RSI lights up a signal at a key level
It means that the current trend is about to change
Or at least a pullback down
Naturally better than being in a random unimportant location
The success rate of the generated signal will be much greater
So you have to remember
All technical indicators and
K-line patterns must not be used alone
Many friends have lost miserably because of this.
All trading signals must find a consensus point
It can be different forms, technical indicators with chart forms, chart forms with K-line forms, support and pressure levels, trend lines or fundamental analysis.
This way your trading winning rate will be higher.
Financial trading is a game of probability
Whether you are doing options, US stocks, or currency circles,
You need to understand this
to have a chance to survive
This event is definitely the difference between a successful trader and a failed trader
Because of limited space
So I won't explain it in detail here
I will definitely talk about it in the future
Want to read my future articles
Remember to follow me
After saying the first one
Let’s talk about the next two
The next two concepts will be more complicated
Because you can’t tell it at first glance
Instead, trade by observing price action
Because the kinetic energy of the K line itself can bring out some signs
Let us find out whether the chance of trend reversal is high
1st
Just observe how the price approaches the K-line
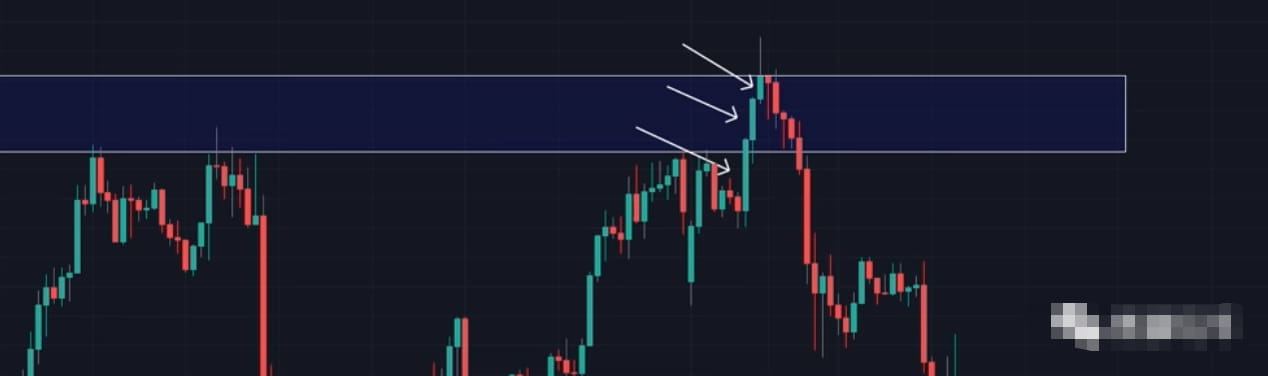
Let's take a look at this example
We see that when the K line is close to the pressure level
One is smaller than the other
Represents that the upward force begins to weaken
Also hinted behind the scenes
There is a consensus among buyers that:
OK! Listen up, brothers! That's enough for us when we get here. It's not worth our while to keep rushing upwards. We can just do it for a show!
When the market shows a reversal signal
Prices start to fall immediately
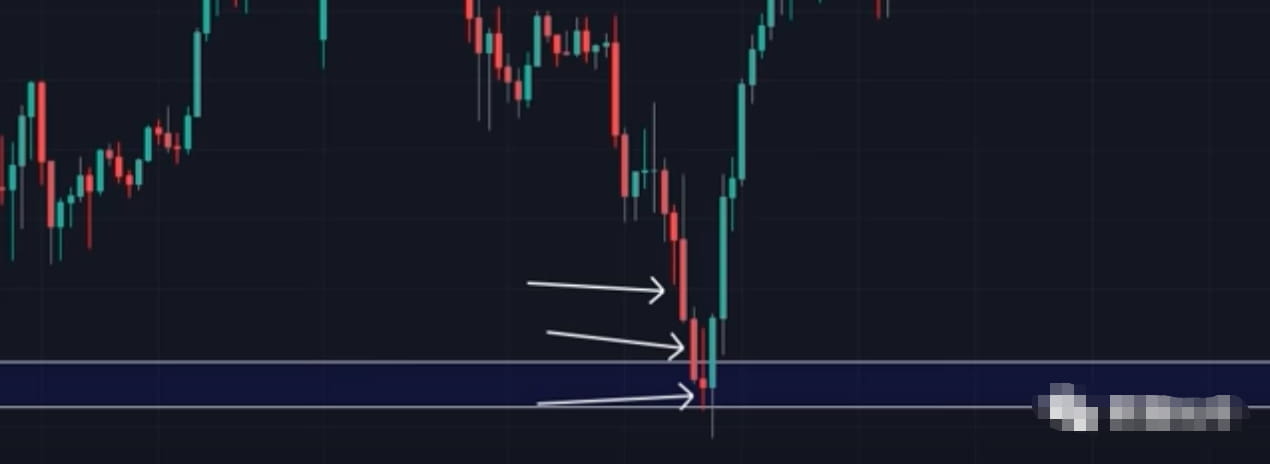
opposite example
When approaching major support levels
Each K-line will definitely be smaller than the other
The downward force gradually weakens here
then rebound
No. 2
Callbacks are becoming more and more frequent
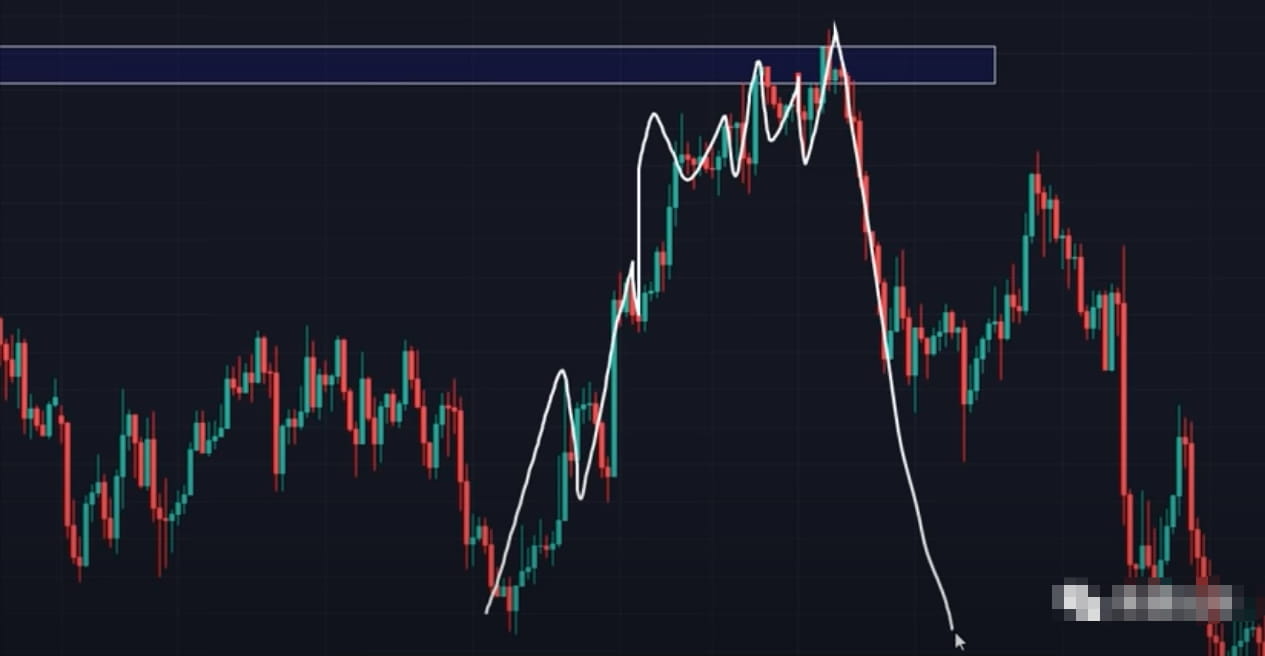
Let's look at this example
when the price goes up
It went smoothly from the beginning
When approaching the key position
The number of callbacks begins to increase and become more frequent
And we see prices starting to have no direction
Narrow range hovering up and down
What does this imply?
It’s when the opposite force begins to appear!
They form a fierce competition here
Although we see that the buyer still has control for the time being
But it feels like it's already crumbling
Even when it’s about to reach the critical position
That is the buyer’s profit stop point
Price reverses immediately
We're done with trend turning
Let’s look at the breakthrough next
About breakthrough
Be sure to remember two things
First
Don’t enter the market and make a trade as soon as you see the price return to the key level.
second
This position is where bulls and bears compete.
Both sides will want to make a breakthrough or stick here.
Therefore, false breakthroughs often occur at this position.
Many impatient currency lovers have gained a firm position above the area with just one K-line.
Just go and conclude that this breakthrough was successful.
But in fact, there was no breakthrough at all in the entire battle.
If the next real line appears more powerful than the breakout line
Then these impatient traders will be trapped
The price will keep moving in the opposite direction with the help of their stop loss
This is the so-called false breakthrough
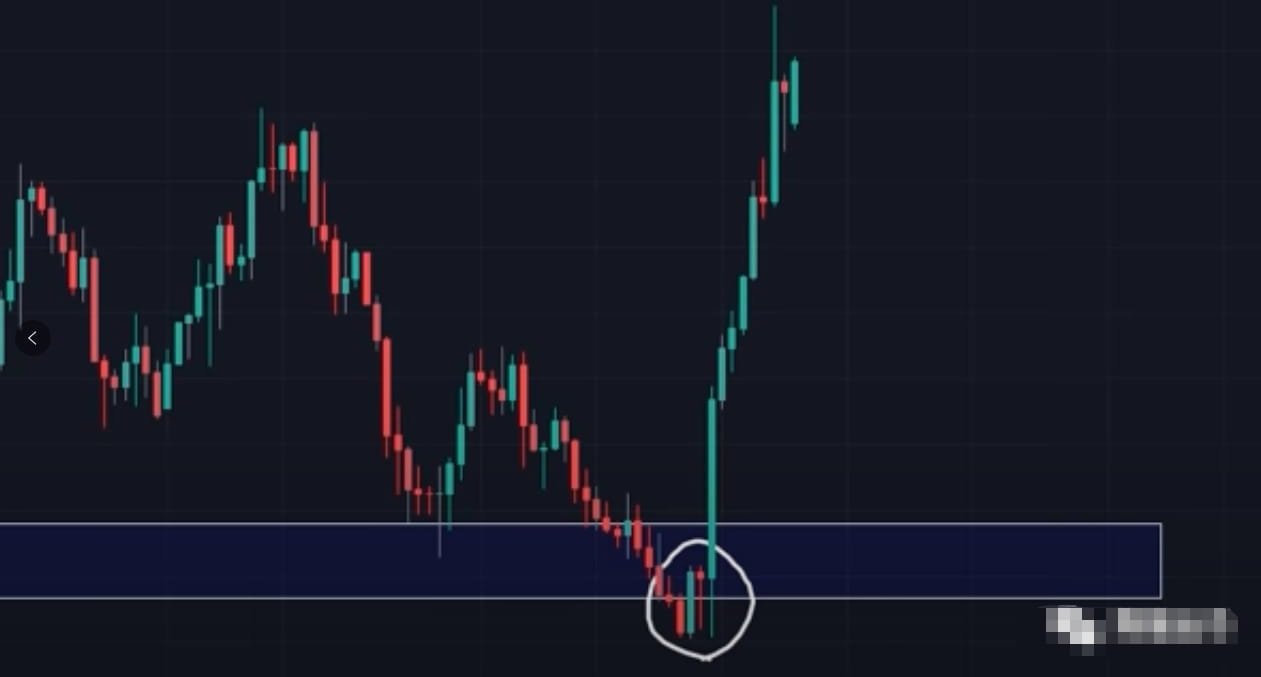
Let’s look at an example of a false breakthrough
When the price breaks through the key level
Then a larger K-line in the opposite direction appeared
Trapped a group of traders who jumped in here immediately upon seeing a breakout.
The price then moves lower with the help of their stop loss
Continue watching
Downward example
After the price breaks through the key level downwards
A more powerful positive line will appear immediately
It also trapped a group of currency friends who entered the market after seeing a breakthrough.
At this time, the buyer officially enters the market
Seller gives up resistance
Prices continue to rise smoothly
Avoid the trap of false breakthroughs
The best way is to break through the key level
Wait for the market to help you retest
See if yesterday’s pressure level has become today’s support level?
Or has yesterday’s support level turned into today’s pressure level?
Enter later
So how to operate it in real offer?
This is where the concept of retesting comes in handy.
When the price line breaks through the pressure level
We hope to see the market come back here again
Try it again
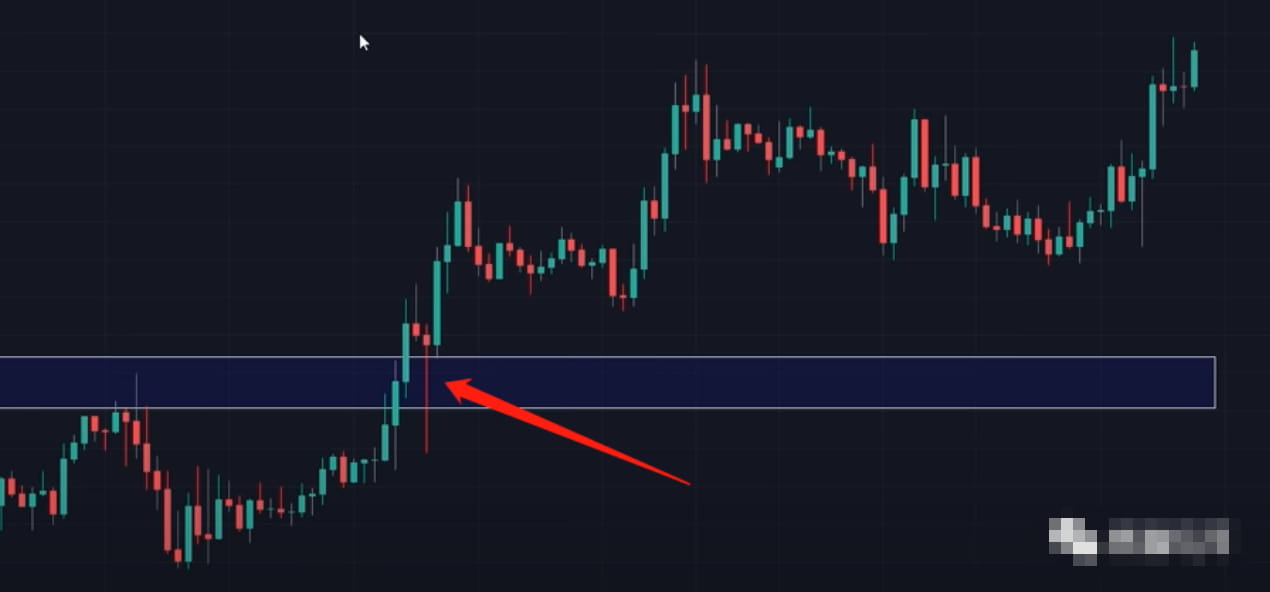
We see the lead of the solid line
The seller tried to make a last ditch effort
But he was soon pulled back by the opposite force.
And the lead of this K line is a retest
Test whether the seller has reached the point of no return
We can only compromise
This position has obviously become the support today
At this time
We can just wait for those big guys to decide the winner.
Identify the real winners
Boldly follow behind the big guys and enter the venue
The last situation is sideways shock
Sometimes when the price line reaches a key level
The two sides are competing for each other.
Both bulls and bears have a tacit understanding to temporarily form a balance within a certain range.
There are two reasons why we should not intervene at this time
First, the profit margin during the narrow range fluctuation process is too small.
Can't give us a satisfactory profit-loss ratio
second
We as traders never guess in which direction price will break out
I will just wait for the market to decide the winner.
Only then can we judge the market trend
We need to be a qualified trend trader
rather than directionless speculators
That is tantamount to gambling!
When the market is moving sideways
When there is no clear direction
What should we do?
How about preparing for later transactions?
Here is a secret for you
Let’s take that area where the sideways shock is
Draw a rectangular diagram
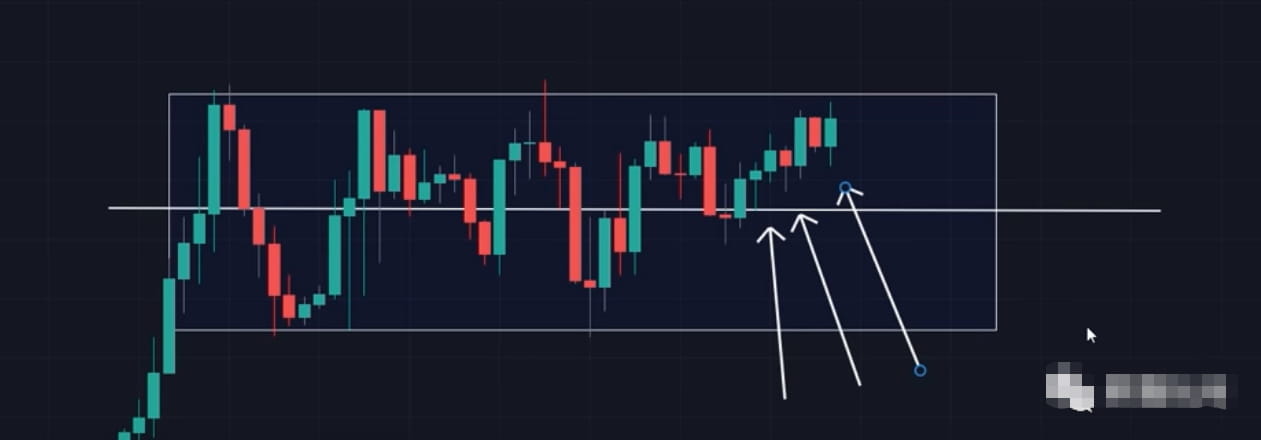
If we see the price staying above the recent K-lines
This situation means that the buyer is conserving power
ready to explode
We can develop a trading plan based on this prediction
Ready to enter the market
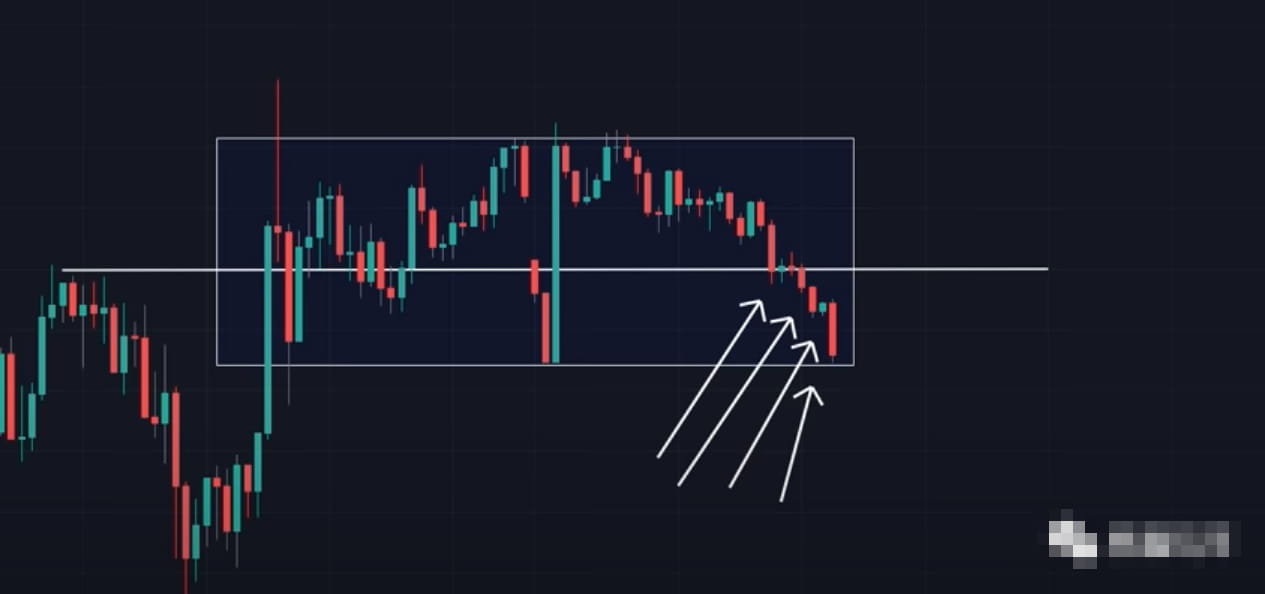
on the contrary
If you see price starting to stay in the lower half of this area
There is a biased seller who is conserving power.
certainly
Today's breakout may fail
Be careful of false breakthroughs!
So here it comes
That’s almost all the technical knowledge I want to share today.
I believe that friends who have seen this from the beginning
It must be fruitful
It's like taking a valuable college course
If you find this article useful to you
Remember to like and collect
Share and forward to people around you
for later review
Convenient to search from your mobile phone!
I am a panda coach who is good at making complex problems simpler.