The head and shoulders bottom is a typical trend reversal pattern. It is a bullish pattern that appears at the end of a market decline. The graph is formed by the left shoulder, bottom, right shoulder and neckline. The head and shoulders bottom is one of the most common K-line patterns for judging the formation of important bottoms in the market.
The characteristics of the head and shoulders bottom are as follows: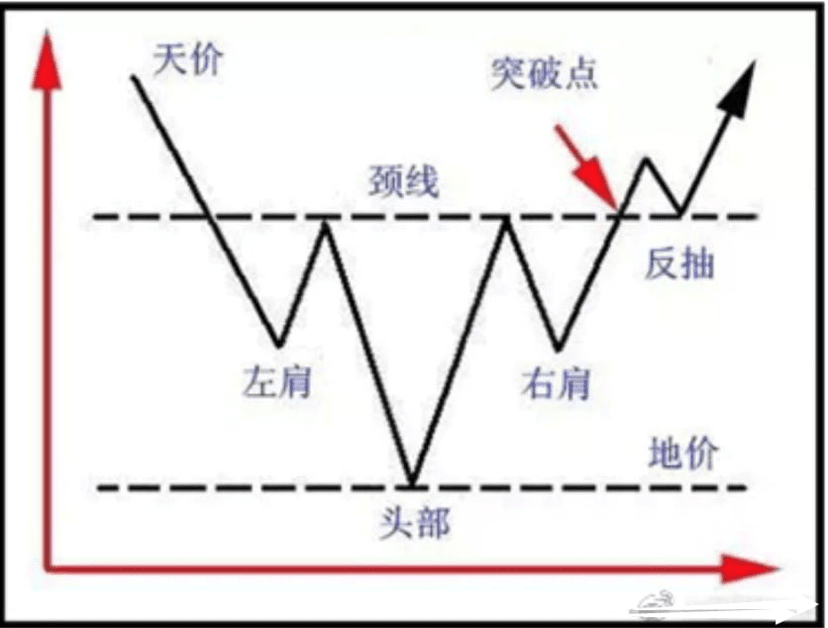
1. The market fell rapidly and then rebounded, forming the first trough, which is often called the left shoulder.
2. The first rebound was blocked, and the market fell again, breaking through the previous falling point, and then rebounded to form the second trough, which is the head.
3. The third rebound was blocked at the high point of the first rebound again, and the market started to fall for the third time, but it did not go down after reaching a position close to the first trough. After that, it rebounded again to form the third trough, which is commonly referred to as the right shoulder.
4. The line connecting the first rebound high point and the second rebound high point is the neckline that hinders the rise in currency prices.
When investors encounter a head and shoulders bottom pattern, how can they find the best buying point?
1. When the price of the currency begins to break through the neckline, it is an obvious bullish signal. You can consider buying. There is a high probability that the price will rise in the future. This position is usually called the first buying point.
2. If the currency price breaks through the neckline and then falls back, and then stops falling and rises again near the neckline, you can buy more. This position is usually called the second buying point.
3. After the coin price falls back to the neckline, it can be bought when it rises again and breaks through the previous price high. This position is usually called the third buying point.
Kind tips:
1. When the prototype of the head and shoulders bottom appears, it is necessary to at least make a rhythm judgment on the subsequent market operation based on the above situation to confirm whether it is a head and shoulders bottom reversal pattern.
2. Be sure to pay attention to more subtle differences in strength and angle, strive to make predictions as early as possible, and participate decisively when the market runs at the expected rhythm.
One of the tasks of an analyst is to perfect and improve, to help retail investors do a good job of risk control, and to enhance the mentality of retail investors holding positions; some people will say the accuracy rate, but the accuracy rate is not important to A Guan. A Guan’s technical accuracy rate is above 75%, and for retail investors, how much of this 75% can you take? As long as you can take 40% of the accuracy rate, you can make money! If you want financial freedom, but don’t know how to do it, don’t forget me! If you want to learn something, but have no way to do it, don’t forget me! If you want to look at investment with a smile, don’t forget me! If you have any difficult and complicated problems, you can consult A Guan! I am still the person who knows everything and says everything! With the most sincere service and the most down-to-earth analysis, I will bring you the greatest benefits! Give me a trust and give you a dream
A Guan, thank you for your attention. We will always be together through thick and thin.