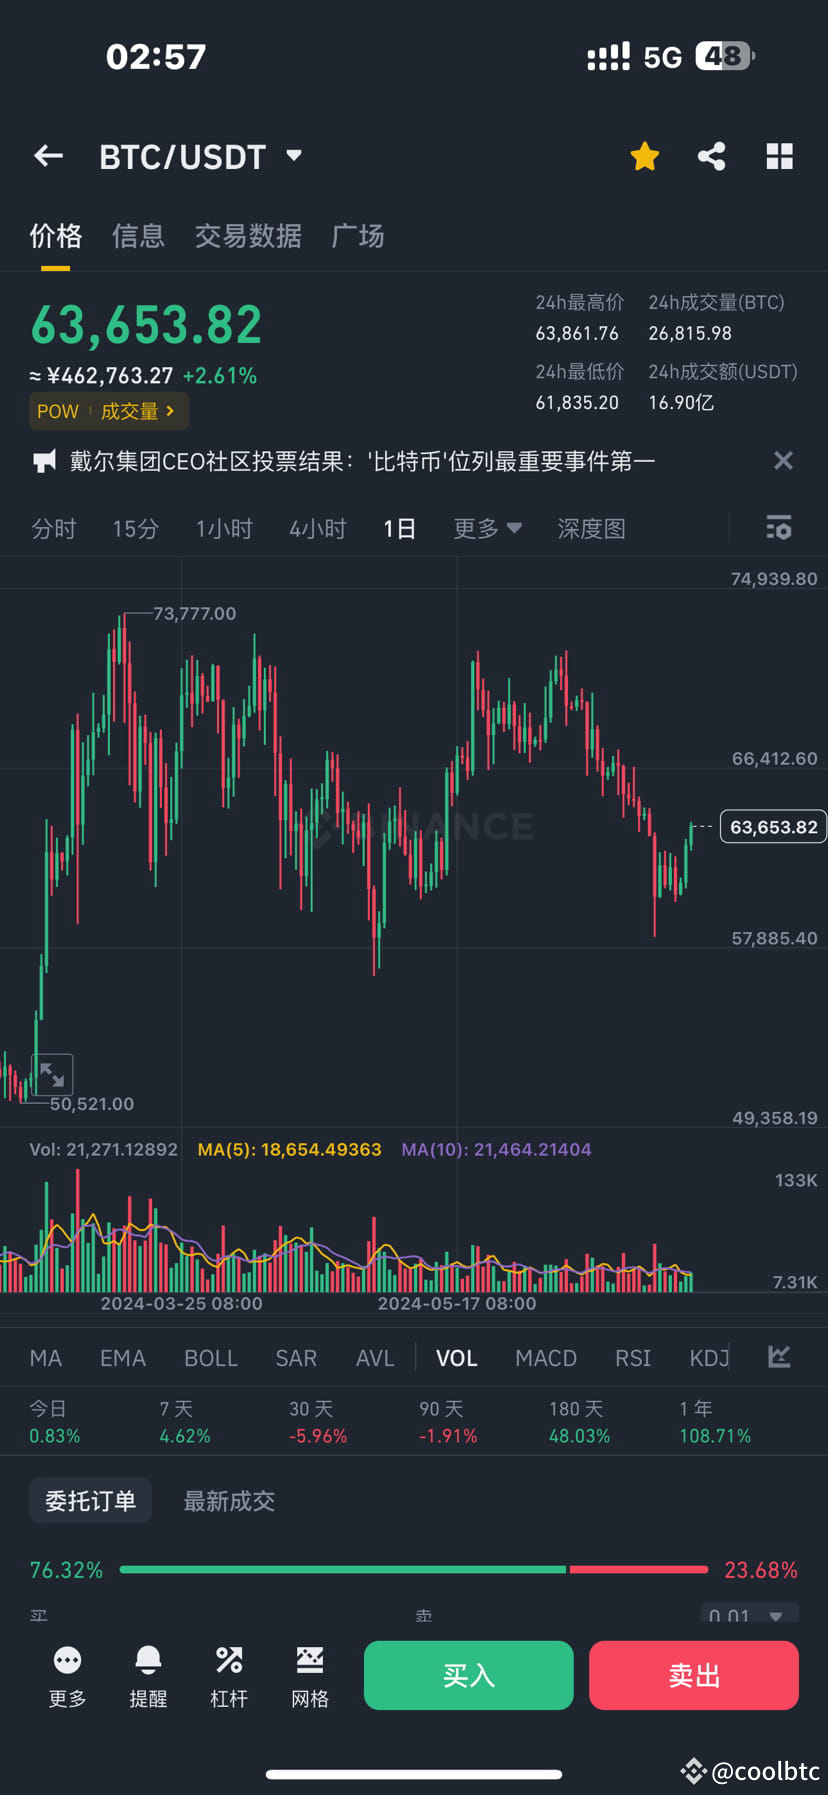
From the K-line trend in the figure, there are the following analysis:
1. **Price trend**: After a period of high-point fluctuations, the price of Bitcoin has gradually fallen, from the highest point of 73,787.1 USDT all the way down, and is currently hovering around 63,512.2 USDT.
2. **Signs of rebound**: The recent price has formed a rebound in the area close to 60,000 USDT, and is currently in a small upward trend.
3. **Support and resistance**:
- **Support level**: The recent lowest point is around 56,000 USDT, showing strong support.
- **Resistance level**: The current resistance level is around 64,000 USDT. If the price can break through this position, it is possible to rise further.
4. **K-line pattern**: The K-line in the figure shows that the price once formed multiple long lower shadow K-lines in the low area (around 60,000 USDT), indicating that the support below is strong and the buying power is more obvious.
5. **Short-term trend**: After a continuous decline, there has been a small rebound recently, and the real part of the K-line is relatively large, showing a certain buying power. If the trading volume can continue to expand and break through the resistance level of 64,000 USDT, it is expected to rise further.
Summary:
After experiencing a period of downward trend, Bitcoin has shown signs of rebounding, and the price has formed support in the 60,000 USDT area. If the resistance level of 64,000 USDT can be effectively broken, the price is expected to rise further. Investors can pay attention to the price trend after breaking through the key resistance level and the changes in trading volume to determine whether the rebound can continue. #BTC☀
1. **Price trend**: After a period of high-point fluctuations, the price of Bitcoin has gradually fallen, from the highest point of 73,787.1 USDT all the way down, and is currently hovering around 63,512.2 USDT.
2. **Signs of rebound**: The recent price has formed a rebound in the area close to 60,000 USDT, and is currently in a small upward trend.
3. **Support and resistance**:
- **Support level**: The recent lowest point is around 56,000 USDT, showing strong support.
- **Resistance level**: The current resistance level is around 64,000 USDT. If the price can break through this position, it is possible to rise further.
4. **K-line pattern**: The K-line in the figure shows that the price once formed multiple long lower shadow K-lines in the low area (around 60,000 USDT), indicating that the support below is strong and the buying power is more obvious.
5. **Short-term trend**: After a continuous decline, there has been a small rebound recently, and the real part of the K-line is relatively large, showing a certain buying power. If the trading volume can continue to expand and break through the resistance level of 64,000 USDT, it is expected to rise further.
Summary:
After experiencing a period of downward trend, Bitcoin has shown signs of rebounding, and the price has formed support in the 60,000 USDT area. If the resistance level of 64,000 USDT can be effectively broken, the price is expected to rise further. Investors can pay attention to the price trend after breaking through the key resistance level and the changes in trading volume to determine whether the rebound can continue. #BTC☀