

#stanpa
stanpa
236 views
9 Discussing
Hot
Latest

·
--
Bearish
🔄❌ CHoCH vs Fakeout : Don’t let yourself be tricked by false breakouts anymore!
In Price Action, the CHoCH (Change of Character) is the ultimate signal that indicates a trend is in the process of reversing. The problem? Many beginners confuse a real reversal with a Fakeout (an institutional trap) and lose their capital. 🏛️⚠️
Here’s how to sort it out so you only keep the best trades:
1️⃣ The Fakeout (The manipulation):
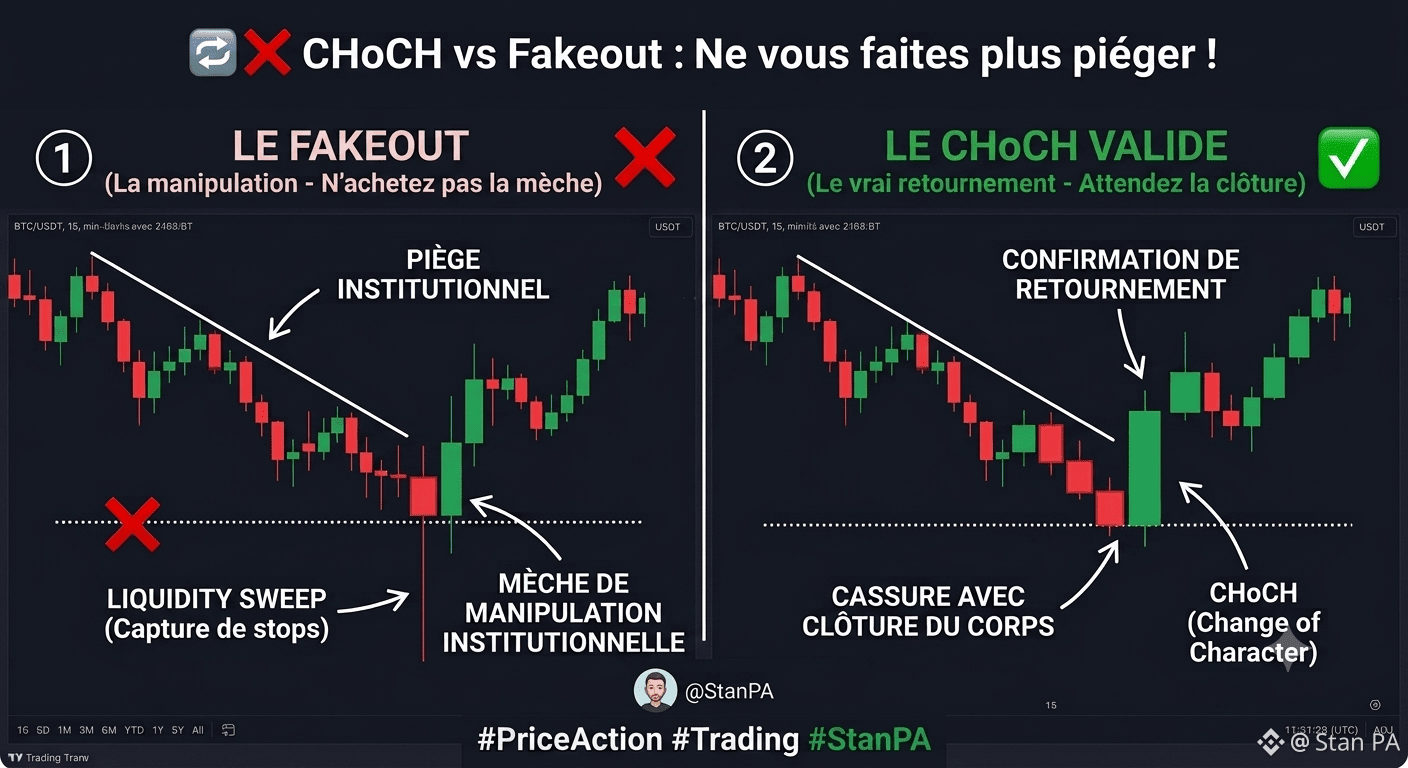
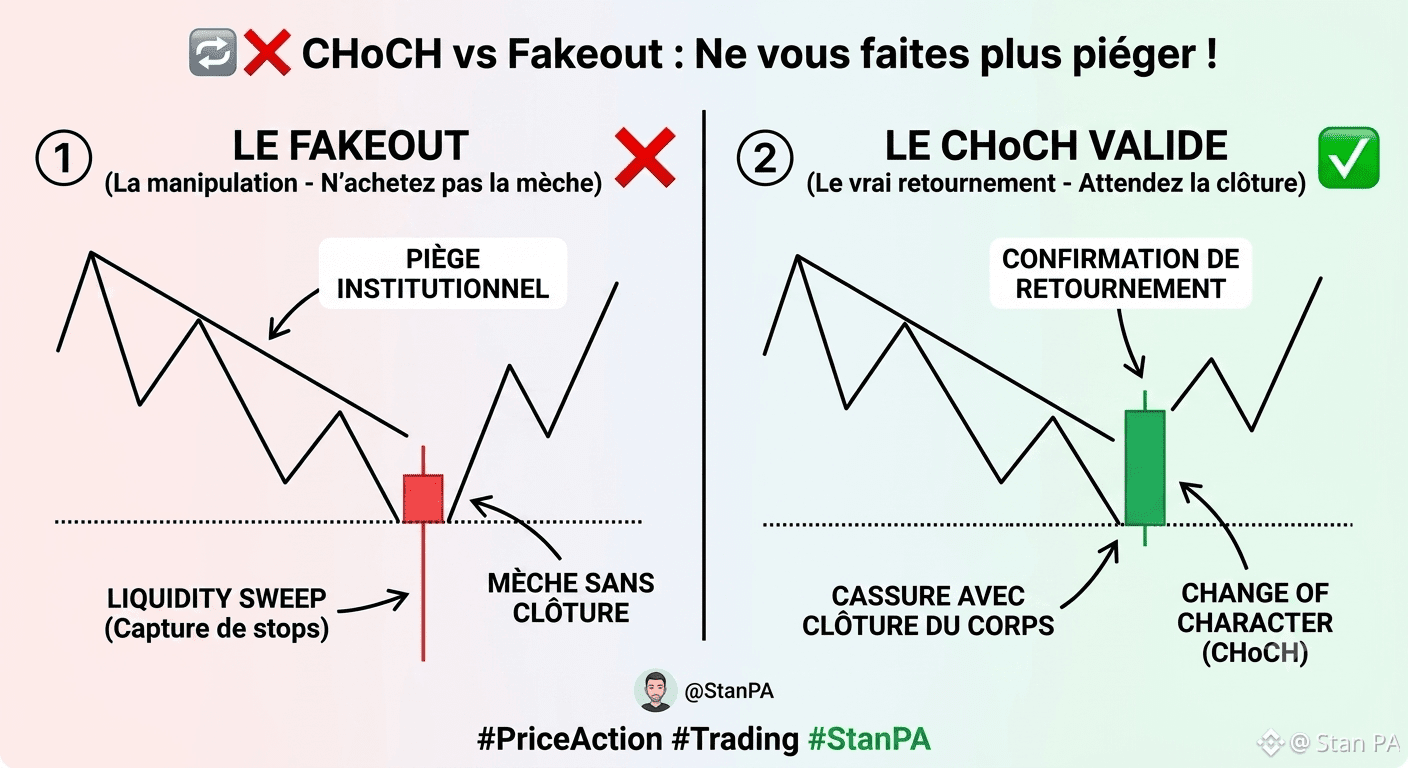
Price breaks above an old high or below an old low with an aggressive candle, but immediately re-enters the zone, leaving a long wick. Institutions simply trigger Stop-loss orders to recover liquidity (Liquidity Sweep). Never buy a breakout made by a wick!
2️⃣ The valid CHoCH (The real reversal):
For a trend change to be confirmed, price must break the most recent major high/low and close the body of its candle beyond that level on a higher timeframe (1H or 4H). The move should come with strong momentum, often leaving a Fair Value Gap (FVG) behind it.
My advice: Be patient. Always wait for the candle close to confirm your intention. If it wicks, it’s a manipulation. If it closes strongly, the market is changing direction and you can look for a retest to enter.
⚠️ Theoretical educational example only, absolutely not investment advice. Protect your capital.
💬 Have you already been trapped by a fake breakout this week? Share your experience in the comments! 👇
#PriceAction #Trading #StanPA #crypto $BTC
🔄❌ CHoCH vs Fakeout : Don’t let yourself be tricked by false breakouts anymore!
In Price Action, the CHoCH (Change of Character) is the ultimate signal that indicates a trend is in the process of reversing. The problem? Many beginners confuse a real reversal with a Fakeout (an institutional trap) and lose their capital. 🏛️⚠️
Here’s how to sort it out so you only keep the best trades:
1️⃣ The Fakeout (The manipulation):
Price breaks above an old high or below an old low with an aggressive candle, but immediately re-enters the zone, leaving a long wick. Institutions simply trigger Stop-loss orders to recover liquidity (Liquidity Sweep). Never buy a breakout made by a wick!
2️⃣ The valid CHoCH (The real reversal):
For a trend change to be confirmed, price must break the most recent major high/low and close the body of its candle beyond that level on a higher timeframe (1H or 4H). The move should come with strong momentum, often leaving a Fair Value Gap (FVG) behind it.
My advice: Be patient. Always wait for the candle close to confirm your intention. If it wicks, it’s a manipulation. If it closes strongly, the market is changing direction and you can look for a retest to enter.
⚠️ Theoretical educational example only, absolutely not investment advice. Protect your capital.
💬 Have you already been trapped by a fake breakout this week? Share your experience in the comments! 👇
#PriceAction #Trading #StanPA #crypto $BTC
In Price Action, the CHoCH (Change of Character) is the ultimate signal that indicates a trend is in the process of reversing. The problem? Many beginners confuse a real reversal with a Fakeout (an institutional trap) and lose their capital. 🏛️⚠️
Here’s how to sort it out so you only keep the best trades:
1️⃣ The Fakeout (The manipulation):
Price breaks above an old high or below an old low with an aggressive candle, but immediately re-enters the zone, leaving a long wick. Institutions simply trigger Stop-loss orders to recover liquidity (Liquidity Sweep). Never buy a breakout made by a wick!
2️⃣ The valid CHoCH (The real reversal):
For a trend change to be confirmed, price must break the most recent major high/low and close the body of its candle beyond that level on a higher timeframe (1H or 4H). The move should come with strong momentum, often leaving a Fair Value Gap (FVG) behind it.
My advice: Be patient. Always wait for the candle close to confirm your intention. If it wicks, it’s a manipulation. If it closes strongly, the market is changing direction and you can look for a retest to enter.
⚠️ Theoretical educational example only, absolutely not investment advice. Protect your capital.
💬 Have you already been trapped by a fake breakout this week? Share your experience in the comments! 👇
#PriceAction #Trading #StanPA #crypto $BTC
1
77
·
--
📊🤔 Accumulation or Distribution? Don’t get it wrong anymore!
In Price Action, the market spends 80% of its time in a range (sideways consolidation). The key is to know whether institutions are accumulating tokens or distributing (selling) them to retail traders. 🏛️🐋
Here’s how to tell the difference:
1️⃣ Accumulation (Bullish Bias):
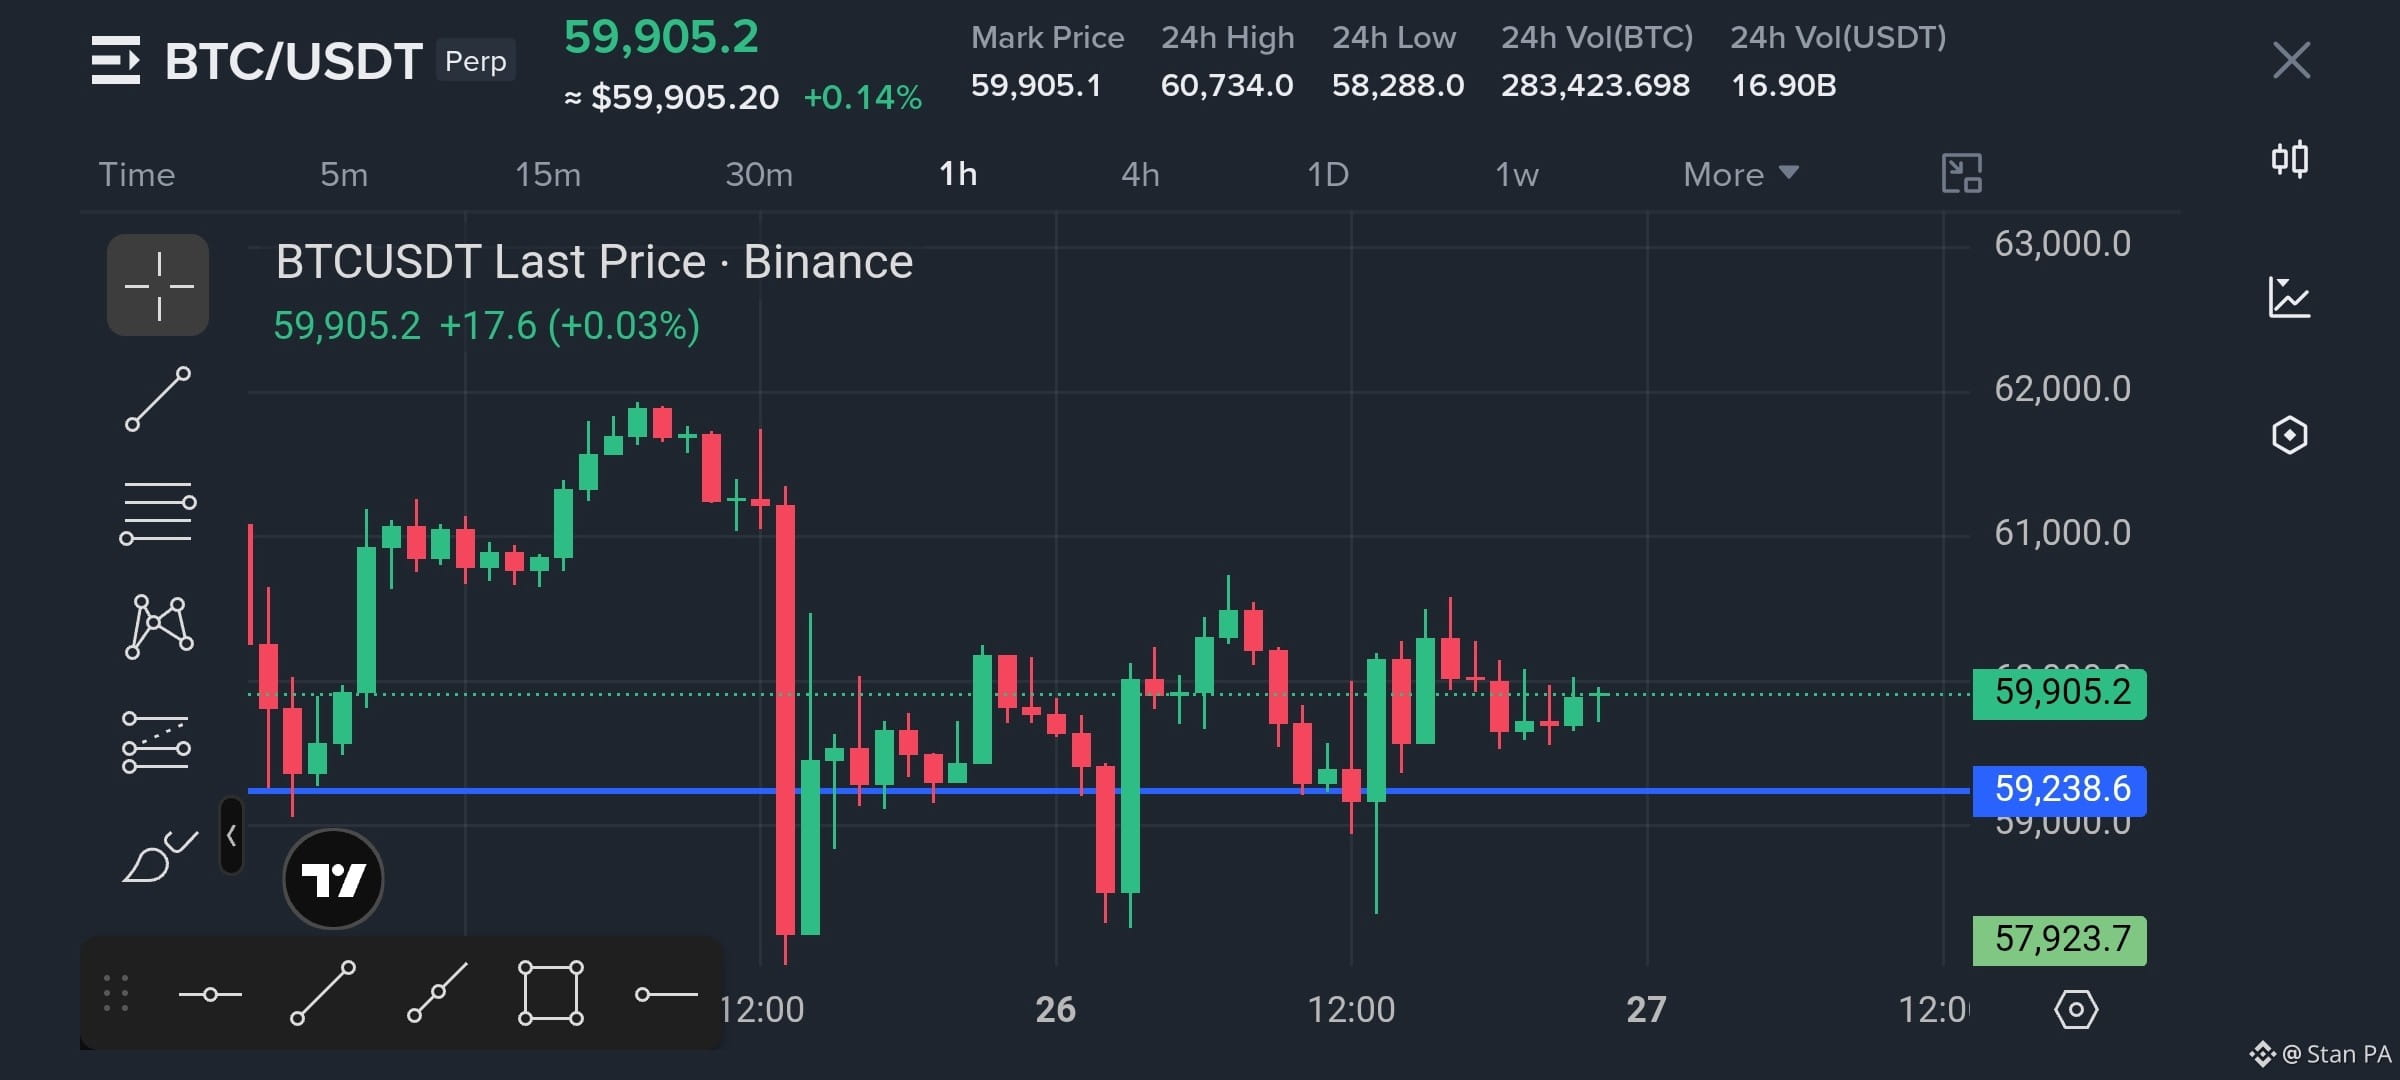
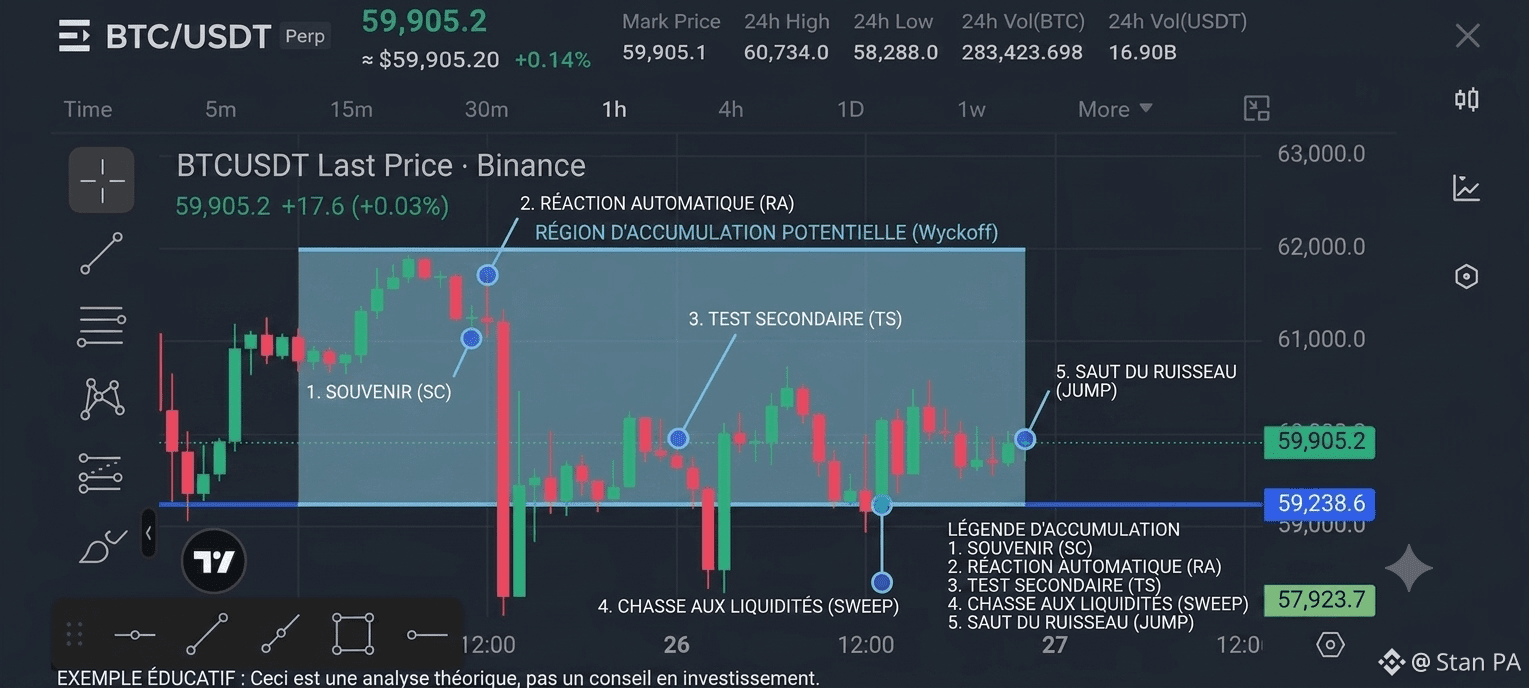
Price creates deeper lows that are higher and higher within the range. Sellers get exhausted, and buyers defend levels that become increasingly higher. You often see a fake breakdown to the downside (our famous Liquidity Sweep) just before the bullish breakout.
2️⃣ Distribution (Bearish Bias):
Price creates highs that are getting lower and lower. Buyers no longer have the strength to push the price up. Conversely, you often see a fake breakout to the upside (an Upthrust) to trap buyers who are chasing FOMO—before the market collapses.
My advice: Don’t guess the exit from the range. Wait patiently for a streak of manipulation to occur on one side, then position yourself in the opposite direction alongside the institutions.
⚠️ Theoretical educational example only—not investment advice. Do your own research.
💬 Right now on BTC, do you see accumulation or distribution? Share your thoughts in the comments! 👇
Click Follow 🔔 so you don’t miss any Price Action secrets.
#PriceAction #Bitcoin $BTC #TechnicalAnalysis #StanPA #BinanceSquare
📊🤔 Accumulation or Distribution? Don’t get it wrong anymore!
In Price Action, the market spends 80% of its time in a range (sideways consolidation). The key is to know whether institutions are accumulating tokens or distributing (selling) them to retail traders. 🏛️🐋
Here’s how to tell the difference:
1️⃣ Accumulation (Bullish Bias):
Price creates deeper lows that are higher and higher within the range. Sellers get exhausted, and buyers defend levels that become increasingly higher. You often see a fake breakdown to the downside (our famous Liquidity Sweep) just before the bullish breakout.
2️⃣ Distribution (Bearish Bias):
Price creates highs that are getting lower and lower. Buyers no longer have the strength to push the price up. Conversely, you often see a fake breakout to the upside (an Upthrust) to trap buyers who are chasing FOMO—before the market collapses.
My advice: Don’t guess the exit from the range. Wait patiently for a streak of manipulation to occur on one side, then position yourself in the opposite direction alongside the institutions.
⚠️ Theoretical educational example only—not investment advice. Do your own research.
💬 Right now on BTC, do you see accumulation or distribution? Share your thoughts in the comments! 👇
Click Follow 🔔 so you don’t miss any Price Action secrets.
#PriceAction #Bitcoin $BTC #TechnicalAnalysis #StanPA #BinanceSquare
In Price Action, the market spends 80% of its time in a range (sideways consolidation). The key is to know whether institutions are accumulating tokens or distributing (selling) them to retail traders. 🏛️🐋
Here’s how to tell the difference:
1️⃣ Accumulation (Bullish Bias):
Price creates deeper lows that are higher and higher within the range. Sellers get exhausted, and buyers defend levels that become increasingly higher. You often see a fake breakdown to the downside (our famous Liquidity Sweep) just before the bullish breakout.
2️⃣ Distribution (Bearish Bias):
Price creates highs that are getting lower and lower. Buyers no longer have the strength to push the price up. Conversely, you often see a fake breakout to the upside (an Upthrust) to trap buyers who are chasing FOMO—before the market collapses.
My advice: Don’t guess the exit from the range. Wait patiently for a streak of manipulation to occur on one side, then position yourself in the opposite direction alongside the institutions.
⚠️ Theoretical educational example only—not investment advice. Do your own research.
💬 Right now on BTC, do you see accumulation or distribution? Share your thoughts in the comments! 👇
Click Follow 🔔 so you don’t miss any Price Action secrets.
#PriceAction #Bitcoin $BTC #TechnicalAnalysis #StanPA #BinanceSquare
78
·
--
📉🧱 The Support-to-Resistance Flip: Why old floors become new ceilings!
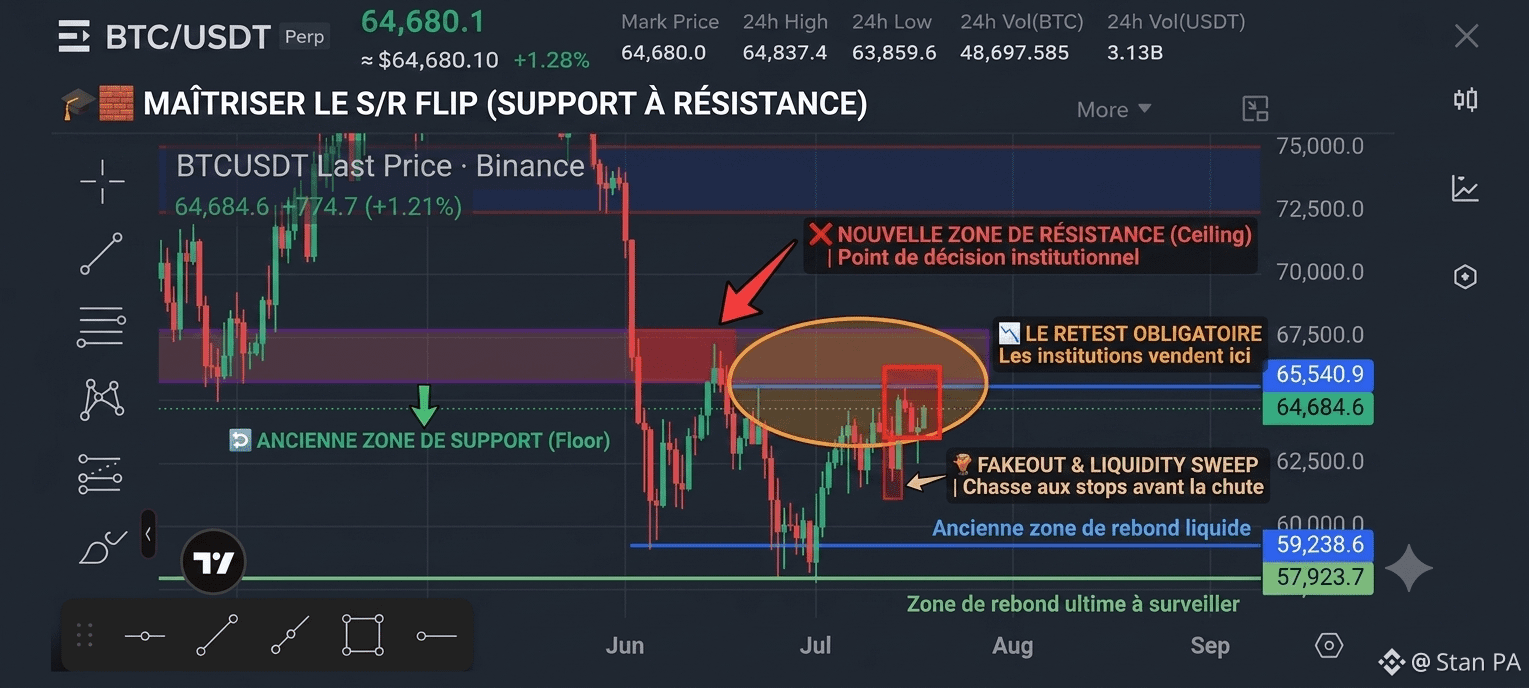
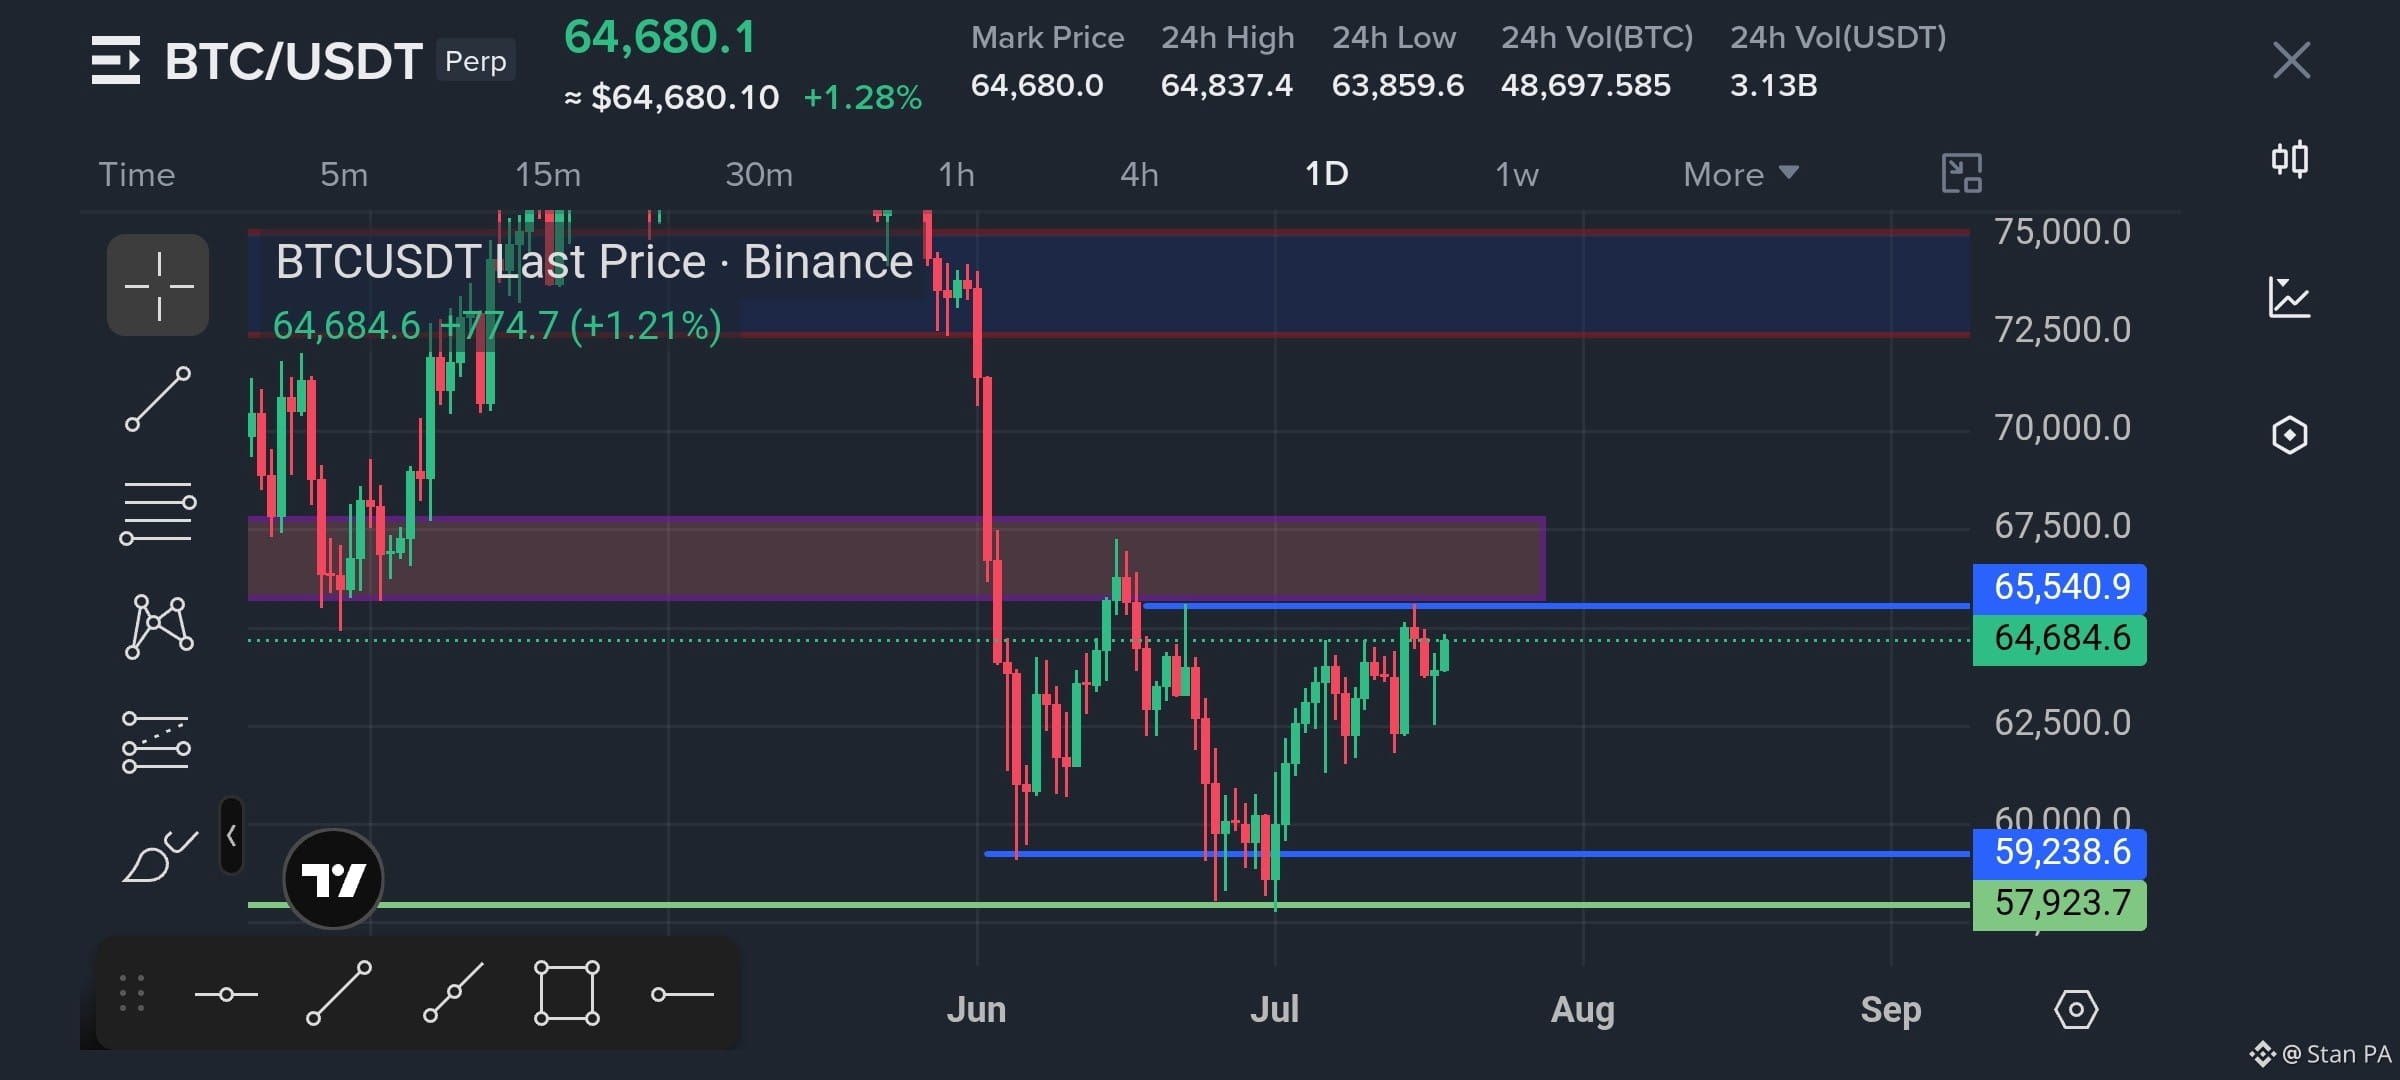
Look closely at this BTC/USDT Daily chart. It perfectly illustrates one of the most powerful concepts in Price Action: The S/R Flip. 🔄
When a key level changes polarity, it gives you crucial hints about institutional intent. Here is what is happening right now:
1️⃣ The Old Floor (Support Zone):
For weeks, the purple zone around $65,500 - $67,500 acted as a strong demand zone, holding the price up. Buyers kept absorbing the selling pressure... until the major breakdown in June. 📉
2️⃣ The Breakout & Liquidity Sweep:
The price didn't just drop; it went straight down to hunt liquidity below $60,000, sweeping the sell-stops before a solid technical rebound in July. 🪤💸
3️⃣ The New Ceiling (Resistance Flip):
Now, BTC is pulling back up to retest that exact same purple zone. This is the moment of truth. An old support level often turns into a major resistance zone because:
Traders trapped in longs during the drop use this bounce to break even.
Institutions look to fill new short orders at a premium price.
My advice: Watch the price reaction inside this purple box very closely. A rejection here with strong bearish candles (like an engulfing pattern) could confirm the bearish structure. A clean daily close above it, however, would signal a potential trap and a return to the highs.
Always trade what you see, not what you think. 🧠🛡️
⚠️ Educational content only. Not financial advice. Manage your risk.
💬 Do you think BTC will break through this major resistance, or are we heading for a rejection? Let me know your thoughts below! 👇
#PriceAction #Bitcoin #Trading #StanPA $BTC
{future}(BTCUSDT)
📉🧱 The Support-to-Resistance Flip: Why old floors become new ceilings!
Look closely at this BTC/USDT Daily chart. It perfectly illustrates one of the most powerful concepts in Price Action: The S/R Flip. 🔄
When a key level changes polarity, it gives you crucial hints about institutional intent. Here is what is happening right now:
1️⃣ The Old Floor (Support Zone):
For weeks, the purple zone around $65,500 - $67,500 acted as a strong demand zone, holding the price up. Buyers kept absorbing the selling pressure... until the major breakdown in June. 📉
2️⃣ The Breakout & Liquidity Sweep:
The price didn't just drop; it went straight down to hunt liquidity below $60,000, sweeping the sell-stops before a solid technical rebound in July. 🪤💸
3️⃣ The New Ceiling (Resistance Flip):
Now, BTC is pulling back up to retest that exact same purple zone. This is the moment of truth. An old support level often turns into a major resistance zone because:
Traders trapped in longs during the drop use this bounce to break even.
Institutions look to fill new short orders at a premium price.
My advice: Watch the price reaction inside this purple box very closely. A rejection here with strong bearish candles (like an engulfing pattern) could confirm the bearish structure. A clean daily close above it, however, would signal a potential trap and a return to the highs.
Always trade what you see, not what you think. 🧠🛡️
⚠️ Educational content only. Not financial advice. Manage your risk.
💬 Do you think BTC will break through this major resistance, or are we heading for a rejection? Let me know your thoughts below! 👇
#PriceAction #Bitcoin #Trading #StanPA $BTC
Look closely at this BTC/USDT Daily chart. It perfectly illustrates one of the most powerful concepts in Price Action: The S/R Flip. 🔄
When a key level changes polarity, it gives you crucial hints about institutional intent. Here is what is happening right now:
1️⃣ The Old Floor (Support Zone):
For weeks, the purple zone around $65,500 - $67,500 acted as a strong demand zone, holding the price up. Buyers kept absorbing the selling pressure... until the major breakdown in June. 📉
2️⃣ The Breakout & Liquidity Sweep:
The price didn't just drop; it went straight down to hunt liquidity below $60,000, sweeping the sell-stops before a solid technical rebound in July. 🪤💸
3️⃣ The New Ceiling (Resistance Flip):
Now, BTC is pulling back up to retest that exact same purple zone. This is the moment of truth. An old support level often turns into a major resistance zone because:
Traders trapped in longs during the drop use this bounce to break even.
Institutions look to fill new short orders at a premium price.
My advice: Watch the price reaction inside this purple box very closely. A rejection here with strong bearish candles (like an engulfing pattern) could confirm the bearish structure. A clean daily close above it, however, would signal a potential trap and a return to the highs.
Always trade what you see, not what you think. 🧠🛡️
⚠️ Educational content only. Not financial advice. Manage your risk.
💬 Do you think BTC will break through this major resistance, or are we heading for a rejection? Let me know your thoughts below! 👇
#PriceAction #Bitcoin #Trading #StanPA $BTC
52
·
--
⏳🔍 Multi-Timeframe Analysis: How ETH is approaching the ultimate Macro Decision Zone!
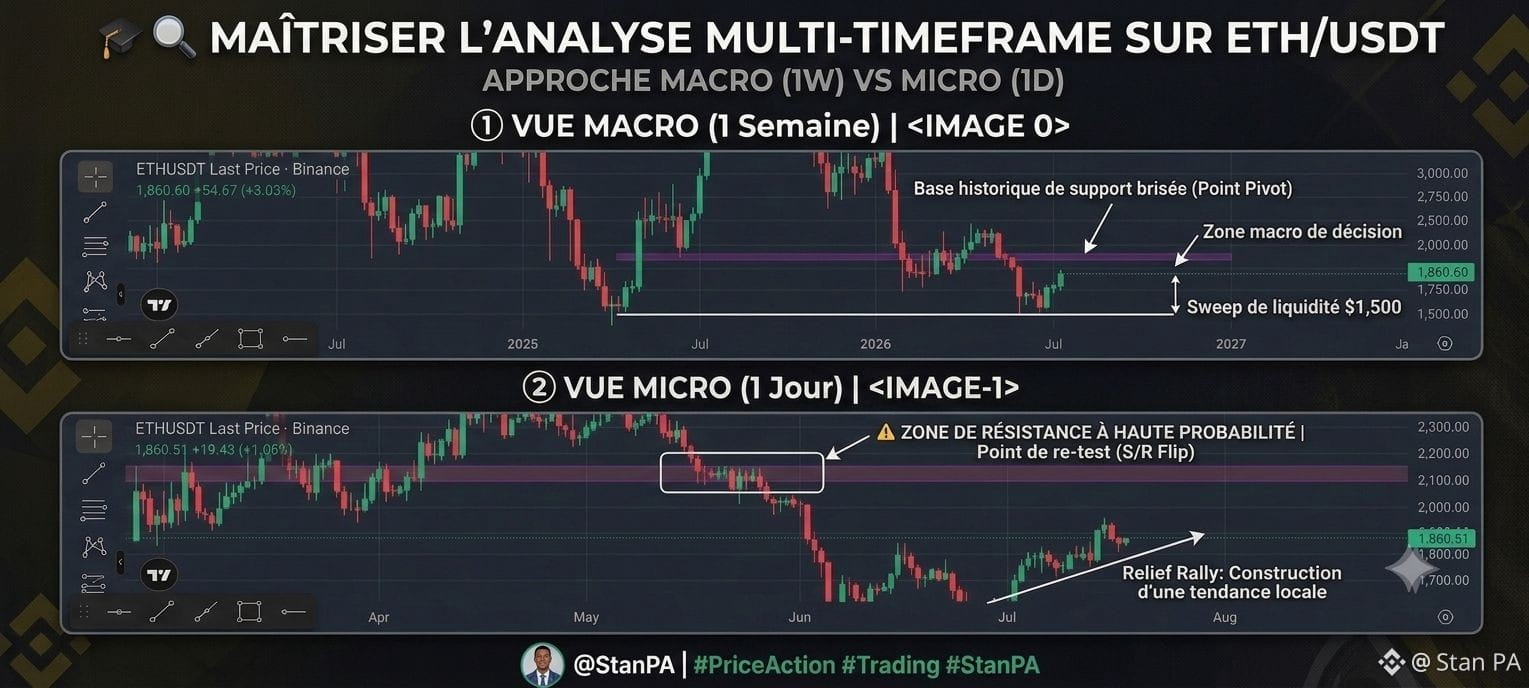
If you only trade one timeframe, you are trading with one eye closed. By combining the Weekly (1W) chart and the Daily (1D) chart on ETH/USDT, we get a crystal-clear look at institutional market structure.
Here is the breakdown of what the market is telling us right now:
1️⃣ The Macro View (1W Chart):
Looking at the weekly perspective, the purple box around $2,100 - $2,180 is a major historical pivot zone. It previously acted as a strong baseline support throughout 2025 and early 2026 before being aggressively broken to the downside. The recent drop swept liquidity all the way down to the $1,500 region, putting in a solid macro bottom.
2️⃣ The Micro Refinement (1D Chart):
Zooming into the daily view, we can clearly see the aggressive technical relief rally under construction since July. ETH is putting in higher lows and driving upward momentum. However, it is now directly eyeing that major overhead purple resistance band.
3️⃣ The Polarity Flip (S/R Flip):
Just like we saw recently on BTC, this old weekly support is highly likely to act as major supply (resistance) upon the first retest. Short-term buyers who caught the $1,500 bottom will look to take profits here, while institutional bears might look for premium short entries.
My Strategy:
Do not FOMO into long positions right below a major weekly resistance zone. The smart play is to wait and watch how the daily candles react inside the $2,100 - $2,180 zone. A clean daily breakout and flip into support opens the door for a massive continuation. A harsh rejection, however, means we sweep lower ranges first. 🧠🛡️
⚠️ Educational purposes only. Not financial advice. Protect your capital.
💬 Are you bullish enough to think ETH will blast straight through this weekly resistance, or are you waiting for a pullback? Let me know below! 👇
#PriceAction #Ethereum #Trading #TechnicalAnalysis #StanPA $ETH
{future}(ETHUSDT)
⏳🔍 Multi-Timeframe Analysis: How ETH is approaching the ultimate Macro Decision Zone!
If you only trade one timeframe, you are trading with one eye closed. By combining the Weekly (1W) chart and the Daily (1D) chart on ETH/USDT, we get a crystal-clear look at institutional market structure.
Here is the breakdown of what the market is telling us right now:
1️⃣ The Macro View (1W Chart):
Looking at the weekly perspective, the purple box around $2,100 - $2,180 is a major historical pivot zone. It previously acted as a strong baseline support throughout 2025 and early 2026 before being aggressively broken to the downside. The recent drop swept liquidity all the way down to the $1,500 region, putting in a solid macro bottom.
2️⃣ The Micro Refinement (1D Chart):
Zooming into the daily view, we can clearly see the aggressive technical relief rally under construction since July. ETH is putting in higher lows and driving upward momentum. However, it is now directly eyeing that major overhead purple resistance band.
3️⃣ The Polarity Flip (S/R Flip):
Just like we saw recently on BTC, this old weekly support is highly likely to act as major supply (resistance) upon the first retest. Short-term buyers who caught the $1,500 bottom will look to take profits here, while institutional bears might look for premium short entries.
My Strategy:
Do not FOMO into long positions right below a major weekly resistance zone. The smart play is to wait and watch how the daily candles react inside the $2,100 - $2,180 zone. A clean daily breakout and flip into support opens the door for a massive continuation. A harsh rejection, however, means we sweep lower ranges first. 🧠🛡️
⚠️ Educational purposes only. Not financial advice. Protect your capital.
💬 Are you bullish enough to think ETH will blast straight through this weekly resistance, or are you waiting for a pullback? Let me know below! 👇
#PriceAction #Ethereum #Trading #TechnicalAnalysis #StanPA $ETH
If you only trade one timeframe, you are trading with one eye closed. By combining the Weekly (1W) chart and the Daily (1D) chart on ETH/USDT, we get a crystal-clear look at institutional market structure.
Here is the breakdown of what the market is telling us right now:
1️⃣ The Macro View (1W Chart):
Looking at the weekly perspective, the purple box around $2,100 - $2,180 is a major historical pivot zone. It previously acted as a strong baseline support throughout 2025 and early 2026 before being aggressively broken to the downside. The recent drop swept liquidity all the way down to the $1,500 region, putting in a solid macro bottom.
2️⃣ The Micro Refinement (1D Chart):
Zooming into the daily view, we can clearly see the aggressive technical relief rally under construction since July. ETH is putting in higher lows and driving upward momentum. However, it is now directly eyeing that major overhead purple resistance band.
3️⃣ The Polarity Flip (S/R Flip):
Just like we saw recently on BTC, this old weekly support is highly likely to act as major supply (resistance) upon the first retest. Short-term buyers who caught the $1,500 bottom will look to take profits here, while institutional bears might look for premium short entries.
My Strategy:
Do not FOMO into long positions right below a major weekly resistance zone. The smart play is to wait and watch how the daily candles react inside the $2,100 - $2,180 zone. A clean daily breakout and flip into support opens the door for a massive continuation. A harsh rejection, however, means we sweep lower ranges first. 🧠🛡️
⚠️ Educational purposes only. Not financial advice. Protect your capital.
💬 Are you bullish enough to think ETH will blast straight through this weekly resistance, or are you waiting for a pullback? Let me know below! 👇
#PriceAction #Ethereum #Trading #TechnicalAnalysis #StanPA $ETH
66
·
--
🕯️🧠 Stop just looking at the colors: Learn to READ candles!
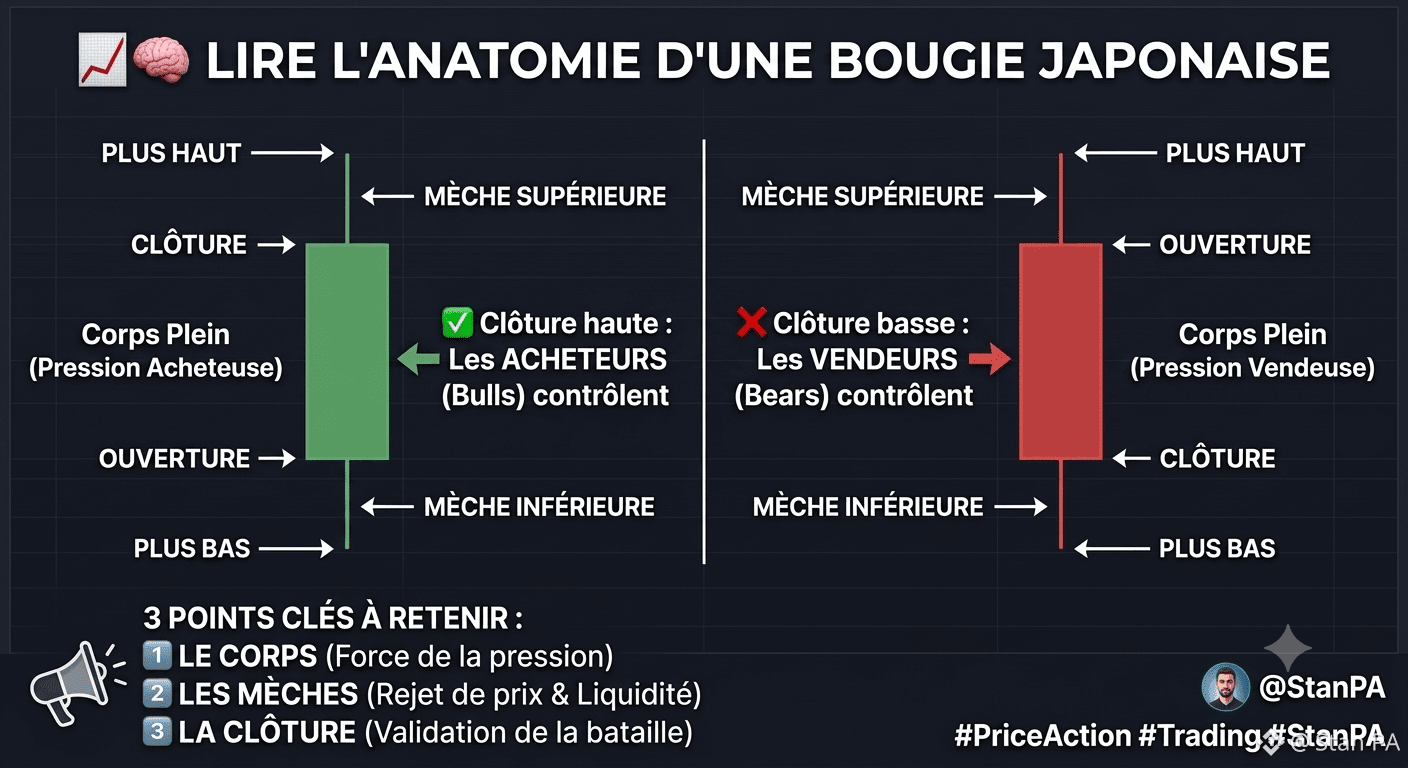
In Price Action, a Japanese candlestick is not just a green or red rectangle. It’s a mine of information that shows you in real time who is taking control of the market: buyers (Bulls) or sellers (Bears).
⚔️📈If you don’t know how to decode their anatomy, you’re trading blindly. Here are the 3 key elements to analyze:
1️⃣ The Body (The winner of the battle):
The longer and fuller the candlestick body is, the stronger the pressure (buying or selling) is and the more it holds throughout the entire time unit. A large green body shows that buyers crushed sellers without hesitation.
2️⃣ The Wicks (Rejection and liquidity):
This is the most important area. A long wick at the top or bottom indicates massive rejection. If the price spikes very high but closes near the bottom, leaving a huge upper wick, it means institutions distributed or absorbed the orders. This is often where Fakeouts are hiding!
3️⃣ The Close (The final decision):
It’s the closing price that validates everything. A candle that closes near its high shows healthy momentum. A candle that deflates before the close tells you: "Warning, the move is losing steam."
My advice: Never enter a trade based on a candle that’s still forming. ALWAYS wait for the close. That’s what delivers the final verdict of the confrontation.
⚠️ Educational example only, not investment advice. Get trained before risking your capital.
#PriceAction #Trading #StanPA $BTC
🕯️🧠 Stop just looking at the colors: Learn to READ candles!
In Price Action, a Japanese candlestick is not just a green or red rectangle. It’s a mine of information that shows you in real time who is taking control of the market: buyers (Bulls) or sellers (Bears).
⚔️📈If you don’t know how to decode their anatomy, you’re trading blindly. Here are the 3 key elements to analyze:
1️⃣ The Body (The winner of the battle):
The longer and fuller the candlestick body is, the stronger the pressure (buying or selling) is and the more it holds throughout the entire time unit. A large green body shows that buyers crushed sellers without hesitation.
2️⃣ The Wicks (Rejection and liquidity):
This is the most important area. A long wick at the top or bottom indicates massive rejection. If the price spikes very high but closes near the bottom, leaving a huge upper wick, it means institutions distributed or absorbed the orders. This is often where Fakeouts are hiding!
3️⃣ The Close (The final decision):
It’s the closing price that validates everything. A candle that closes near its high shows healthy momentum. A candle that deflates before the close tells you: "Warning, the move is losing steam."
My advice: Never enter a trade based on a candle that’s still forming. ALWAYS wait for the close. That’s what delivers the final verdict of the confrontation.
⚠️ Educational example only, not investment advice. Get trained before risking your capital.
#PriceAction #Trading #StanPA $BTC
In Price Action, a Japanese candlestick is not just a green or red rectangle. It’s a mine of information that shows you in real time who is taking control of the market: buyers (Bulls) or sellers (Bears).
⚔️📈If you don’t know how to decode their anatomy, you’re trading blindly. Here are the 3 key elements to analyze:
1️⃣ The Body (The winner of the battle):
The longer and fuller the candlestick body is, the stronger the pressure (buying or selling) is and the more it holds throughout the entire time unit. A large green body shows that buyers crushed sellers without hesitation.
2️⃣ The Wicks (Rejection and liquidity):
This is the most important area. A long wick at the top or bottom indicates massive rejection. If the price spikes very high but closes near the bottom, leaving a huge upper wick, it means institutions distributed or absorbed the orders. This is often where Fakeouts are hiding!
3️⃣ The Close (The final decision):
It’s the closing price that validates everything. A candle that closes near its high shows healthy momentum. A candle that deflates before the close tells you: "Warning, the move is losing steam."
My advice: Never enter a trade based on a candle that’s still forming. ALWAYS wait for the close. That’s what delivers the final verdict of the confrontation.
⚠️ Educational example only, not investment advice. Get trained before risking your capital.
#PriceAction #Trading #StanPA $BTC
110
·
--
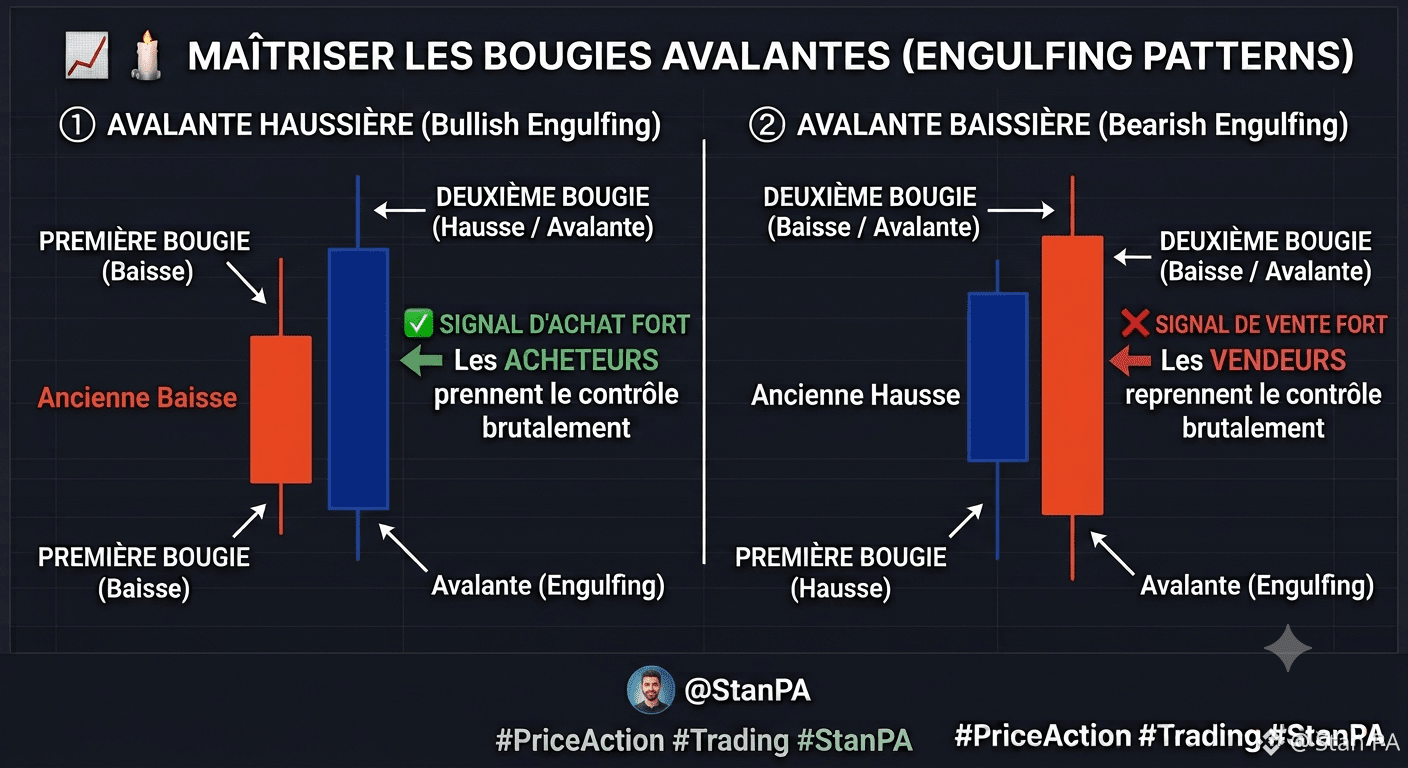
💥🕯️ The Engulfing Pattern (Bullish/Bearish): The signal where institutions overturn the market!
If there’s one candlestick pattern you absolutely must master in Price Action, it’s the Engulfing pattern. This two-candle signal shows an immediate and brutal transfer of power between buyers and sellers.
🏛️🔄 Here’s how to spot and trade this high-probability signal:
1️⃣ Bullish Engulfing:
After a decline, a red candle is followed by a large green candle whose body completely “engulfs” the body of the previous candle. This shows that buyers have fully absorbed the sell orders and are taking control aggressively.
2️⃣ Bearish Engulfing:
At the end of an uptrend, a green candle is followed by a large red candle that completely engulfs the previous candle. This is the signal that institutions cut the engines and massively distribute their positions.
The trap to avoid: Never trade an engulfing pattern out of nowhere. It only matters if it occurs in a key strategic zone—at a major Support/Resistance level, within an Order Block, or right after a Liquidity Sweep (stop hunt).
⚠️ Theoretical educational example only, not investment advice. Always protect your capital with a stop-loss.
💬 Do you already use engulfing candles in your trading strategy? Tell me in the comments! 👇
#PriceAction #Trading #StanPA #BinanceSquare $BNB $BTC $ETH
💥🕯️ The Engulfing Pattern (Bullish/Bearish): The signal where institutions overturn the market!
If there’s one candlestick pattern you absolutely must master in Price Action, it’s the Engulfing pattern. This two-candle signal shows an immediate and brutal transfer of power between buyers and sellers.
🏛️🔄 Here’s how to spot and trade this high-probability signal:
1️⃣ Bullish Engulfing:
After a decline, a red candle is followed by a large green candle whose body completely “engulfs” the body of the previous candle. This shows that buyers have fully absorbed the sell orders and are taking control aggressively.
2️⃣ Bearish Engulfing:
At the end of an uptrend, a green candle is followed by a large red candle that completely engulfs the previous candle. This is the signal that institutions cut the engines and massively distribute their positions.
The trap to avoid: Never trade an engulfing pattern out of nowhere. It only matters if it occurs in a key strategic zone—at a major Support/Resistance level, within an Order Block, or right after a Liquidity Sweep (stop hunt).
⚠️ Theoretical educational example only, not investment advice. Always protect your capital with a stop-loss.
💬 Do you already use engulfing candles in your trading strategy? Tell me in the comments! 👇
#PriceAction #Trading #StanPA #BinanceSquare $BNB $BTC $ETH
If there’s one candlestick pattern you absolutely must master in Price Action, it’s the Engulfing pattern. This two-candle signal shows an immediate and brutal transfer of power between buyers and sellers.
🏛️🔄 Here’s how to spot and trade this high-probability signal:
1️⃣ Bullish Engulfing:
After a decline, a red candle is followed by a large green candle whose body completely “engulfs” the body of the previous candle. This shows that buyers have fully absorbed the sell orders and are taking control aggressively.
2️⃣ Bearish Engulfing:
At the end of an uptrend, a green candle is followed by a large red candle that completely engulfs the previous candle. This is the signal that institutions cut the engines and massively distribute their positions.
The trap to avoid: Never trade an engulfing pattern out of nowhere. It only matters if it occurs in a key strategic zone—at a major Support/Resistance level, within an Order Block, or right after a Liquidity Sweep (stop hunt).
⚠️ Theoretical educational example only, not investment advice. Always protect your capital with a stop-loss.
💬 Do you already use engulfing candles in your trading strategy? Tell me in the comments! 👇
#PriceAction #Trading #StanPA #BinanceSquare $BNB $BTC $ETH
107
·
--
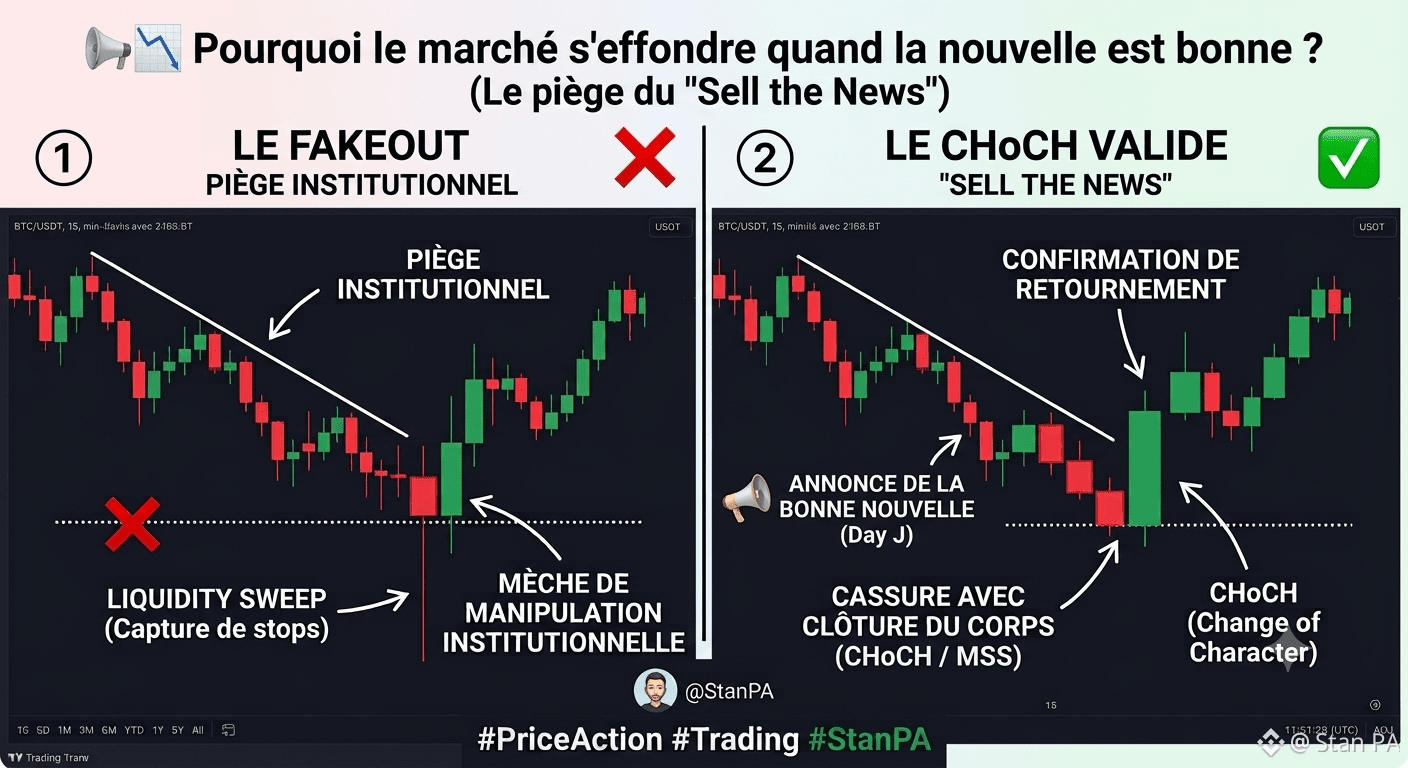
📢📉 Why the market crashes when the news is good? (The “Sell the News” trap)
Have you ever bought a crypto because an incredible announcement was about to drop... only to see its price crash as soon as the news was published? Welcome to institutional psychology. 🏛️🤯
Here’s how this unforgiving Price Action mechanism works:
1️⃣ Buy the rumor (Accumulation):
As soon as rumors or partnership announcements start circulating, algorithms and insiders discreetly accumulate the asset. The price rises little by little, fueled by the speculation of retail traders hoping for the deal of the century.
2️⃣ Sell the news (Distribution):
The big day arrives—the news is official and excellent. It’s euphoria; the general public rushes into the asset out of fear of missing the train (FOMO). This is exactly the moment institutions choose to massively sell their positions to these late buyers. The price crashes right in the middle of good news.
My advice: Don’t be someone else’s liquidity. If the news is public, it’s already too late to buy. Learn to spot the chart phases of accumulation before everyone starts talking about it—and protect your capital when euphoria is at its peak.
⚠️ Educational example only, not investment advice. Trading involves risk.
💬 Which crypto have you already been trapped by with “Buy the rumor, sell the news”? Tell us in the comments! 👇
#PriceAction #Trading #StanPA $BTC #Bitcoin $BNB $ETH
📢📉 Why the market crashes when the news is good? (The “Sell the News” trap)
Have you ever bought a crypto because an incredible announcement was about to drop... only to see its price crash as soon as the news was published? Welcome to institutional psychology. 🏛️🤯
Here’s how this unforgiving Price Action mechanism works:
1️⃣ Buy the rumor (Accumulation):
As soon as rumors or partnership announcements start circulating, algorithms and insiders discreetly accumulate the asset. The price rises little by little, fueled by the speculation of retail traders hoping for the deal of the century.
2️⃣ Sell the news (Distribution):
The big day arrives—the news is official and excellent. It’s euphoria; the general public rushes into the asset out of fear of missing the train (FOMO). This is exactly the moment institutions choose to massively sell their positions to these late buyers. The price crashes right in the middle of good news.
My advice: Don’t be someone else’s liquidity. If the news is public, it’s already too late to buy. Learn to spot the chart phases of accumulation before everyone starts talking about it—and protect your capital when euphoria is at its peak.
⚠️ Educational example only, not investment advice. Trading involves risk.
💬 Which crypto have you already been trapped by with “Buy the rumor, sell the news”? Tell us in the comments! 👇
#PriceAction #Trading #StanPA $BTC #Bitcoin $BNB $ETH
Have you ever bought a crypto because an incredible announcement was about to drop... only to see its price crash as soon as the news was published? Welcome to institutional psychology. 🏛️🤯
Here’s how this unforgiving Price Action mechanism works:
1️⃣ Buy the rumor (Accumulation):
As soon as rumors or partnership announcements start circulating, algorithms and insiders discreetly accumulate the asset. The price rises little by little, fueled by the speculation of retail traders hoping for the deal of the century.
2️⃣ Sell the news (Distribution):
The big day arrives—the news is official and excellent. It’s euphoria; the general public rushes into the asset out of fear of missing the train (FOMO). This is exactly the moment institutions choose to massively sell their positions to these late buyers. The price crashes right in the middle of good news.
My advice: Don’t be someone else’s liquidity. If the news is public, it’s already too late to buy. Learn to spot the chart phases of accumulation before everyone starts talking about it—and protect your capital when euphoria is at its peak.
⚠️ Educational example only, not investment advice. Trading involves risk.
💬 Which crypto have you already been trapped by with “Buy the rumor, sell the news”? Tell us in the comments! 👇
#PriceAction #Trading #StanPA $BTC #Bitcoin $BNB $ETH
1
1
183
·
--
🚀 Analyse ETH/USDT: Decoding key zones for beginners
The Ethereum market is currently at a major decision point. To understand what’s at stake, you need to look at the correlation between the “Macro” (weekly) and “Micro” (daily) timeframes.
📊 What the charts say:
The Macro structure (1W): Ethereum is moving within a major Support/Resistance (S/R) zone located between $1300 and $2000. This zone defines the overall price structure in the long term.
Price action (1D): The movements on the daily chart confirm micro-breaks within these weekly zones, helping us identify more precise entry points.
Current status: The price is currently testing the lower limit of our main S/R zone on both of these timeframes.
💡 The “Stan PA” advice:
Never trade blindly. When the price returns to a weekly S/R zone (the “Macro”), observe how it reacts on shorter timeframes (the “Micro”) before validating a setup.
Testing this zone is a critical moment to watch for a possible bounce or trend continuation.
And you, what’s your strategy for ETH right now? Buying at a support zone or waiting for confirmation? Tell me in the comments! 👇
#Ethereum #Trading #AnalyseTechnique #BinanceSquare #StanPA $ETH
{spot}(ETHUSDT)
🚀 Analyse ETH/USDT: Decoding key zones for beginners
The Ethereum market is currently at a major decision point. To understand what’s at stake, you need to look at the correlation between the “Macro” (weekly) and “Micro” (daily) timeframes.
📊 What the charts say:
The Macro structure (1W): Ethereum is moving within a major Support/Resistance (S/R) zone located between $1300 and $2000. This zone defines the overall price structure in the long term.
Price action (1D): The movements on the daily chart confirm micro-breaks within these weekly zones, helping us identify more precise entry points.
Current status: The price is currently testing the lower limit of our main S/R zone on both of these timeframes.
💡 The “Stan PA” advice:
Never trade blindly. When the price returns to a weekly S/R zone (the “Macro”), observe how it reacts on shorter timeframes (the “Micro”) before validating a setup.
Testing this zone is a critical moment to watch for a possible bounce or trend continuation.
And you, what’s your strategy for ETH right now? Buying at a support zone or waiting for confirmation? Tell me in the comments! 👇
#Ethereum #Trading #AnalyseTechnique #BinanceSquare #StanPA $ETH
The Ethereum market is currently at a major decision point. To understand what’s at stake, you need to look at the correlation between the “Macro” (weekly) and “Micro” (daily) timeframes.
📊 What the charts say:
The Macro structure (1W): Ethereum is moving within a major Support/Resistance (S/R) zone located between $1300 and $2000. This zone defines the overall price structure in the long term.
Price action (1D): The movements on the daily chart confirm micro-breaks within these weekly zones, helping us identify more precise entry points.
Current status: The price is currently testing the lower limit of our main S/R zone on both of these timeframes.
💡 The “Stan PA” advice:
Never trade blindly. When the price returns to a weekly S/R zone (the “Macro”), observe how it reacts on shorter timeframes (the “Micro”) before validating a setup.
Testing this zone is a critical moment to watch for a possible bounce or trend continuation.
And you, what’s your strategy for ETH right now? Buying at a support zone or waiting for confirmation? Tell me in the comments! 👇
#Ethereum #Trading #AnalyseTechnique #BinanceSquare #StanPA $ETH
206
Log in to explore more content
Join global crypto users on Binance Square
⚡️ Get latest and useful information about crypto.
💬 Trusted by the world’s largest crypto exchange.
👍 Discover real insights from verified creators.
Email / Phone number
Trending Topics
1
#US10YearYieldNears5.3%
17 views
9 Discussing
2
#BitcoinETFsTake$6.34BillionInQ3
0 views
1 Discussing
3
#KoreaProposesTokenizingStocksAndBonds
19,527 views
297 Discussing
4
#MetaMaskExitsLidoValidatorsAfterSecurityIncident
84,505 views
1,013 Discussing
5
#MicronBeatsEarningsLiftsGuidance
49,160 views
779 Discussing
6
#CFTCSubmitsTwoEventContractRulesToWhiteHouse
33,127 views
630 Discussing
7
#BitcoinClears$85200
38,862 views
364 Discussing
8
#AltcoinSeasonIndexHoldsAbove60For5Days
184,456 views
2,233 Discussing
9
#USADPAdds90000JobsInSeptember
86,674 views
1,265 Discussing
10
#USCorePCEEasesTo3%InAugust
61,463 views
817 Discussing