

#redseptember
redseptember
15.6M views
32,622 Discussing
Since 2013, Bitcoin has declined on average 3.7% in September, a pattern driven by investor psychology, profit-taking, and macro repositioning. Does the recent 107k align with that? if yes, how low BTC can drop before rebounding? drop you suggestions below
Hot
Latest

#RedSeptember
🚨September in the crypto market: anomaly or regular local base?🚨
$BTC $ETH $SUI
Every year at the beginning of autumn, the news flashes with predictions of an "inevitable fall". However, if you analyze the statistics without emotions, September is just a seasonal market readjustment.
📊Facts and metrics:
➡️ Historical win rate: in 60% of cases, September closes in the red zone.
➡️ Average delta: -2.9% (i.e., it is more often about local flat and shoulder knock-out than about a global dump).
➡️ Reason: profit fixation by large capital after summer movements and preparation for the opening of Q4.
🔍 What to pay attention to:
1. Macro indicators: the Fed meeting and inflation statistics in September traditionally set the vector for the entire risk segment.
2. Liquidity: September's range compression often forms a strong impulse for the fourth quarter.
3. Seasonal context: Historically, the September accumulation phase is followed by Uptober (+20% average return) and Moonvember.
⚠️🚦 Strategy:
September volatility is a time to work with risk levels, review setups, and find entry points into strong assets before Q4.🎯📈
{future}(SUIUSDT)
{future}(ETHUSDT)
{future}(BTCUSDT)
#RedSeptember
🚨September in the crypto market: anomaly or regular local base?🚨
$BTC $ETH $SUI
Every year at the beginning of autumn, the news flashes with predictions of an "inevitable fall". However, if you analyze the statistics without emotions, September is just a seasonal market readjustment.
📊Facts and metrics:
➡️ Historical win rate: in 60% of cases, September closes in the red zone.
➡️ Average delta: -2.9% (i.e., it is more often about local flat and shoulder knock-out than about a global dump).
➡️ Reason: profit fixation by large capital after summer movements and preparation for the opening of Q4.
🔍 What to pay attention to:
1. Macro indicators: the Fed meeting and inflation statistics in September traditionally set the vector for the entire risk segment.
2. Liquidity: September's range compression often forms a strong impulse for the fourth quarter.
3. Seasonal context: Historically, the September accumulation phase is followed by Uptober (+20% average return) and Moonvember.
⚠️🚦 Strategy:
September volatility is a time to work with risk levels, review setups, and find entry points into strong assets before Q4.🎯📈
🚨September in the crypto market: anomaly or regular local base?🚨
$BTC $ETH $SUI
Every year at the beginning of autumn, the news flashes with predictions of an "inevitable fall". However, if you analyze the statistics without emotions, September is just a seasonal market readjustment.
📊Facts and metrics:
➡️ Historical win rate: in 60% of cases, September closes in the red zone.
➡️ Average delta: -2.9% (i.e., it is more often about local flat and shoulder knock-out than about a global dump).
➡️ Reason: profit fixation by large capital after summer movements and preparation for the opening of Q4.
🔍 What to pay attention to:
1. Macro indicators: the Fed meeting and inflation statistics in September traditionally set the vector for the entire risk segment.
2. Liquidity: September's range compression often forms a strong impulse for the fourth quarter.
3. Seasonal context: Historically, the September accumulation phase is followed by Uptober (+20% average return) and Moonvember.
⚠️🚦 Strategy:
September volatility is a time to work with risk levels, review setups, and find entry points into strong assets before Q4.🎯📈

90

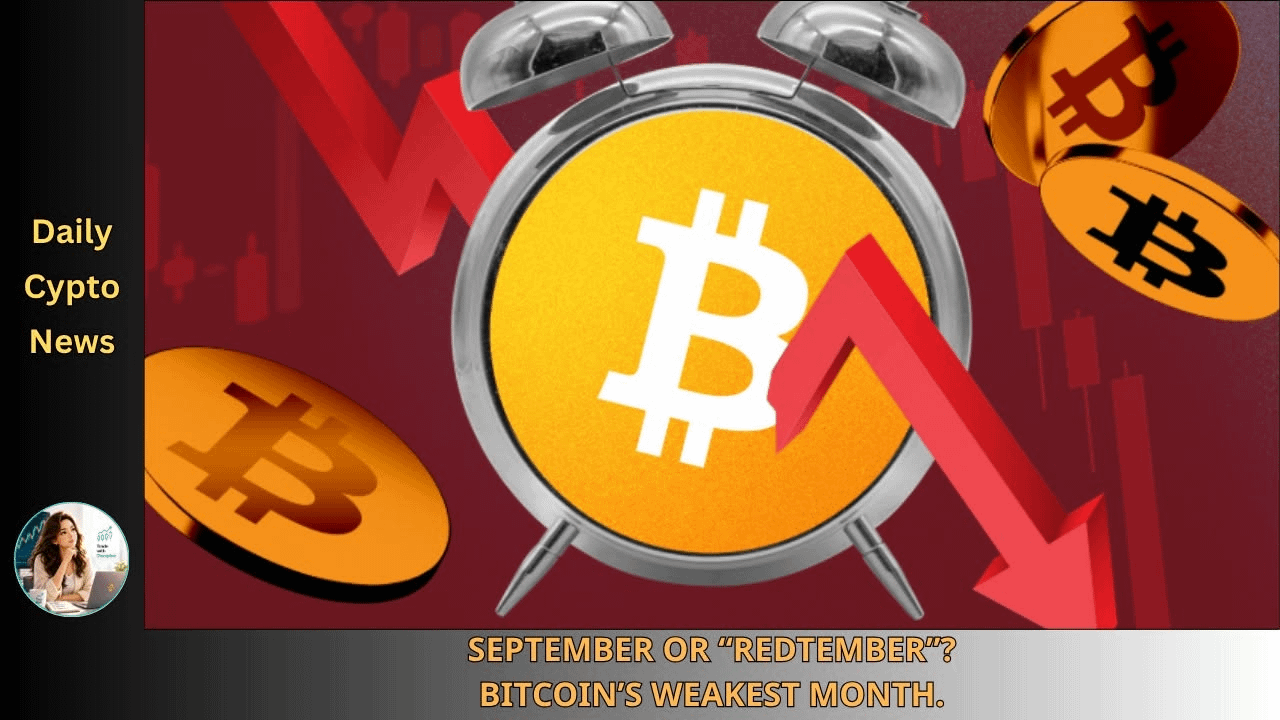
💥 September or “Redtember”? — Bitcoin’s Weakest Month.
September has earned its “Red September” reputation for a reason. Bitcoin has closed lower in 8 of the last 13 Septembers, with an average return of -2.97%, making it historically its weakest month. The S&P 500 has also posted a negative average return in September over long periods.
But seasonality is a tendency, not a forecast. September 2025 actually broke Bitcoin’s pattern, ending with a 5.16% gain.
This year, the setup also includes a potentially important Fed decision in mid-September, while U.S. stocks started the month lower as yields and oil prices rose.
Will September 2026 break the “Red September” pattern again?
#Bitcoin #RedSeptember #SP500 #MarketSeasonality
#ThuyBNB
$BTC $BNB $NEAR
💥 September or “Redtember”? — Bitcoin’s Weakest Month.
September has earned its “Red September” reputation for a reason. Bitcoin has closed lower in 8 of the last 13 Septembers, with an average return of -2.97%, making it historically its weakest month. The S&P 500 has also posted a negative average return in September over long periods.
But seasonality is a tendency, not a forecast. September 2025 actually broke Bitcoin’s pattern, ending with a 5.16% gain.
This year, the setup also includes a potentially important Fed decision in mid-September, while U.S. stocks started the month lower as yields and oil prices rose.
Will September 2026 break the “Red September” pattern again?
#Bitcoin #RedSeptember #SP500 #MarketSeasonality
#ThuyBNB
$BTC $BNB $NEAR
September has earned its “Red September” reputation for a reason. Bitcoin has closed lower in 8 of the last 13 Septembers, with an average return of -2.97%, making it historically its weakest month. The S&P 500 has also posted a negative average return in September over long periods.
But seasonality is a tendency, not a forecast. September 2025 actually broke Bitcoin’s pattern, ending with a 5.16% gain.
This year, the setup also includes a potentially important Fed decision in mid-September, while U.S. stocks started the month lower as yields and oil prices rose.
Will September 2026 break the “Red September” pattern again?
#Bitcoin #RedSeptember #SP500 #MarketSeasonality
#ThuyBNB
$BTC $BNB $NEAR
1
150

8/9
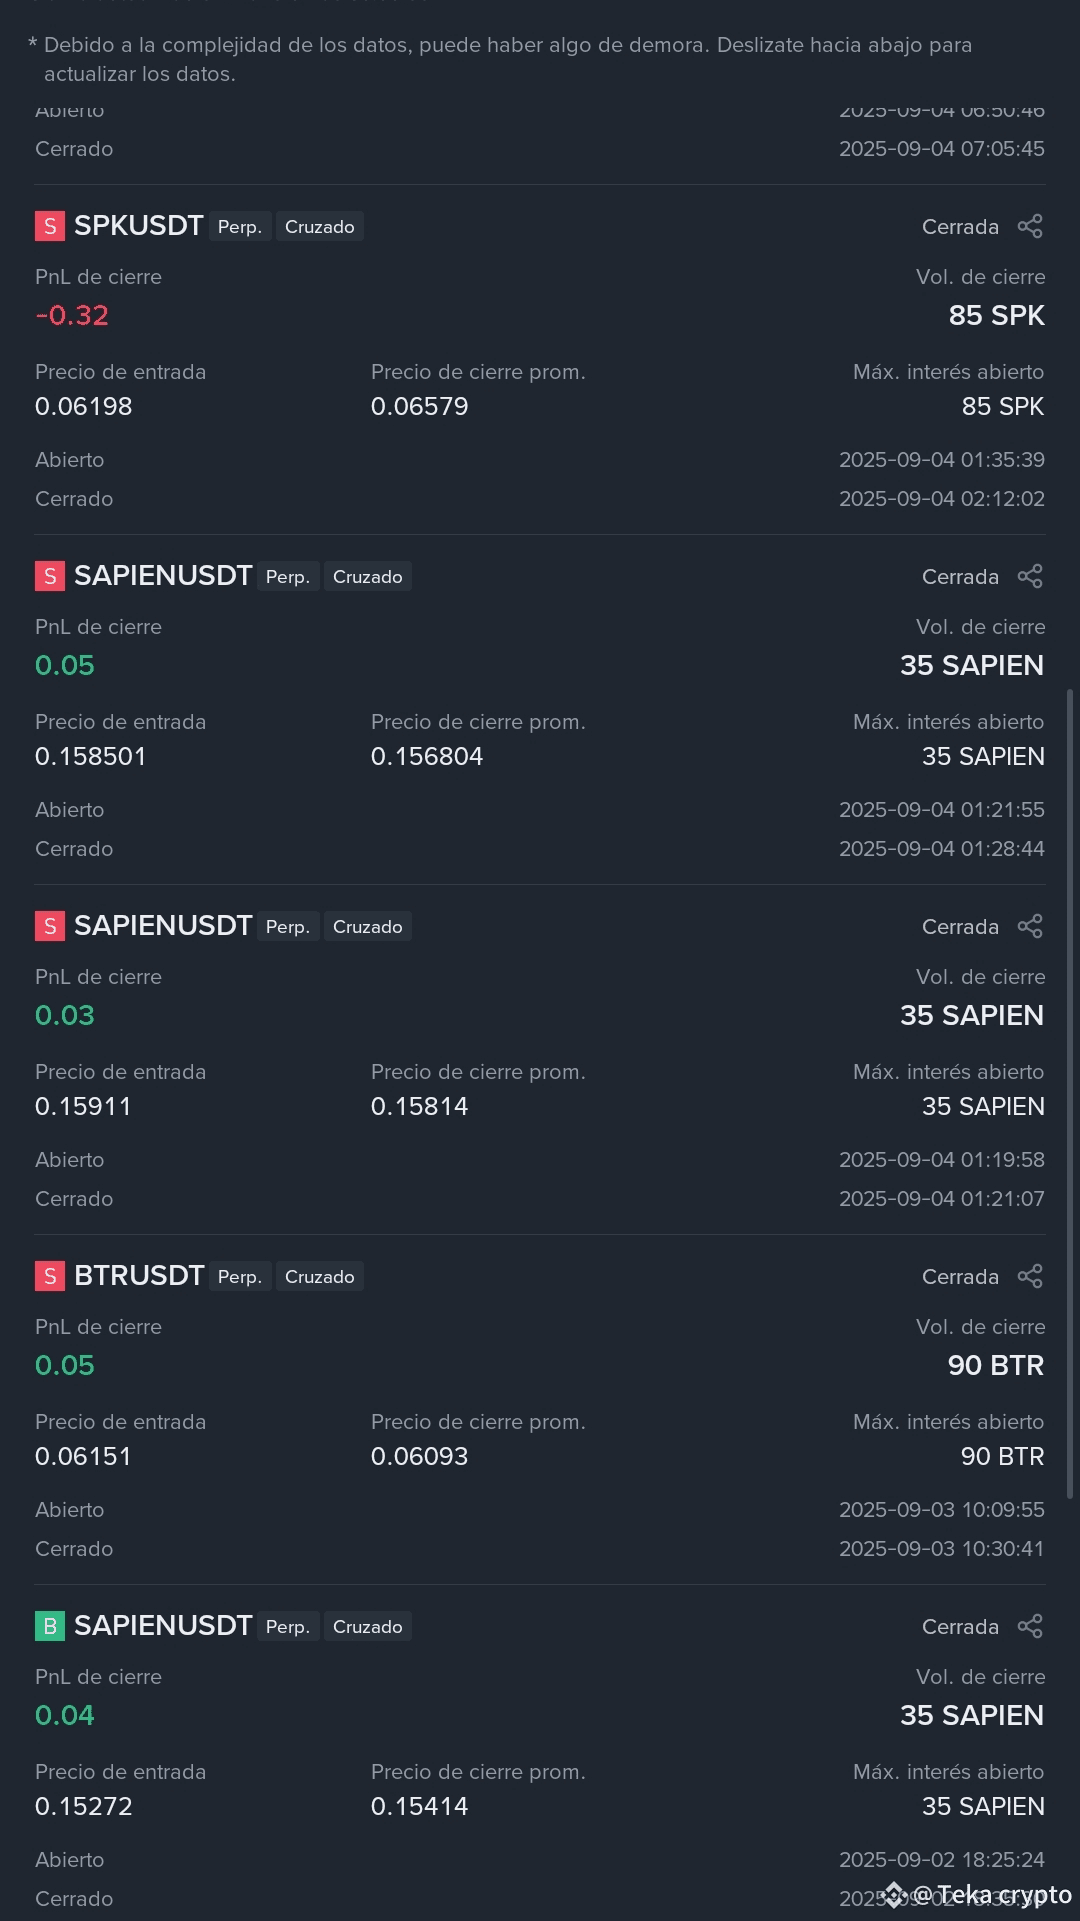
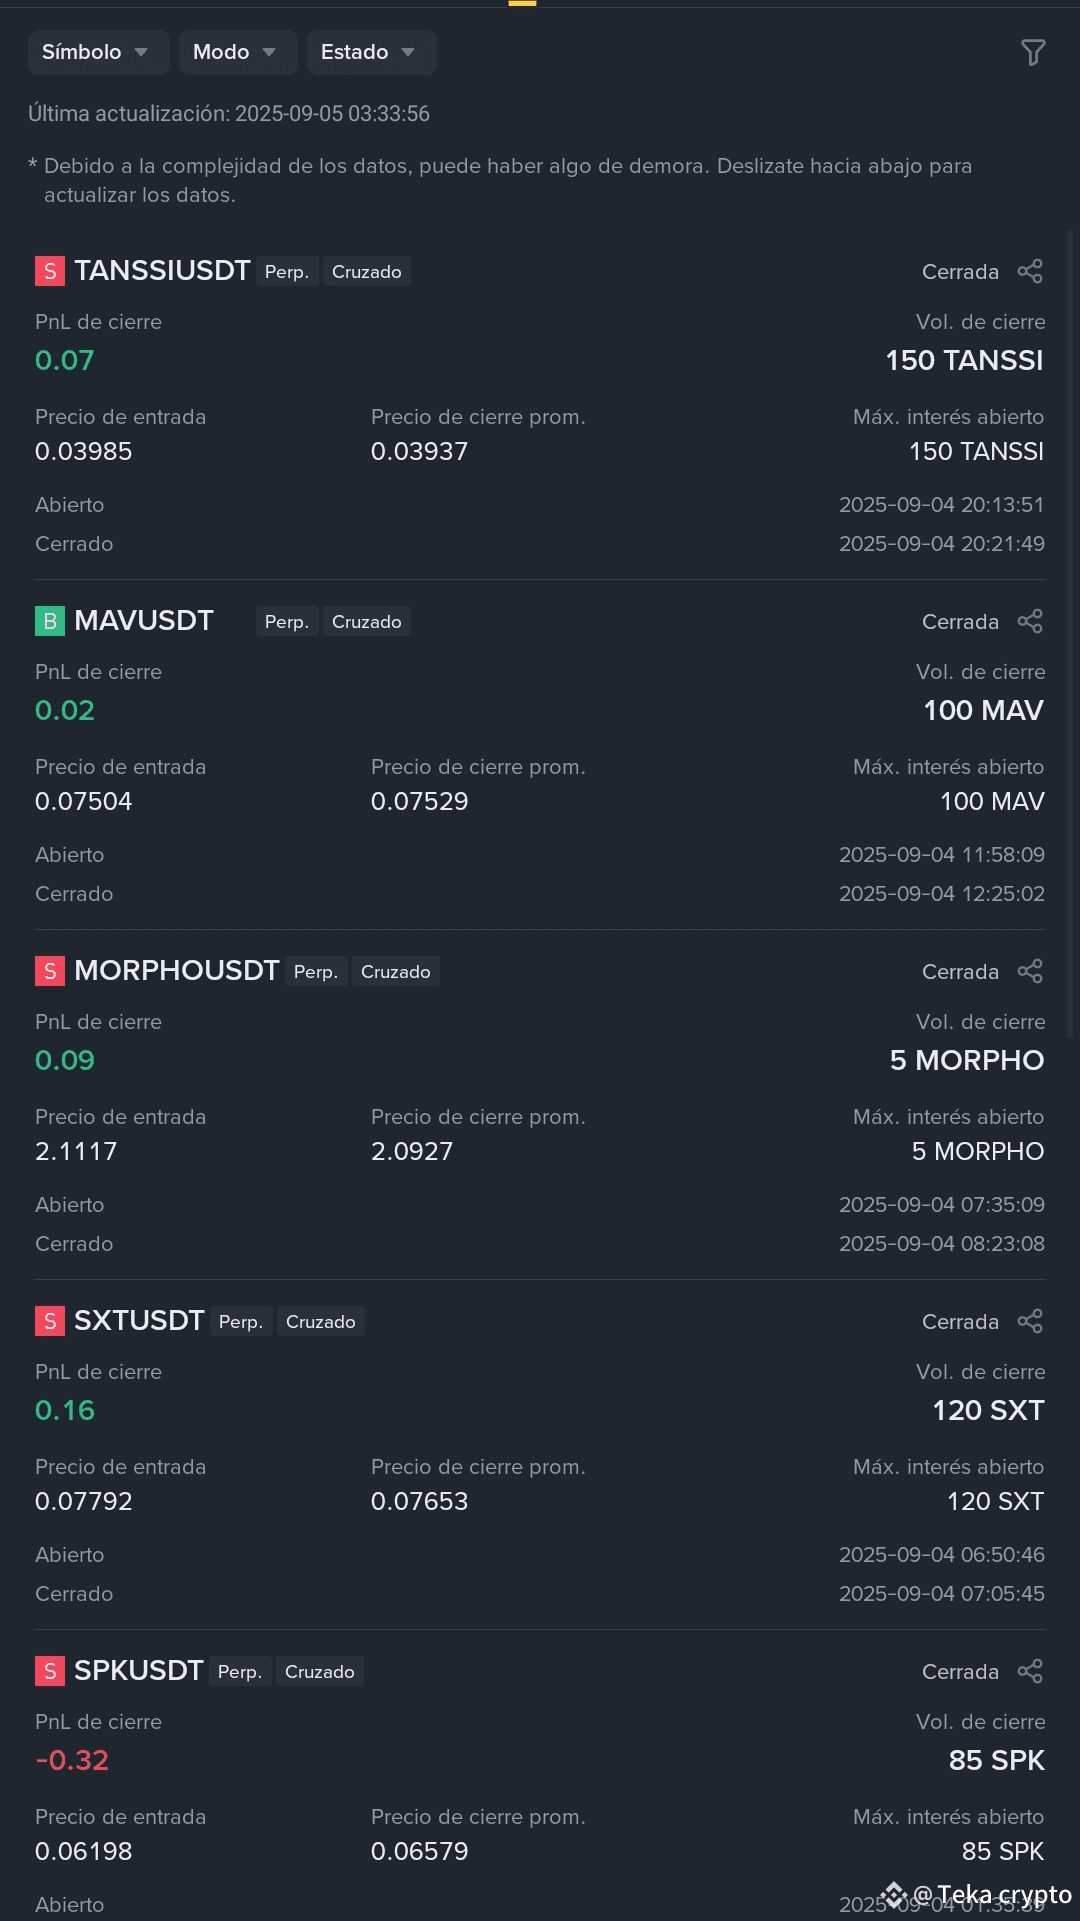
8 Victories and 1 Defeat, is this path really okay? I believe it is, we just need to refine some aspects but everything has a very good average. We must accept defeats and not hide them...
$SPK
#RedSeptember #MarketPullback
8/9
8 Victories and 1 Defeat, is this path really okay? I believe it is, we just need to refine some aspects but everything has a very good average. We must accept defeats and not hide them...
$SPK
#RedSeptember #MarketPullback
8 Victories and 1 Defeat, is this path really okay? I believe it is, we just need to refine some aspects but everything has a very good average. We must accept defeats and not hide them...
$SPK
#RedSeptember #MarketPullback
293

·
--
Hello everyone!
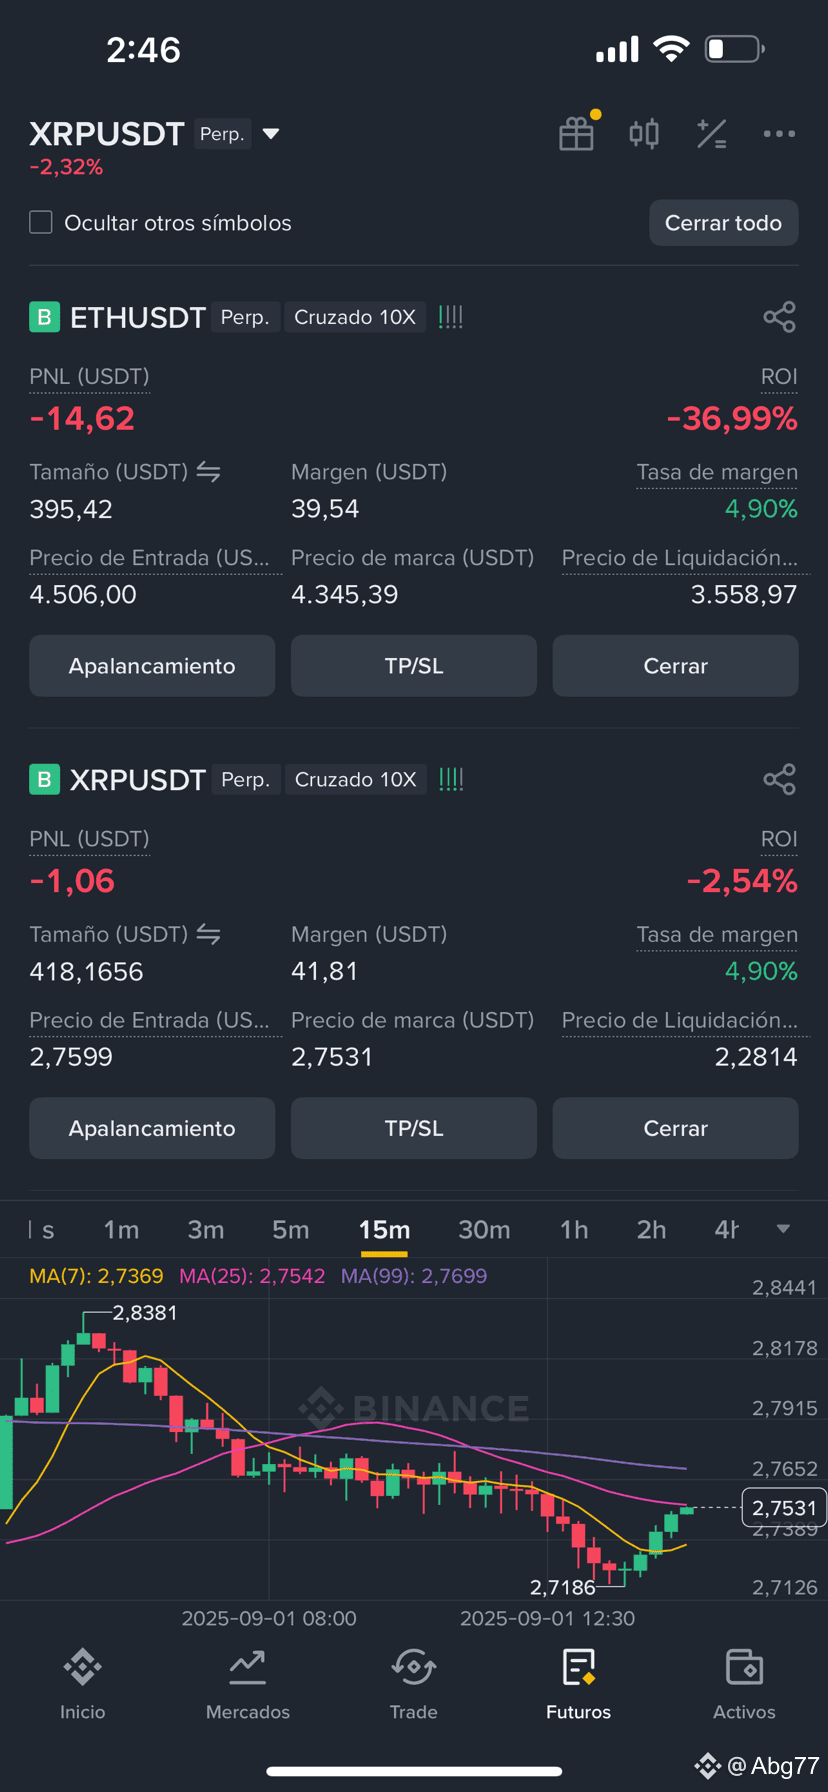
I am dealing with these two open positions on Binance and, as you can see, I am not having the best results. I have ETHUSDT and XRPUSDT in the negative and I am looking for help.
I would like to know what you would do in this situation. I welcome any type of suggestion, whether to close the positions, average down, or simply wait for the price to recover.
Your advice is very valuable! I read you in the comments.#BinancehodlerSOMI #RedSeptember #MarketPullback #ETH🔥🔥🔥🔥🔥🔥 #Xrp🔥🔥 $XRP
Hello everyone!
I am dealing with these two open positions on Binance and, as you can see, I am not having the best results. I have ETHUSDT and XRPUSDT in the negative and I am looking for help.
I would like to know what you would do in this situation. I welcome any type of suggestion, whether to close the positions, average down, or simply wait for the price to recover.
Your advice is very valuable! I read you in the comments.#BinancehodlerSOMI #RedSeptember #MarketPullback #ETH🔥🔥🔥🔥🔥🔥 #Xrp🔥🔥 $XRP
I am dealing with these two open positions on Binance and, as you can see, I am not having the best results. I have ETHUSDT and XRPUSDT in the negative and I am looking for help.
I would like to know what you would do in this situation. I welcome any type of suggestion, whether to close the positions, average down, or simply wait for the price to recover.
Your advice is very valuable! I read you in the comments.#BinancehodlerSOMI #RedSeptember #MarketPullback #ETH🔥🔥🔥🔥🔥🔥 #Xrp🔥🔥 $XRP
23
7
14
5.3k


·
--
again' working 17 hour's for successful everything is excuse just wake up and mada up.
#RedSeptember #bnbguy #Write2Earn @Binance_Square_Official
$SOL $BNB $USDC #SaylorBTCPurchase #ListedCompaniesAltcoinTreasury
again' working 17 hour's for successful everything is excuse just wake up and mada up.
#RedSeptember #bnbguy #Write2Earn @Binance Square Official
$SOL $BNB $USDC #SaylorBTCPurchase #ListedCompaniesAltcoinTreasury
#RedSeptember #bnbguy #Write2Earn @Binance Square Official
$SOL $BNB $USDC #SaylorBTCPurchase #ListedCompaniesAltcoinTreasury
Demonmusic7
·
--
[Replay] 🎙️ Join CONANWEST group for money ,by completing simple task 🪽💕❤️🖐🏼🌹
02 h 42 m 40 s · 4.3k listens
1
5
456

·
--
Bullish
#ListedCompaniesAltcoinTreasury
#RedSeptember #TrumpFamilyCrypto
Coming Pump Soon
these coins
$SOMI
$WLFI
don't wait long now
#ListedCompaniesAltcoinTreasury
#RedSeptember #TrumpFamilyCrypto
Coming Pump Soon
these coins
$SOMI
$WLFI
don't wait long now
#RedSeptember #TrumpFamilyCrypto
Coming Pump Soon
these coins
$SOMI
$WLFI
don't wait long now
1
1
689


·
--
643

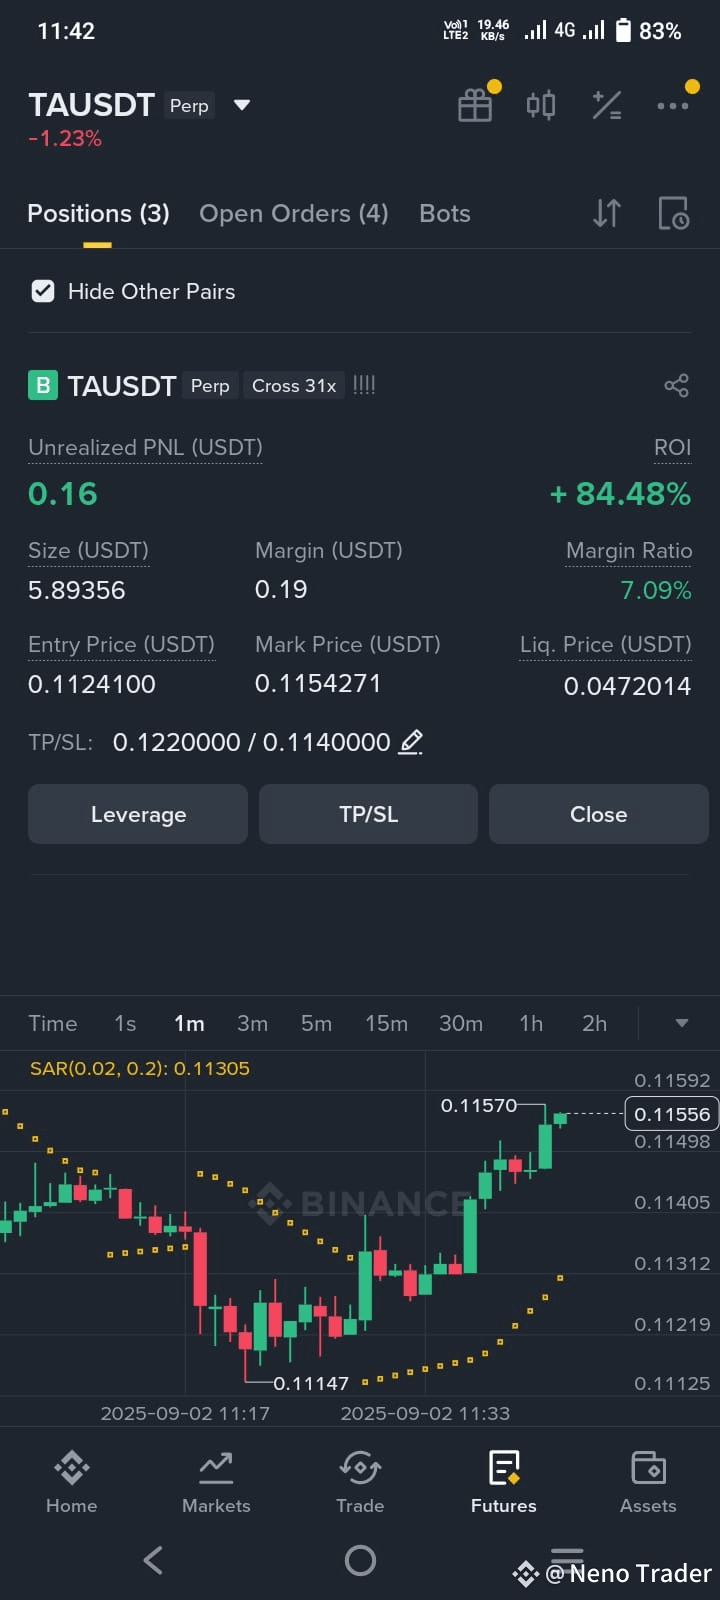
#RedSeptember #XRPBEAR
What is happening now lets explain-
1. Lowering the price in the spot market: Large traders (whales) first push the price down in the spot market. This causes small and medium traders to panic sell or face the risk of liquidation.
2. Opening long positions in the futures market: While lowering the price, they open large long positions in the futures market at low prices. Essentially, they are preparing to “buy low and sell high.”
3. Raising the price in the spot market: Then they buy in the spot market or use other strategies to push the price up. As the spot price rises, their long positions in the futures market automatically become profitable.
4. Profit in the futures market: Since the spot price increases, the futures price also rises (because many platforms reference the spot or fundamental price). As a result, large traders earn significant profits from their futures long positions.
In summary: By controlling the spot market, large traders can profit in the futures market through strategic long or short positions.
#RedSeptember #XRPBEAR
What is happening now lets explain-
1. Lowering the price in the spot market: Large traders (whales) first push the price down in the spot market. This causes small and medium traders to panic sell or face the risk of liquidation.
2. Opening long positions in the futures market: While lowering the price, they open large long positions in the futures market at low prices. Essentially, they are preparing to “buy low and sell high.”
3. Raising the price in the spot market: Then they buy in the spot market or use other strategies to push the price up. As the spot price rises, their long positions in the futures market automatically become profitable.
4. Profit in the futures market: Since the spot price increases, the futures price also rises (because many platforms reference the spot or fundamental price). As a result, large traders earn significant profits from their futures long positions.
In summary: By controlling the spot market, large traders can profit in the futures market through strategic long or short positions.
What is happening now lets explain-
1. Lowering the price in the spot market: Large traders (whales) first push the price down in the spot market. This causes small and medium traders to panic sell or face the risk of liquidation.
2. Opening long positions in the futures market: While lowering the price, they open large long positions in the futures market at low prices. Essentially, they are preparing to “buy low and sell high.”
3. Raising the price in the spot market: Then they buy in the spot market or use other strategies to push the price up. As the spot price rises, their long positions in the futures market automatically become profitable.
4. Profit in the futures market: Since the spot price increases, the futures price also rises (because many platforms reference the spot or fundamental price). As a result, large traders earn significant profits from their futures long positions.
In summary: By controlling the spot market, large traders can profit in the futures market through strategic long or short positions.
2
176


·
--
Bearish
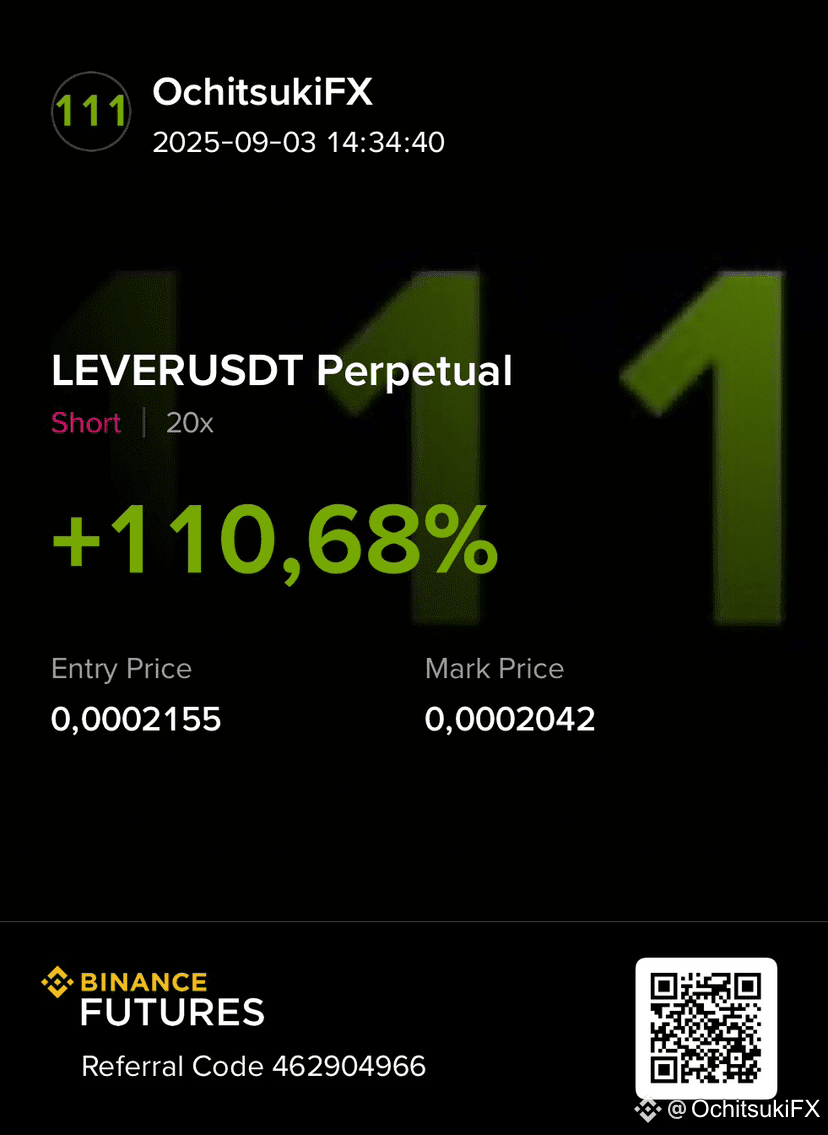
Xrp doing fake pump again and trying to take our money.
This will revert. Im calm. But what was this sh*t pump man. Nonsense. Not resistance at all.
Help me understand. What im doing wrong. #XRPPredictions $XRP #RedSeptember
Xrp doing fake pump again and trying to take our money.
This will revert. Im calm. But what was this sh*t pump man. Nonsense. Not resistance at all.
Help me understand. What im doing wrong. #XRPPredictions $XRP #RedSeptember
This will revert. Im calm. But what was this sh*t pump man. Nonsense. Not resistance at all.
Help me understand. What im doing wrong. #XRPPredictions $XRP #RedSeptember
2
2
1.8k

Hi everyone
This is my first ever post on binance
support everyone please
thanksin advance #RedSeptember #GoldPriceRecordHigh #USNonFarmPayrollReport #SaylorBTCPurchase #TrumpTariffs
Hi everyone
This is my first ever post on binance
support everyone please
thanksin advance #RedSeptember #GoldPriceRecordHigh #USNonFarmPayrollReport #SaylorBTCPurchase #TrumpTariffs
This is my first ever post on binance
support everyone please
thanksin advance #RedSeptember #GoldPriceRecordHigh #USNonFarmPayrollReport #SaylorBTCPurchase #TrumpTariffs
2
41

·
--

Article
Stellar (XLM)@StellarOrg
Price $XLM is currently trading around $0.3655 USD fluctuating between approximately $0.3584 and $0.3685 intraday.Price Ripe for a 42% Surge as Stellar Whisk Upgrade Launches.Stellar Whisk Upgrade Goes Live A New Era of Speed Efficiency and Developer Freedom.#StellerXLM #RedSeptember
Stellar (XLM)
@Stellar
Price $XLM is currently trading around $0.3655 USD fluctuating between approximately $0.3584 and $0.3685 intraday.Price Ripe for a 42% Surge as Stellar Whisk Upgrade Launches.Stellar Whisk Upgrade Goes Live A New Era of Speed Efficiency and Developer Freedom.#StellerXLM #RedSeptember
Price $XLM is currently trading around $0.3655 USD fluctuating between approximately $0.3584 and $0.3685 intraday.Price Ripe for a 42% Surge as Stellar Whisk Upgrade Launches.Stellar Whisk Upgrade Goes Live A New Era of Speed Efficiency and Developer Freedom.#StellerXLM #RedSeptember
7
791

·
--
Profit done from $MERL. Do follow for accurate signal and profits.
#ListedCompaniesAltcoinTreasury #RedSeptember #GoldPriceRecordHigh #USNonFarmPayrollReport
Profit done from $MERL. Do follow for accurate signal and profits.
#ListedCompaniesAltcoinTreasury #RedSeptember #GoldPriceRecordHigh #USNonFarmPayrollReport
#ListedCompaniesAltcoinTreasury #RedSeptember #GoldPriceRecordHigh #USNonFarmPayrollReport
1
639

·
--
Bearish
18
7
24
3.3k

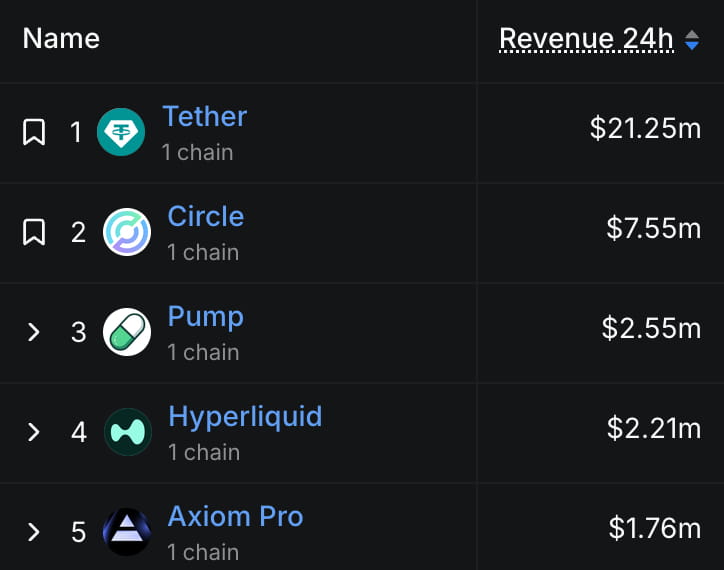
PumpFun just flipped Hyperliquid in daily revenue.
-
It’s now the top earning crypto dApp outside of Tether & Circle.
The driver?
Project Ascend: a new dynamic fee model that makes token launches more rewarding and sustainable.
$PUMP is up 30% this week, with 20k+ daily token launches.
© Defillama
#RedSeptember #ListedCompaniesAltcoinTreasury #TrumpTariffs
PumpFun just flipped Hyperliquid in daily revenue.
-
It’s now the top earning crypto dApp outside of Tether & Circle.
The driver?
Project Ascend: a new dynamic fee model that makes token launches more rewarding and sustainable.
$PUMP is up 30% this week, with 20k+ daily token launches.
© Defillama
#RedSeptember #ListedCompaniesAltcoinTreasury #TrumpTariffs
-
It’s now the top earning crypto dApp outside of Tether & Circle.
The driver?
Project Ascend: a new dynamic fee model that makes token launches more rewarding and sustainable.
$PUMP is up 30% this week, with 20k+ daily token launches.
© Defillama
#RedSeptember #ListedCompaniesAltcoinTreasury #TrumpTariffs
2
8
6.3k


·
--
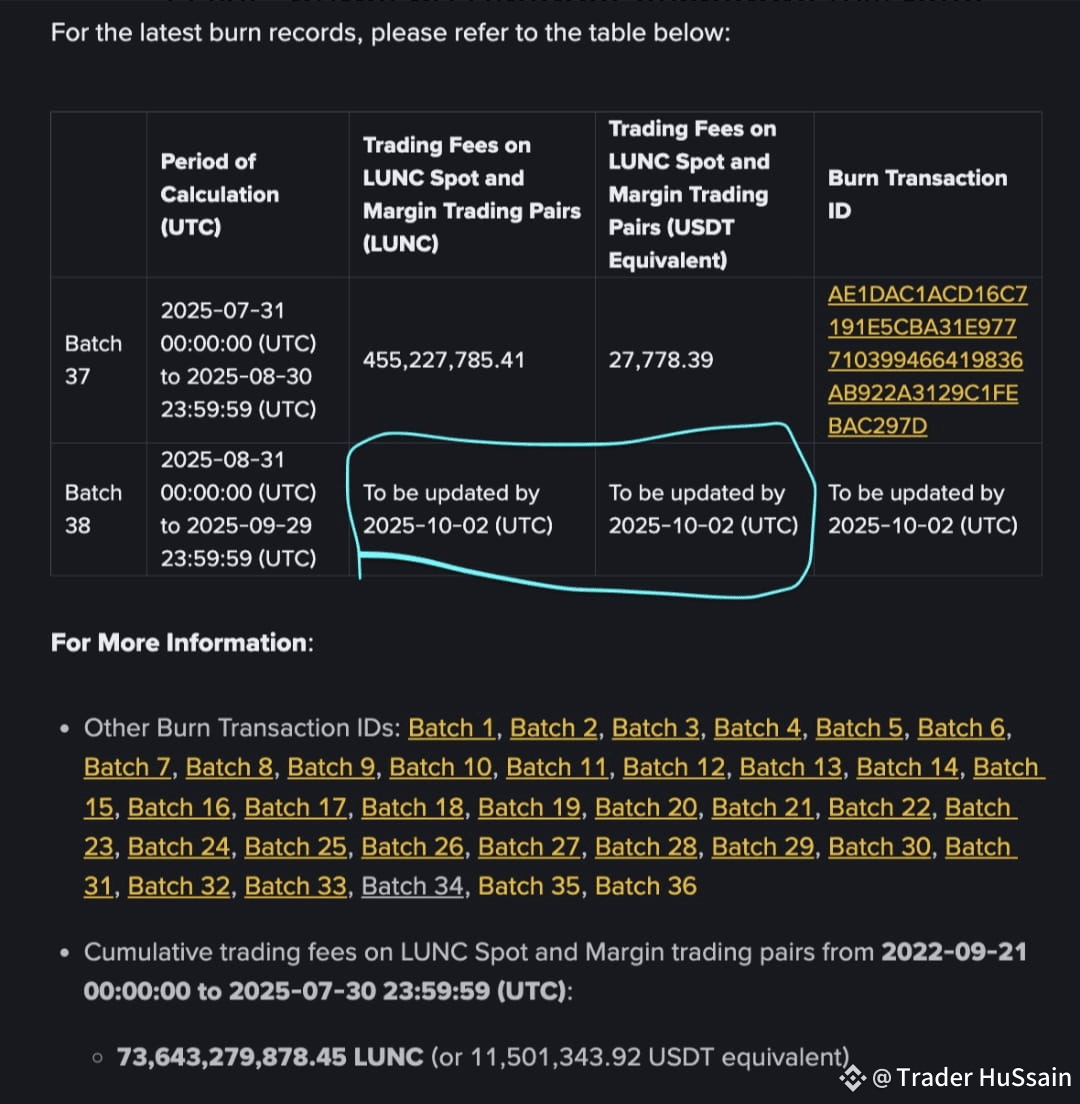
🔥 Binance Continues $LUNC Burns! 🔥
📢 Binance confirms that LUNC burns will continue through September — showing strong support for the Terra Classic community.
🗓️ Next scheduled burn: October 1, 2025
💎 Binance remains committed to reducing LUNC supply and empowering the community’s long-term vision.
🚀 Together, we burn today to build tomorrow.
#Binance #LUNC #Burn #Write2Earn #CryptoCommunitys #RedSeptember
{spot}(LUNCUSDT)
🔥 Binance Continues $LUNC Burns! 🔥
📢 Binance confirms that LUNC burns will continue through September — showing strong support for the Terra Classic community.
🗓️ Next scheduled burn: October 1, 2025
💎 Binance remains committed to reducing LUNC supply and empowering the community’s long-term vision.
🚀 Together, we burn today to build tomorrow.
#Binance #LUNC #Burn #Write2Earn #CryptoCommunitys #RedSeptember
📢 Binance confirms that LUNC burns will continue through September — showing strong support for the Terra Classic community.
🗓️ Next scheduled burn: October 1, 2025
💎 Binance remains committed to reducing LUNC supply and empowering the community’s long-term vision.
🚀 Together, we burn today to build tomorrow.
#Binance #LUNC #Burn #Write2Earn #CryptoCommunitys #RedSeptember
3
3
57
16.8k

·
--
Bullish
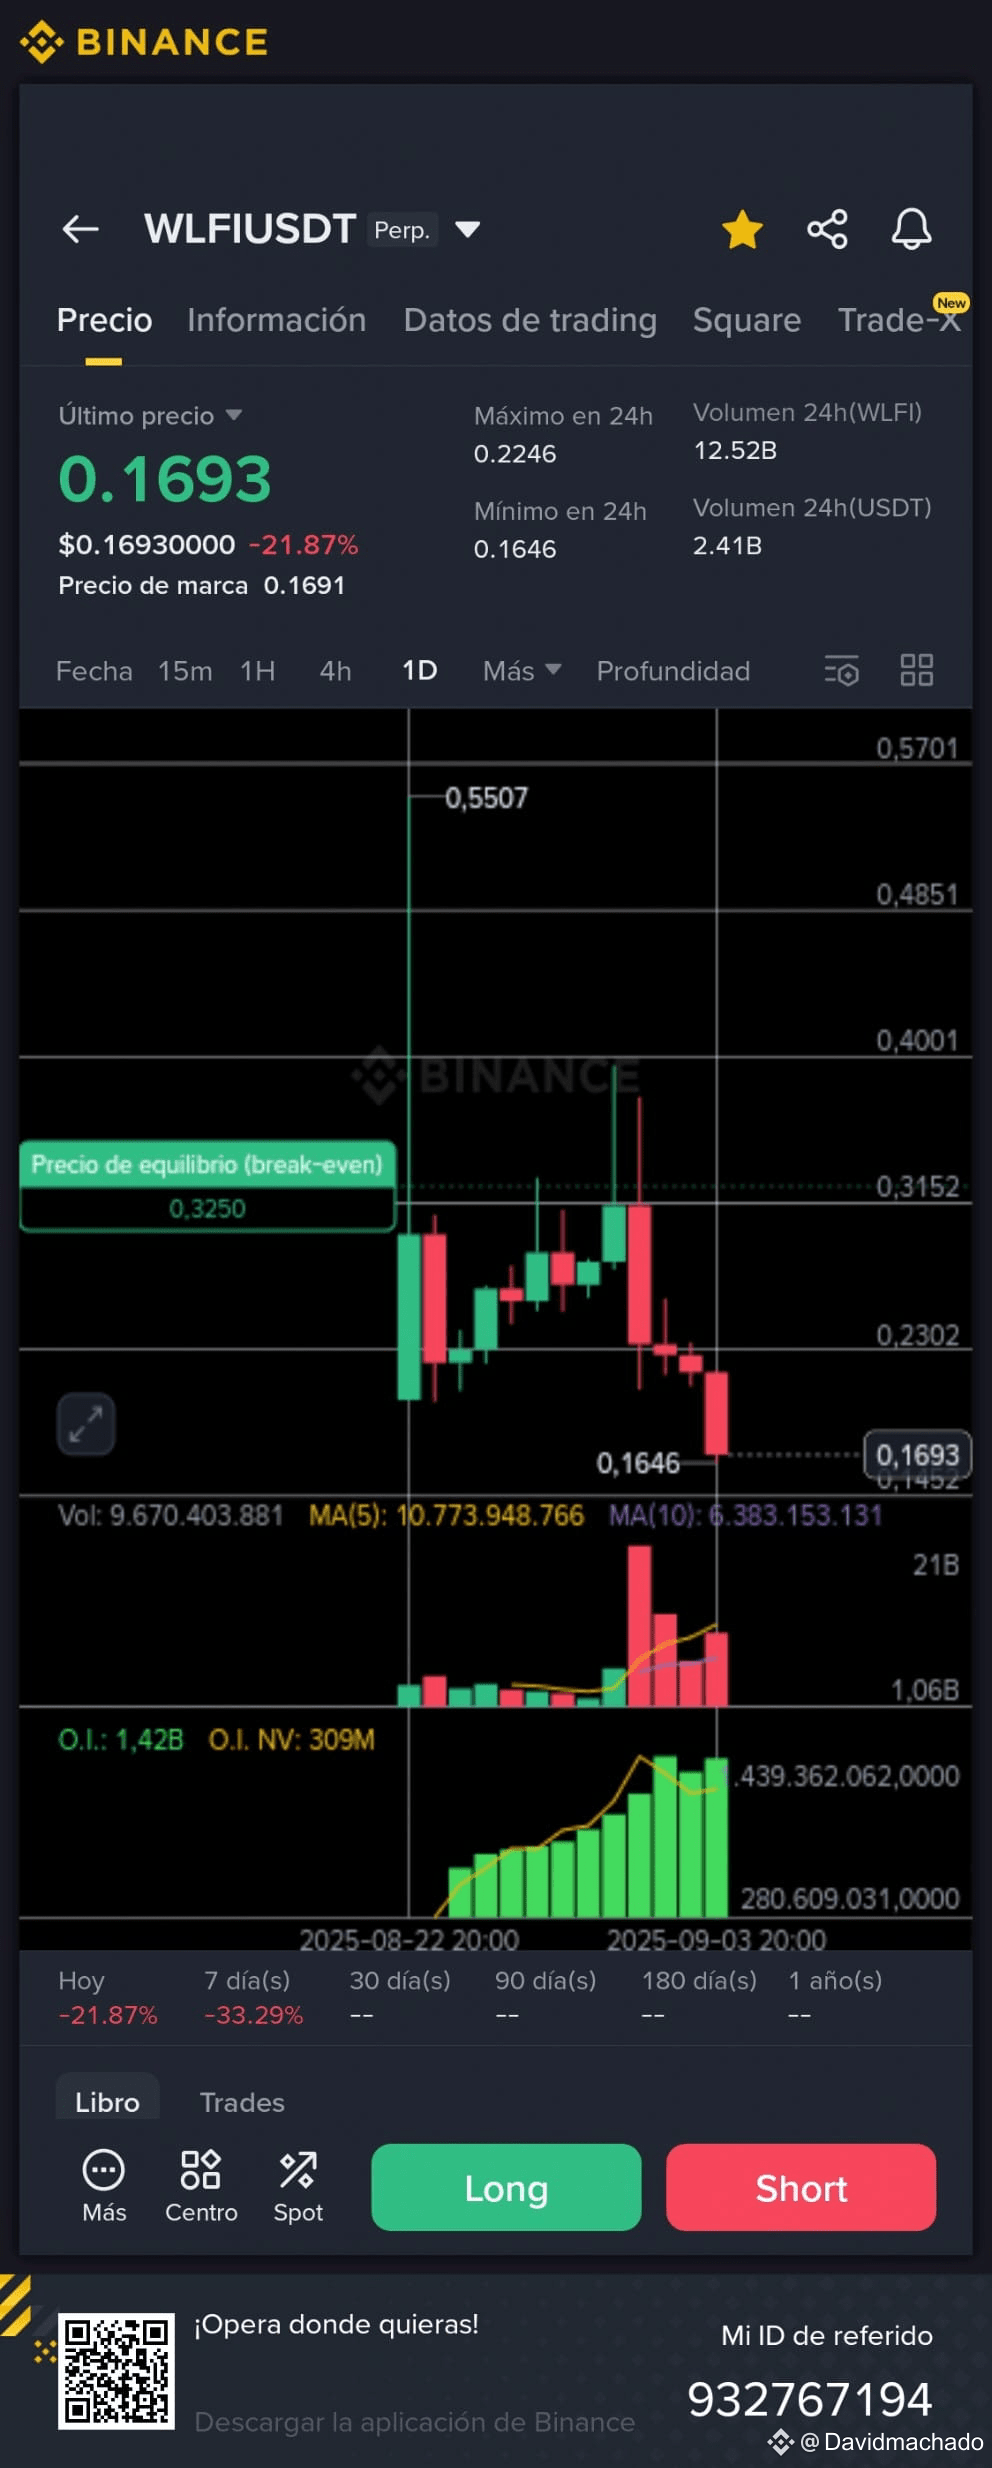
the opening of the rise is coming, we just have to wait a little longer, we just need to be patient ✨💯 #RedSeptember #TrumpFamilyCrypto #TrumpTariffs $SOL $BNB $BTC
the opening of the rise is coming, we just have to wait a little longer, we just need to be patient ✨💯 #RedSeptember #TrumpFamilyCrypto #TrumpTariffs $SOL $BNB $BTC
155

·
--
Bullish
$ETH Has been doing a lot this period.
The manipulation is something like I have not seen before.
Just yesterday alone a 2.2% wick up, 2.3% wick down then 1.76% candle body.
All in 1 day candle. Thats crazy volatility.
I had to step out in a loss on my futures buy position of around $100 and sold all my spot Ethereum.
Am 100% in USDT now. While I watch but remain bullish.
I fell for the shake of week hands. But overall am in a profit of $3,100 although i joined the party late because of delayed funds.
Will be adding more $7,000 funds to Binance to get back into Ethereum if/when price goes lower. Else, I Buy anywhere and ride the wave as it goes up.
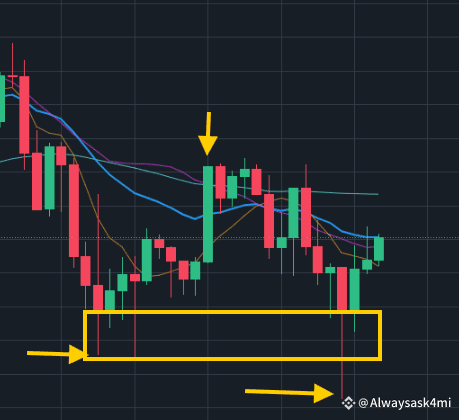
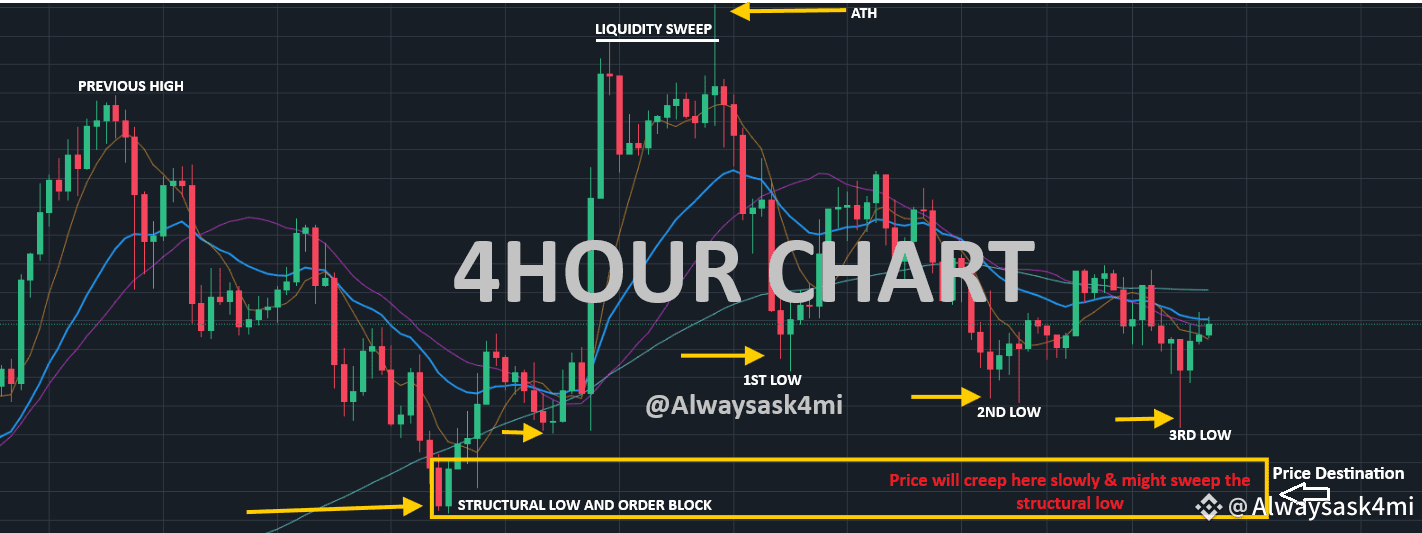
Eth chart update shows price is always driven down by the bears but bulls prevent any 4 hour candle from closing below $4,257.2 range.
I feel they are inching the lows lower each time and avoiding a close below the previous low which will indicate a break of structure like the ICT/SMC traders will call it.
On 4 hour candle does the damage and then the next recovers it.
I will resist the market until after the release of US economic data on the 5th because any move up can reverse with the next 4 hour candle.
Thats the game being played.
Imagine a 4 hour bullish candle (yellow arrow pointing down) which should suggest a price continuation up been taken out. That is against candlestick rules.
Now price has swept the low and taken liquidity and naturally now it should create a local higher high to take out the liquidity up above the super bullish candle.
I hope to watch from the sidelines but I hope not to be tempted as the market has a lot of temptation that requires discipline.
#RedSeptember
#TrumpTariffs
$ETH Has been doing a lot this period.
The manipulation is something like I have not seen before.
Just yesterday alone a 2.2% wick up, 2.3% wick down then 1.76% candle body.
All in 1 day candle. Thats crazy volatility.
I had to step out in a loss on my futures buy position of around $100 and sold all my spot Ethereum.
Am 100% in USDT now. While I watch but remain bullish.
I fell for the shake of week hands. But overall am in a profit of $3,100 although i joined the party late because of delayed funds.
Will be adding more $7,000 funds to Binance to get back into Ethereum if/when price goes lower. Else, I Buy anywhere and ride the wave as it goes up.
Eth chart update shows price is always driven down by the bears but bulls prevent any 4 hour candle from closing below $4,257.2 range.
I feel they are inching the lows lower each time and avoiding a close below the previous low which will indicate a break of structure like the ICT/SMC traders will call it.
On 4 hour candle does the damage and then the next recovers it.
I will resist the market until after the release of US economic data on the 5th because any move up can reverse with the next 4 hour candle.
Thats the game being played.
Imagine a 4 hour bullish candle (yellow arrow pointing down) which should suggest a price continuation up been taken out. That is against candlestick rules.
Now price has swept the low and taken liquidity and naturally now it should create a local higher high to take out the liquidity up above the super bullish candle.
I hope to watch from the sidelines but I hope not to be tempted as the market has a lot of temptation that requires discipline.
#RedSeptember
#TrumpTariffs
The manipulation is something like I have not seen before.
Just yesterday alone a 2.2% wick up, 2.3% wick down then 1.76% candle body.
All in 1 day candle. Thats crazy volatility.
I had to step out in a loss on my futures buy position of around $100 and sold all my spot Ethereum.
Am 100% in USDT now. While I watch but remain bullish.
I fell for the shake of week hands. But overall am in a profit of $3,100 although i joined the party late because of delayed funds.
Will be adding more $7,000 funds to Binance to get back into Ethereum if/when price goes lower. Else, I Buy anywhere and ride the wave as it goes up.
Eth chart update shows price is always driven down by the bears but bulls prevent any 4 hour candle from closing below $4,257.2 range.
I feel they are inching the lows lower each time and avoiding a close below the previous low which will indicate a break of structure like the ICT/SMC traders will call it.
On 4 hour candle does the damage and then the next recovers it.
I will resist the market until after the release of US economic data on the 5th because any move up can reverse with the next 4 hour candle.
Thats the game being played.
Imagine a 4 hour bullish candle (yellow arrow pointing down) which should suggest a price continuation up been taken out. That is against candlestick rules.
Now price has swept the low and taken liquidity and naturally now it should create a local higher high to take out the liquidity up above the super bullish candle.
I hope to watch from the sidelines but I hope not to be tempted as the market has a lot of temptation that requires discipline.
#RedSeptember
#TrumpTariffs
3
9
29.8k
Log in to explore more content
Join global crypto users on Binance Square
⚡️ Get latest and useful information about crypto.
💬 Trusted by the world’s largest crypto exchange.
👍 Discover real insights from verified creators.
Email / Phone number
Trending Topics
1
#BinanceProcesses$4.65BWithdrawals
4,412 views
59 Discussing
2
#WithdrawalsBack: 15 networks live
4,591 views
102 Discussing
3
#BinanceUpdatesProofofReservesAddresses
87,735 views
1,307 Discussing
4
#BinanceToResumePhaseOneOfWithdrawals
127,191 views
1,446 Discussing
5
#BinanceHadAlreadyCovered$6BofHackLoss
8,731 views
129 Discussing
6
#FBIConfirmsNorthKoreaIsResponsibleForBinanceCryptoHack
43,875 views
140 Discussing
7
#CZDismissesClaimsBinanceHackWasPredicted
62,398 views
654 Discussing
8
#B14gReportsUnauthorizedTransferOfAbout97MCORE
19,219 views
320 Discussing
9
#USSpotETHETFsPost23StraightDaysOfNetOutflows
23,092 views
292 Discussing
10
#IntelHasItsWorstDaySince1974
112,384 views
900 Discussing