
#nodox248
nodox248
243 views
5 Discussing
Hot
Latest

·
--
7 days ago, $ONE was up +55.9%. Over the past month, it fell -17.2%. Same crypto, two different stories.
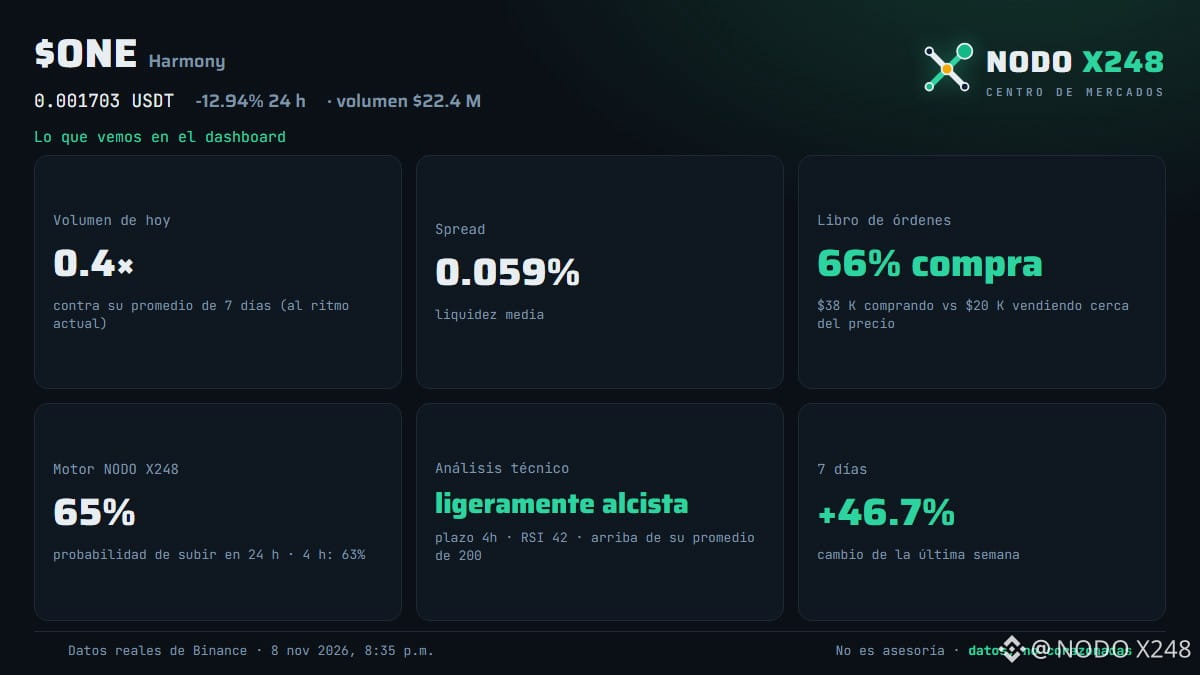
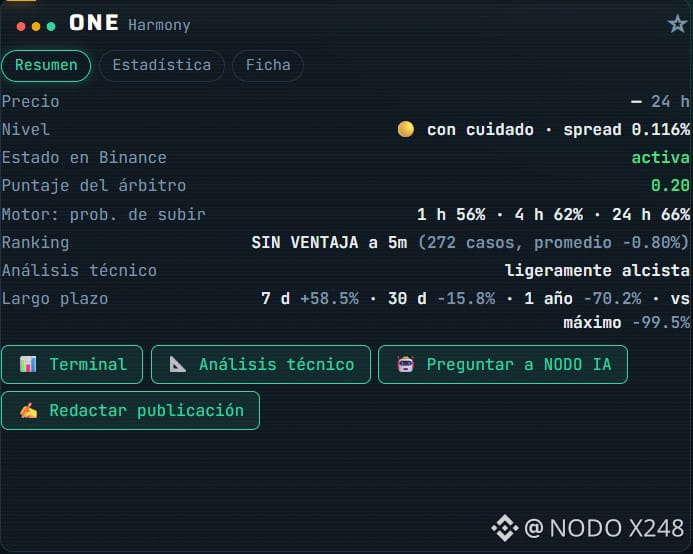
🔎 At NODO X248, the model gives it a 65% probability of rising within 24 hours. Before believing it, we look at the rest of the data.
Our own data: in 16 similar cases (above its 200-period average, RSI between 35 and 50, in the lower third of its 20-candle range), $ONE gained 37.5% of the time. By chance, across 262 samples, it gained 31.7% of the time. The advantage is small, and the average return was -0.99%.
🎓 Calibration means checking whether a probability matches what actually happens. The model has only 8 qualified batches for the 24-hour timeframe and is 7.4 points below the most common outcome, so we still don’t have enough to trust it.
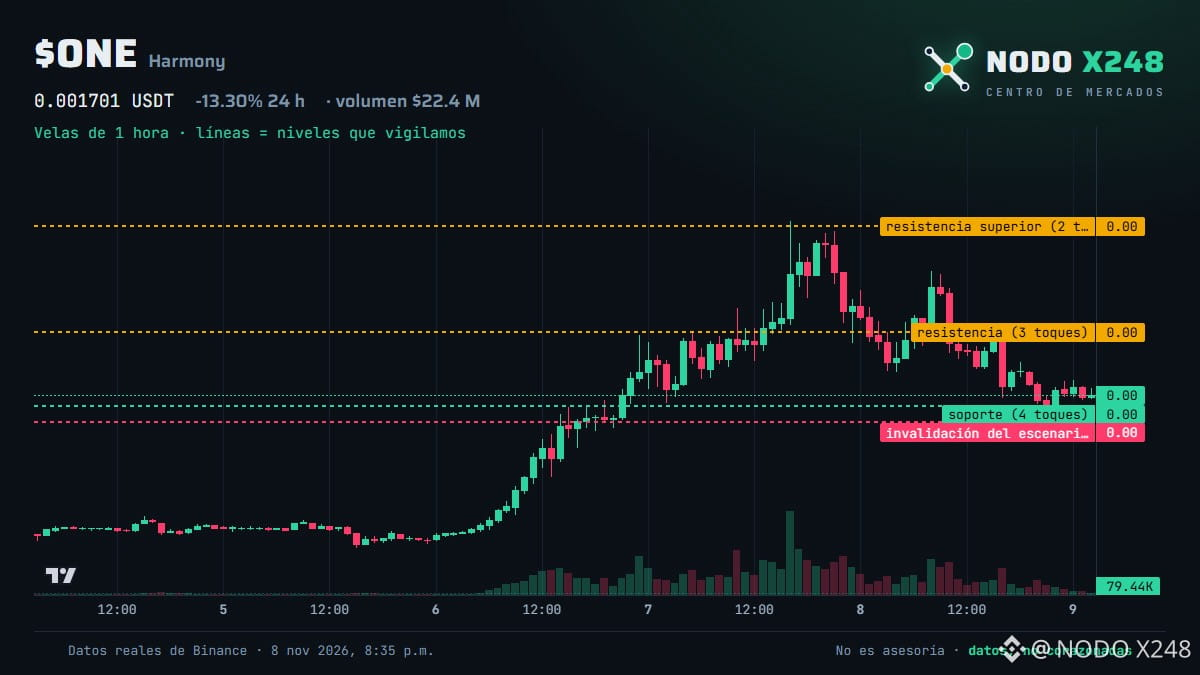
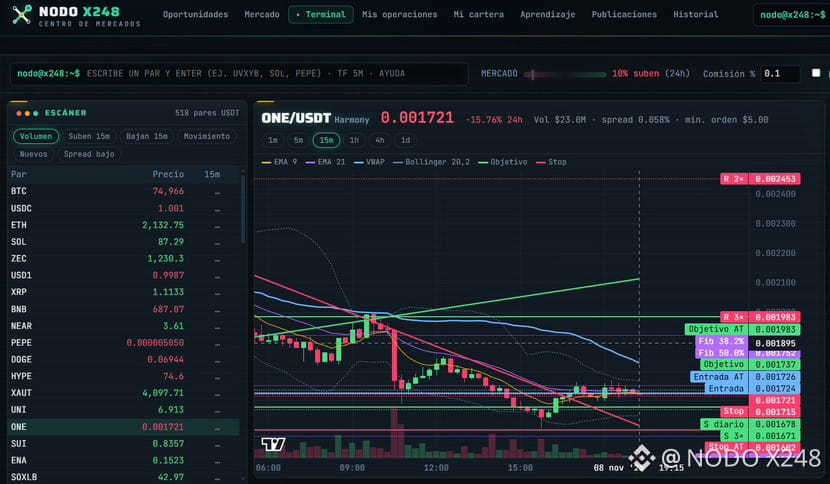
On the chart, we marked support at 0.0016545 (4 touches) and resistance at 0.0019833 (3 touches). If it breaks below 0.0015846, we’ll rule out the rebound scenario.
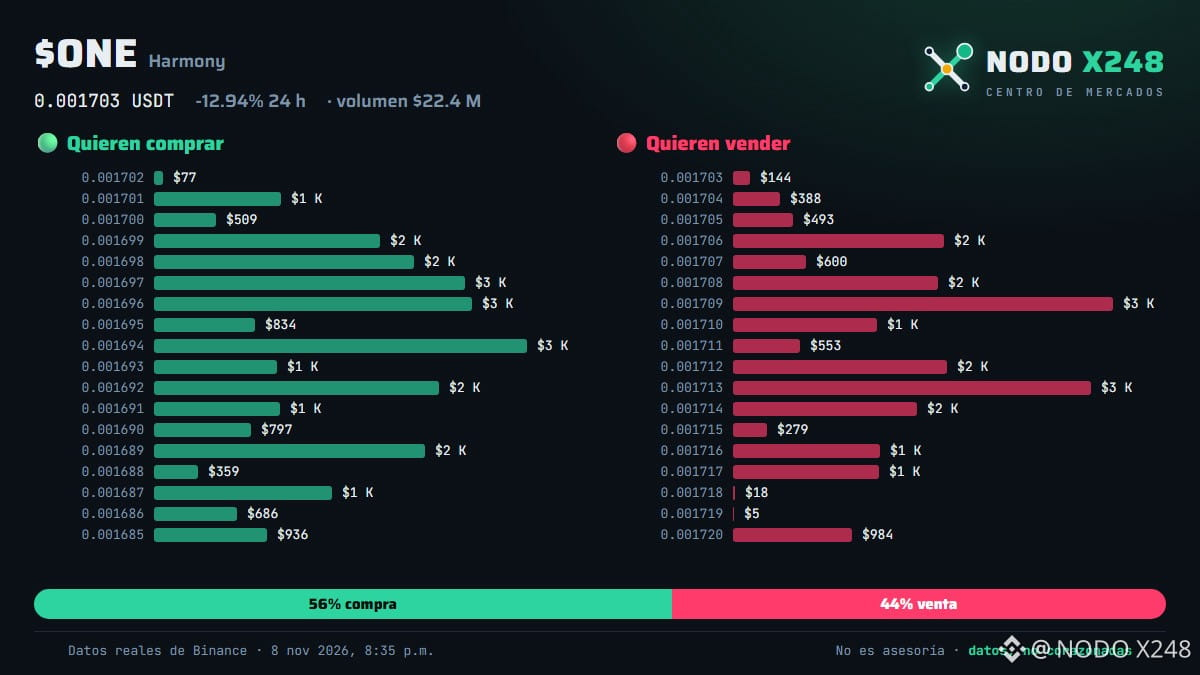
A few hours ago, we were watching it at 0.001723. It’s now at 0.001702, down 1.2%, and hasn’t touched either level. We’re sharing this because the data is ours too.
We’re waiting for confirmation before changing our thesis. In 24 hours, we’ll let you know whether the price recovers to 0.0019833 👀
What data point would make you change your mind about a crypto that surges over a week but falls over the month?
This isn’t financial advice: these are our data; the decision is always yours.
— NODO X248 · data, not hunches
#ONE #AnalisisTecnico #Trading #NodoX248
7 days ago, $ONE was up +55.9%. Over the past month, it fell -17.2%. Same crypto, two different stories.
🔎 At NODO X248, the model gives it a 65% probability of rising within 24 hours. Before believing it, we look at the rest of the data.
Our own data: in 16 similar cases (above its 200-period average, RSI between 35 and 50, in the lower third of its 20-candle range), $ONE gained 37.5% of the time. By chance, across 262 samples, it gained 31.7% of the time. The advantage is small, and the average return was -0.99%.
🎓 Calibration means checking whether a probability matches what actually happens. The model has only 8 qualified batches for the 24-hour timeframe and is 7.4 points below the most common outcome, so we still don’t have enough to trust it.
On the chart, we marked support at 0.0016545 (4 touches) and resistance at 0.0019833 (3 touches). If it breaks below 0.0015846, we’ll rule out the rebound scenario.
A few hours ago, we were watching it at 0.001723. It’s now at 0.001702, down 1.2%, and hasn’t touched either level. We’re sharing this because the data is ours too.
We’re waiting for confirmation before changing our thesis. In 24 hours, we’ll let you know whether the price recovers to 0.0019833 👀
What data point would make you change your mind about a crypto that surges over a week but falls over the month?
This isn’t financial advice: these are our data; the decision is always yours.
— NODO X248 · data, not hunches
#ONE #AnalisisTecnico #Trading #NodoX248
🔎 At NODO X248, the model gives it a 65% probability of rising within 24 hours. Before believing it, we look at the rest of the data.
Our own data: in 16 similar cases (above its 200-period average, RSI between 35 and 50, in the lower third of its 20-candle range), $ONE gained 37.5% of the time. By chance, across 262 samples, it gained 31.7% of the time. The advantage is small, and the average return was -0.99%.
🎓 Calibration means checking whether a probability matches what actually happens. The model has only 8 qualified batches for the 24-hour timeframe and is 7.4 points below the most common outcome, so we still don’t have enough to trust it.
On the chart, we marked support at 0.0016545 (4 touches) and resistance at 0.0019833 (3 touches). If it breaks below 0.0015846, we’ll rule out the rebound scenario.
A few hours ago, we were watching it at 0.001723. It’s now at 0.001702, down 1.2%, and hasn’t touched either level. We’re sharing this because the data is ours too.
We’re waiting for confirmation before changing our thesis. In 24 hours, we’ll let you know whether the price recovers to 0.0019833 👀
What data point would make you change your mind about a crypto that surges over a week but falls over the month?
This isn’t financial advice: these are our data; the decision is always yours.
— NODO X248 · data, not hunches
#ONE #AnalisisTecnico #Trading #NodoX248
406
·
--
Bullish
🚨 **$ONE fell 15.3% in 24 hours. A rebound in sight? Historical data tempers that idea.**
Harmony is hovering around **0.001731** and remains above its 200-period average. Support at **0.0016545** has already been tested four times and is now a distance equivalent to **0.6× its usual move** away. It’s close. What happened before in similar conditions? 👇
📊 **The NODO X248 test**
We looked for cases where the price was above its 200-period average, the RSI was between 35 and 50, and the price was in the bottom third of its range.
🔎 **15 similar cases** → 33% positive | **−1.2%** average return.
🎲 **262 random moments** → 37.8% positive | **−0.2%** average return.
The sample is small, and in this comparison, **similar cases performed worse than those selected at random**.
The chart also calls for patience. The **MACD remains negative**, highs and lows are getting lower, and volume is barely at **23% of its average**.
🎯 **Three levels to watch as the scenario unfolds**
🟡 **0.0016545** — Support. Here, we’re watching to see whether the price can hold.
🟢 **0.0019833** — First resistance. Reclaiming it would lend more weight to the rebound thesis.
🔴 **0.0015846** — If the price falls below this level, we’ll rule out our rebound scenario.
💬 **What would convince you first that the rebound is for real?**
**A)** Holding support and rising volume.
**B)** Reclaiming the first resistance.
If you like seeing **what the chart says and what happened in similar cases**, give us a like and follow **NODO X248** for the next analysis.
This is not financial advice. We share our data and our reading of the market.
— **NODO X248 · data, not hunches**
#NodoX248 #HarmonyOne #ONE $ONE
🚨 **$ONE fell 15.3% in 24 hours. A rebound in sight? Historical data tempers that idea.**
Harmony is hovering around **0.001731** and remains above its 200-period average. Support at **0.0016545** has already been tested four times and is now a distance equivalent to **0.6× its usual move** away. It’s close. What happened before in similar conditions? 👇
📊 **The NODO X248 test**
We looked for cases where the price was above its 200-period average, the RSI was between 35 and 50, and the price was in the bottom third of its range.
🔎 **15 similar cases** → 33% positive | **−1.2%** average return.
🎲 **262 random moments** → 37.8% positive | **−0.2%** average return.
The sample is small, and in this comparison, **similar cases performed worse than those selected at random**.
The chart also calls for patience. The **MACD remains negative**, highs and lows are getting lower, and volume is barely at **23% of its average**.
🎯 **Three levels to watch as the scenario unfolds**
🟡 **0.0016545** — Support. Here, we’re watching to see whether the price can hold.
🟢 **0.0019833** — First resistance. Reclaiming it would lend more weight to the rebound thesis.
🔴 **0.0015846** — If the price falls below this level, we’ll rule out our rebound scenario.
💬 **What would convince you first that the rebound is for real?**
**A)** Holding support and rising volume.
**B)** Reclaiming the first resistance.
If you like seeing **what the chart says and what happened in similar cases**, give us a like and follow **NODO X248** for the next analysis.
This is not financial advice. We share our data and our reading of the market.
— **NODO X248 · data, not hunches**
#NodoX248 #HarmonyOne #ONE $ONE
Harmony is hovering around **0.001731** and remains above its 200-period average. Support at **0.0016545** has already been tested four times and is now a distance equivalent to **0.6× its usual move** away. It’s close. What happened before in similar conditions? 👇
📊 **The NODO X248 test**
We looked for cases where the price was above its 200-period average, the RSI was between 35 and 50, and the price was in the bottom third of its range.
🔎 **15 similar cases** → 33% positive | **−1.2%** average return.
🎲 **262 random moments** → 37.8% positive | **−0.2%** average return.
The sample is small, and in this comparison, **similar cases performed worse than those selected at random**.
The chart also calls for patience. The **MACD remains negative**, highs and lows are getting lower, and volume is barely at **23% of its average**.
🎯 **Three levels to watch as the scenario unfolds**
🟡 **0.0016545** — Support. Here, we’re watching to see whether the price can hold.
🟢 **0.0019833** — First resistance. Reclaiming it would lend more weight to the rebound thesis.
🔴 **0.0015846** — If the price falls below this level, we’ll rule out our rebound scenario.
💬 **What would convince you first that the rebound is for real?**
**A)** Holding support and rising volume.
**B)** Reclaiming the first resistance.
If you like seeing **what the chart says and what happened in similar cases**, give us a like and follow **NODO X248** for the next analysis.
This is not financial advice. We share our data and our reading of the market.
— **NODO X248 · data, not hunches**
#NodoX248 #HarmonyOne #ONE $ONE
82
·
--
Bullish
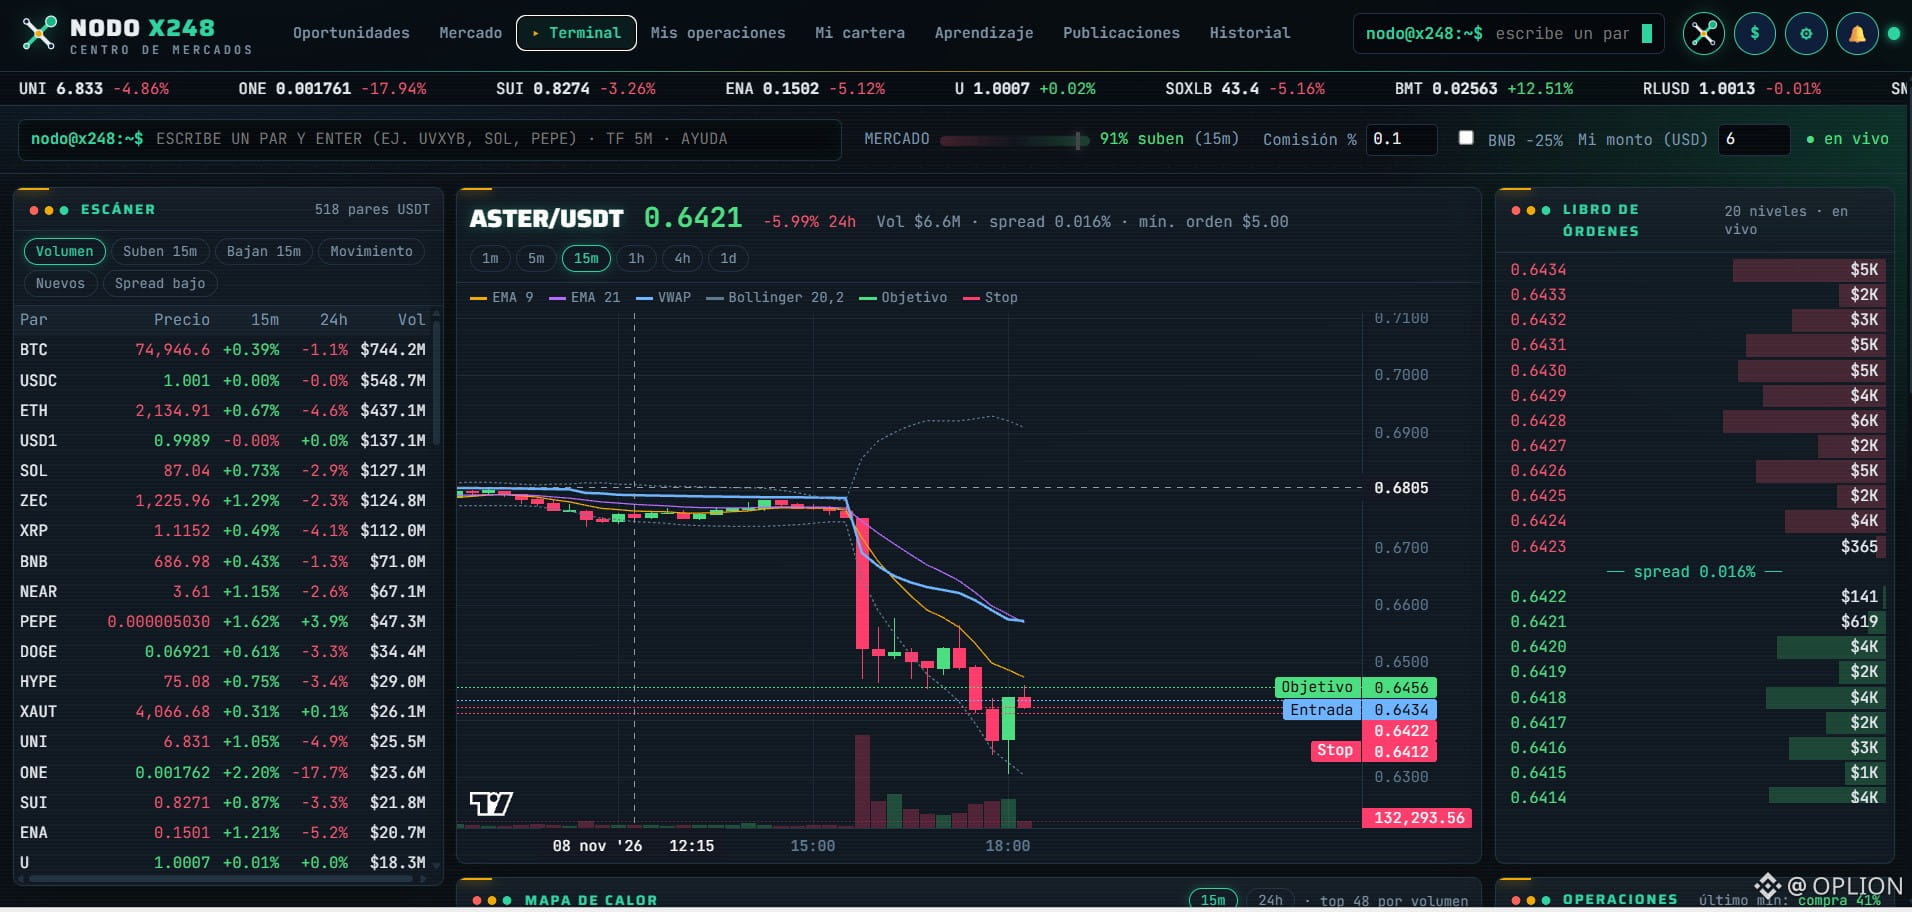
ASTER suddenly fell -3.0%, with volume 6.4 times above its average. The RSI came in at 12.6, a level we rarely see.
At NODO X248, the first thing we did was look for similar cases. Across 121 similar historical episodes, the average subsequent move was +0.93%, and 72% ended in positive territory. But the 10th percentile was -2.4%: many cases turned out badly, which is why we’re not presenting this as a clear-cut signal.
Today, the price remains below its 200-day average, and the structure is bearish. Here’s what we’re watching:
- 0.6729: first resistance, with only 3 touches.
- 0.6800: strong resistance, tested 18 times. If the price reclaims it with solid closes, the outlook changes.
- 0.6069: our invalidation level. If it falls there, the rebound thesis is off the table.
A candid note: in our 4h engine, the edge was negative (-0.9 pts), so we’re reading ASTER more cautiously on that timeframe than on the 1h timeframe.
What would make you stop believing in a rebound thesis: the price losing a level, or volume no longer confirming it?
This is not financial advice: these are our data; the decision is always yours.
— NODO X248 · data, not hunches
#NodoX248 #Aster
{spot}(BTCUSDT)
$ASTER
{spot}(ASTERUSDT)
ASTER suddenly fell -3.0%, with volume 6.4 times above its average. The RSI came in at 12.6, a level we rarely see.
At NODO X248, the first thing we did was look for similar cases. Across 121 similar historical episodes, the average subsequent move was +0.93%, and 72% ended in positive territory. But the 10th percentile was -2.4%: many cases turned out badly, which is why we’re not presenting this as a clear-cut signal.
Today, the price remains below its 200-day average, and the structure is bearish. Here’s what we’re watching:
- 0.6729: first resistance, with only 3 touches.
- 0.6800: strong resistance, tested 18 times. If the price reclaims it with solid closes, the outlook changes.
- 0.6069: our invalidation level. If it falls there, the rebound thesis is off the table.
A candid note: in our 4h engine, the edge was negative (-0.9 pts), so we’re reading ASTER more cautiously on that timeframe than on the 1h timeframe.
What would make you stop believing in a rebound thesis: the price losing a level, or volume no longer confirming it?
This is not financial advice: these are our data; the decision is always yours.
— NODO X248 · data, not hunches
#NodoX248 #Aster
$ASTER
At NODO X248, the first thing we did was look for similar cases. Across 121 similar historical episodes, the average subsequent move was +0.93%, and 72% ended in positive territory. But the 10th percentile was -2.4%: many cases turned out badly, which is why we’re not presenting this as a clear-cut signal.
Today, the price remains below its 200-day average, and the structure is bearish. Here’s what we’re watching:
- 0.6729: first resistance, with only 3 touches.
- 0.6800: strong resistance, tested 18 times. If the price reclaims it with solid closes, the outlook changes.
- 0.6069: our invalidation level. If it falls there, the rebound thesis is off the table.
A candid note: in our 4h engine, the edge was negative (-0.9 pts), so we’re reading ASTER more cautiously on that timeframe than on the 1h timeframe.
What would make you stop believing in a rebound thesis: the price losing a level, or volume no longer confirming it?
This is not financial advice: these are our data; the decision is always yours.
— NODO X248 · data, not hunches
#NodoX248 #Aster
$ASTER
133
Log in to explore more content
Join global crypto users on Binance Square
⚡️ Get latest and useful information about crypto.
💬 Trusted by the world’s largest crypto exchange.
👍 Discover real insights from verified creators.
Email / Phone number
Trending Topics
1
#NvidiaInvestigatesAfterHuang’sAffairApology
149,830 views
1,489 Discussing
2
#BitcoinFiveWeeklyLosses
178,939 views
1,961 Discussing
3
#AIChipSlumpNasdaq
93,311 views
1,221 Discussing
4
#CPITestsDecemberRateOutlook
604,758 views
2,673 Discussing
5
#AnthropicRejectsIPODelayValuationinQuestion
22,692 views
348 Discussing
6
#CryptoLiquidationsReach$1.16BIn24Hours
4,305 views
32 Discussing
7
#BrentCrudeDrops3.8%To$94.56
4,567 views
18 Discussing
8
#EUInstitutionsInviteIndustryToSetTokenizedSecuritiesStandards
1,270 views
11 Discussing
9
#ChinaCACListsFiveIssuesAffectingBlockchainFilings
9,836 views
131 Discussing
10
#UKBanksCanNowApplyToConductCryptoAssetBusiness
8,129 views
91 Discussing