

#klte
klte
925 views
40 Discussing
Hot
Latest

·
--
Bullish
$KITE /USDT LONG TRADE SETUP 📈
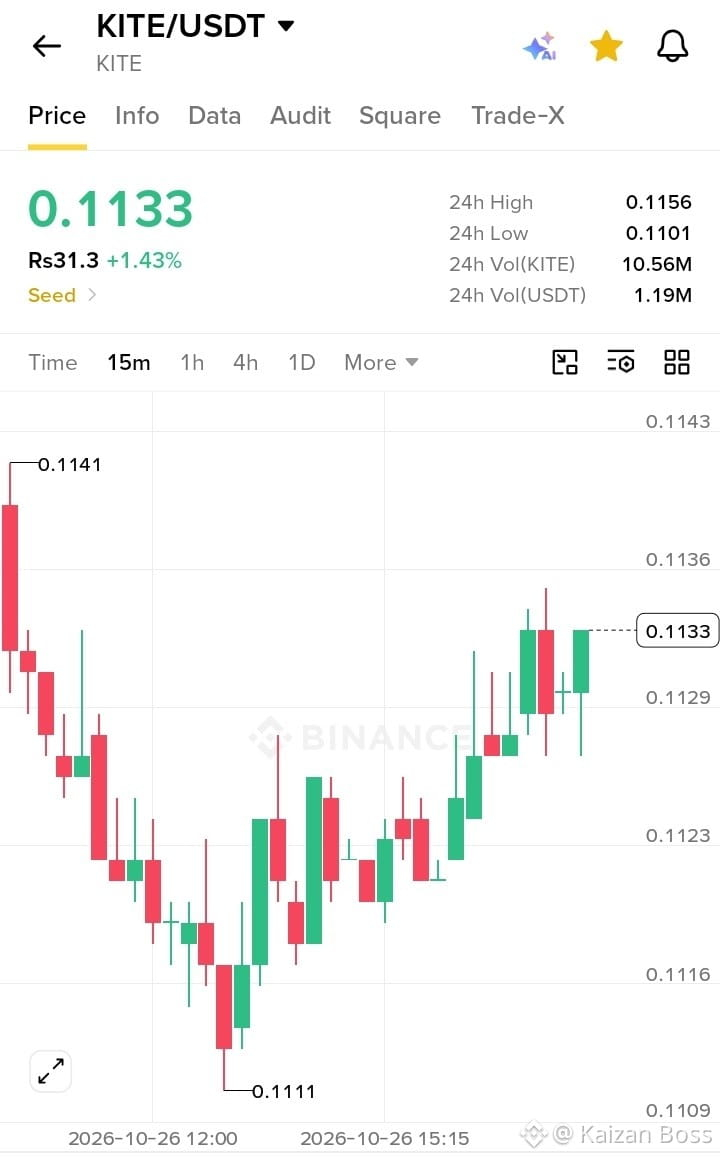
$KITE is showing bullish momentum on the 15-minute chart, currently trading around 0.1133 USDT with a 1.43% gain. Buyers are pushing the price upward, but resistance remains nearby. 🎯
🟢 Entry (EP): 0.1130–0.1133
🎯 Take Profit (TP1): 0.1136
🎯 Take Profit (TP2): 0.1141
🎯 Take Profit (TP3): 0.1145
🛑 Stop Loss (SL): 0.1125
Wait for confirmation before entering. Manage your risk carefully, and avoid chasing the price after a sudden pump. Crypto trading is risky, so always use proper position sizing. Trade smart and stay disciplined! 🔥📊
{spot}(KITEUSDT)
@Dusk_Foundation #KlTE
$KITE /USDT LONG TRADE SETUP 📈
$KITE is showing bullish momentum on the 15-minute chart, currently trading around 0.1133 USDT with a 1.43% gain. Buyers are pushing the price upward, but resistance remains nearby. 🎯
🟢 Entry (EP): 0.1130–0.1133
🎯 Take Profit (TP1): 0.1136
🎯 Take Profit (TP2): 0.1141
🎯 Take Profit (TP3): 0.1145
🛑 Stop Loss (SL): 0.1125
Wait for confirmation before entering. Manage your risk carefully, and avoid chasing the price after a sudden pump. Crypto trading is risky, so always use proper position sizing. Trade smart and stay disciplined! 🔥📊
@Dusk #KlTE
90

·
--

Article
🚀 Viral Hook@Satter12 $KITE
{spot}(KITEUSDT)
Is KITE preparing for a rebound, or is another major drop coming? 👀
After losing nearly 40% in the last 30 days, KITE is sitting at a critical support zone. Smart traders are watching closely because the next move could define the short-term trend.
📰 Latest Crypto News
KITE remains under selling pressure as the broader altcoin market shows mixed performance. While Bitcoin continues to hold relatively strong, many mid-cap altcoins are still struggling to regain bullish momentum. Investors are waiting for stronger buying volume before confirming a trend reversal.
📊 Professional Chart Analysis (1D)
Current Price: $0.1084
Trend
Overall trend remains Bearish.
Price is making lower highs and lower lows.
RSI(14): 36.07, showing weak momentum but approaching the oversold region.
Key Support
S1: $0.1015
S2: $0.0940
Key Resistance
R1: $0.1180
R2: $0.1265
R3: $0.1600
Bullish Scenario
A daily candle closing above $0.1180 with strong volume could trigger a move toward $0.1265–0.1400.
Bearish Scenario
If $0.1015 breaks, KITE could revisit the $0.0940 area.
🎯 Trade Setup (Educational Only)
Entry: $0.1070–0.1100
Stop Loss: $0.0990
Take Profit 1: $0.1180
Take Profit 2: $0.1265
Take Profit 3: $0.1400
Risk: Wait for confirmation before entering. Avoid chasing green candles.
✍️ SEO-Friendly Native American English
KITE Price Prediction: Can Bulls Defend the $0.10 Support?
KITE is trading near $0.1084 after an extended correction that has pushed the token down nearly 40% over the past month. The daily chart still favors bears, but price is approaching a support zone where buyers could attempt a recovery.
The RSI sits around 36, suggesting selling pressure is easing, though momentum has not yet shifted in favor of the bulls. A confirmed breakout above $0.1180 could open the door to $0.1265 and potentially $0.1400. On the downside, losing $0.1015 may send KITE toward $0.0940.
For now, patience is the best strategy. Let the market confirm the direction before taking a position, and always use proper risk management.#KlTE $BTC #Binance #BinanceSquareTalks
{spot}(BTCUSDT)
🚀 Viral Hook
@Satter0176 $KITE
Is KITE preparing for a rebound, or is another major drop coming? 👀
After losing nearly 40% in the last 30 days, KITE is sitting at a critical support zone. Smart traders are watching closely because the next move could define the short-term trend.
📰 Latest Crypto News
KITE remains under selling pressure as the broader altcoin market shows mixed performance. While Bitcoin continues to hold relatively strong, many mid-cap altcoins are still struggling to regain bullish momentum. Investors are waiting for stronger buying volume before confirming a trend reversal.
📊 Professional Chart Analysis (1D)
Current Price: $0.1084
Trend
Overall trend remains Bearish.
Price is making lower highs and lower lows.
RSI(14): 36.07, showing weak momentum but approaching the oversold region.
Key Support
S1: $0.1015
S2: $0.0940
Key Resistance
R1: $0.1180
R2: $0.1265
R3: $0.1600
Bullish Scenario
A daily candle closing above $0.1180 with strong volume could trigger a move toward $0.1265–0.1400.
Bearish Scenario
If $0.1015 breaks, KITE could revisit the $0.0940 area.
🎯 Trade Setup (Educational Only)
Entry: $0.1070–0.1100
Stop Loss: $0.0990
Take Profit 1: $0.1180
Take Profit 2: $0.1265
Take Profit 3: $0.1400
Risk: Wait for confirmation before entering. Avoid chasing green candles.
✍️ SEO-Friendly Native American English
KITE Price Prediction: Can Bulls Defend the $0.10 Support?
KITE is trading near $0.1084 after an extended correction that has pushed the token down nearly 40% over the past month. The daily chart still favors bears, but price is approaching a support zone where buyers could attempt a recovery.
The RSI sits around 36, suggesting selling pressure is easing, though momentum has not yet shifted in favor of the bulls. A confirmed breakout above $0.1180 could open the door to $0.1265 and potentially $0.1400. On the downside, losing $0.1015 may send KITE toward $0.0940.
For now, patience is the best strategy. Let the market confirm the direction before taking a position, and always use proper risk management.#KlTE $BTC #Binance #BinanceSquareTalks
128

Log in to explore more content
Join global crypto users on Binance Square
⚡️ Get latest and useful information about crypto.
💬 Trusted by the world’s largest crypto exchange.
👍 Discover real insights from verified creators.
Email / Phone number
Trending Topics
1
#BinancePick
3.1M views
154,928 Discussing
2
#EarningsSeason
5.3M views
26,123 Discussing
3
#AnthropicTTMRevenueGrewAbout1200%
38,233 views
465 Discussing
4
#AnthropicS1ExpectedToday
31,289 views
370 Discussing
5
#SouthKoreaReportedlyWeighsFourthCryptoTaxDelay
34,096 views
503 Discussing
6
#FranklinTempletonFilesForTwoDividendToBitcoinETFs
45,368 views
571 Discussing
7
#StrategyMSTRSurpassesNasdaqInMarketCap
34,938 views
402 Discussing
8
#CanadaProposesStablecoinRedemptionWithin3BusinessDays
1,445 views
37 Discussing
9
#ElectrumWalletBugLetRogueServersStealFunds
33,798 views
483 Discussing
10
#ArgentineCourtDismissesLIBRACaseAgainstMilei
50,388 views
608 Discussing