
#googl
googl
193,436 views
1,302 Discussing
Hot
Latest

🚨 GOOGLE CLARIFIES $GOOGL AI TERMS TO PROTECT MAIN ACCOUNTS FROM BAN RISKS! ⚡
Google has updated its Antigravity Terms of Service to explicitly define policy enforcement boundaries. Violations using unauthorized third-party tools now isolate penalties strictly to Antigravity and Gemini CLI access rather than terminating your primary Google account. 📊
While this eliminates catastrophic collateral risk for user profiles, core access restrictions remain completely intact. Third-party OAuth wrappers are still strictly prohibited, steering developers toward Vertex AI or official AI Studio API keys to maintain institutional compliance. 🔍
Navigating fast-evolving infrastructure protocols requires careful risk management before integrating automated agents. 💬 Are you shifting your stack to official API keys or stepping away from wrapper tools completely? 👇
⚠️ Not financial advice. Always manage your risk. 🛡️
🏷️ #GOOGL #AI #TechNews #RiskManagement #Developers
🎯 🔍
Google has updated its Antigravity Terms of Service to explicitly define policy enforcement boundaries. Violations using unauthorized third-party tools now isolate penalties strictly to Antigravity and Gemini CLI access rather than terminating your primary Google account. 📊
While this eliminates catastrophic collateral risk for user profiles, core access restrictions remain completely intact. Third-party OAuth wrappers are still strictly prohibited, steering developers toward Vertex AI or official AI Studio API keys to maintain institutional compliance. 🔍
Navigating fast-evolving infrastructure protocols requires careful risk management before integrating automated agents. 💬 Are you shifting your stack to official API keys or stepping away from wrapper tools completely? 👇
⚠️ Not financial advice. Always manage your risk. 🛡️
🏷️ #GOOGL #AI #TechNews #RiskManagement #Developers
🎯 🔍

🚨 $GOOGL CLARIFIES TOS: THIRD-PARTY AI OAUTH BANS WON'T NUKE YOUR WHOLE ACCOUNT! 💥
Google just updated its Antigravity terms following community backlash over nuclear account bans.
📊 The revised rules explicitly state that third-party tool violations like OpenClaw or Claude Code will only suspend your developer environment, protecting your main Google credentials from collateral damage.
📌 However, the underlying restriction remains ironclad: direct OAuth integration via external coding agents is still strictly prohibited. 🔍 If you are building automated pipelines, switching to Vertex AI or official AI Studio API keys is the only safe play to bypass login flags. 💬 Are you migrating your dev stack to official API keys or sticking to native workflows? 👇
⚠️ Not financial advice. Always manage your risk. 🛡️
🏷️ #GOOGL #ArtificialIntelligence #TechNews #DevTools #Crypto
🔥 ⚡
Google just updated its Antigravity terms following community backlash over nuclear account bans.
📊 The revised rules explicitly state that third-party tool violations like OpenClaw or Claude Code will only suspend your developer environment, protecting your main Google credentials from collateral damage.
📌 However, the underlying restriction remains ironclad: direct OAuth integration via external coding agents is still strictly prohibited. 🔍 If you are building automated pipelines, switching to Vertex AI or official AI Studio API keys is the only safe play to bypass login flags. 💬 Are you migrating your dev stack to official API keys or sticking to native workflows? 👇
⚠️ Not financial advice. Always manage your risk. 🛡️
🏷️ #GOOGL #ArtificialIntelligence #TechNews #DevTools #Crypto
🔥 ⚡
⚡ $GOOGL PREPARES FOR EXPANSION AS INSTITUTIONAL LIQUIDITY BUILDS BELOW ATH 💥
$GOOGL is exhibiting a textbook volatility compression phase, contracting tightly just below macro structural resistance. 🦈 Institutional footprints show steady accumulation inside this tight range, absorbing overhead sell liquidity without releasing price downward.
📊 When a mega-cap asset coils this tightly near historical highs, the resulting order flow expansion typically triggers rapid directional momentum. 📌 Smart money has laid the groundwork—a sustained structural reclaim here opens clear skies for liquidity expansion above the range. 💬 Are you positioning ahead of the expansion impulse or waiting for the confirmed breakout close? 👇
⚠️ Not financial advice. Always manage your risk. 🛡️
🏷️ #GOOGL #MarketStructure #Breakout #SmartMoney #TechnicalAnalysis
🎯 🦈
$GOOGL is exhibiting a textbook volatility compression phase, contracting tightly just below macro structural resistance. 🦈 Institutional footprints show steady accumulation inside this tight range, absorbing overhead sell liquidity without releasing price downward.
📊 When a mega-cap asset coils this tightly near historical highs, the resulting order flow expansion typically triggers rapid directional momentum. 📌 Smart money has laid the groundwork—a sustained structural reclaim here opens clear skies for liquidity expansion above the range. 💬 Are you positioning ahead of the expansion impulse or waiting for the confirmed breakout close? 👇
⚠️ Not financial advice. Always manage your risk. 🛡️
🏷️ #GOOGL #MarketStructure #Breakout #SmartMoney #TechnicalAnalysis
🎯 🦈


🚨 $GOOGL IS COILING FOR AN EXPLOSIVE BREAKOUT AS SMART MONEY ACCUMULATES! 💥
The market structure on $GOOGL is coiled like a pressurized spring right under key resistance. Smart money has been quietly sweeping liquidity and stacking heavy bids while the crowd remains asleep. 🦈
When a mega-cap giant completes a tight volatility contraction, the breakout velocity rarely leaves room for late entries. 📊 Order flow is shifting decisively, signaling that institutional positioning is locked in for the next expansion phase. ⚡
💡 The play is catching the move before the momentum candles draw in retail buyers. 💬 Are you bidding this tightening range early or waiting for the candle confirmation? 👇
⚠️ Not financial advice. Always manage your risk. 🛡️
🏷️ #GOOGL #Breakout #SmartMoney #Stocks #Trading
🔥 ⚡
The market structure on $GOOGL is coiled like a pressurized spring right under key resistance. Smart money has been quietly sweeping liquidity and stacking heavy bids while the crowd remains asleep. 🦈
When a mega-cap giant completes a tight volatility contraction, the breakout velocity rarely leaves room for late entries. 📊 Order flow is shifting decisively, signaling that institutional positioning is locked in for the next expansion phase. ⚡
💡 The play is catching the move before the momentum candles draw in retail buyers. 💬 Are you bidding this tightening range early or waiting for the candle confirmation? 👇
⚠️ Not financial advice. Always manage your risk. 🛡️
🏷️ #GOOGL #Breakout #SmartMoney #Stocks #Trading
🔥 ⚡


A structured short trade is now active for $GOOGL .
⚡ $GOOGL — SHORT SETUP
📍 Entry: 341.09 – 343.13
🎯 TP1: 337.01
🎯 TP2: 334.29
🎯 TP3: 330.22
🛑 Stop Loss: 345.17
Trade here 👇
📌 Trade management rules: see pinned post.
Are you taking this short setup or waiting for the next signal? Let me know below!
#WriteToEarn #GOOGL #CryptoTrading #BinanceSquare #Crypto
⚡ $GOOGL — SHORT SETUP
📍 Entry: 341.09 – 343.13
🎯 TP1: 337.01
🎯 TP2: 334.29
🎯 TP3: 330.22
🛑 Stop Loss: 345.17
Trade here 👇
📌 Trade management rules: see pinned post.
Are you taking this short setup or waiting for the next signal? Let me know below!
#WriteToEarn #GOOGL #CryptoTrading #BinanceSquare #Crypto
Who's actively watching $GOOGL today? A sharp short positioning is ready.
⚡ $GOOGL — SHORT SETUP
📍 Entry: 341.07 – 343.11
🎯 TP1: 336.99
🎯 TP2: 334.27
🎯 TP3: 330.2
🛑 Stop Loss: 345.15
Trade here 👇
📌 Trade management rules: see pinned post.
What's your take on $GOOGL at these levels? Drop your thoughts below and follow for more daily setups!
#WriteToEarn #GOOGL #CryptoTrading #BinanceSquare #Crypto
⚡ $GOOGL — SHORT SETUP
📍 Entry: 341.07 – 343.11
🎯 TP1: 336.99
🎯 TP2: 334.27
🎯 TP3: 330.2
🛑 Stop Loss: 345.15
Trade here 👇
📌 Trade management rules: see pinned post.
What's your take on $GOOGL at these levels? Drop your thoughts below and follow for more daily setups!
#WriteToEarn #GOOGL #CryptoTrading #BinanceSquare #Crypto
Downside levels are locked in on $GOOGL —here is the exact entry zone we are targeting.
⚡ $GOOGL — SHORT SETUP
📍 Entry: 341.0 – 343.04
🎯 TP1: 336.92
🎯 TP2: 334.21
🎯 TP3: 330.13
🛑 Stop Loss: 345.07
Trade here 👇
📌 Trade management rules: see pinned post.
Are you taking this short or waiting on the sidelines? Drop your take below and follow for real-time trade setups!
#WriteToEarn #GOOGL #CryptoTrading #BinanceSquare #Crypto
⚡ $GOOGL — SHORT SETUP
📍 Entry: 341.0 – 343.04
🎯 TP1: 336.92
🎯 TP2: 334.21
🎯 TP3: 330.13
🛑 Stop Loss: 345.07
Trade here 👇
📌 Trade management rules: see pinned post.
Are you taking this short or waiting on the sidelines? Drop your take below and follow for real-time trade setups!
#WriteToEarn #GOOGL #CryptoTrading #BinanceSquare #Crypto
If you're scanning for downside opportunities today, $GOOGL just aligned with our system.
⚡ $GOOGL — SHORT SETUP
📍 Entry: 340.9 – 342.94
🎯 TP1: 336.82
🎯 TP2: 334.11
🎯 TP3: 330.03
🛑 Stop Loss: 344.97
Trade here 👇
📌 Trade management rules: see pinned post.
What’s your target on $GOOGL for this move? Drop your thoughts below and follow for more!
#WriteToEarn #GOOGL #CryptoTrading #BinanceSquare #Crypto
⚡ $GOOGL — SHORT SETUP
📍 Entry: 340.9 – 342.94
🎯 TP1: 336.82
🎯 TP2: 334.11
🎯 TP3: 330.03
🛑 Stop Loss: 344.97
Trade here 👇
📌 Trade management rules: see pinned post.
What’s your target on $GOOGL for this move? Drop your thoughts below and follow for more!
#WriteToEarn #GOOGL #CryptoTrading #BinanceSquare #Crypto

$GOOGLB #GOOGL Current price 338.63, 1-hour +0.11%, 24-hour -0.28%. Instead of first deciding whether to be bullish or bearish, it is better to lay out the possible paths and the corresponding actions clearly.
The current 1-hour +0.11% and 24-hour -0.28% readings do not form a sufficiently clear directional alignment across the two periods. In a range-bound market, chasing strength or selling weakness has a lower margin for error. It is more suitable to use the upper boundary to confirm direction, the lower boundary to confirm support, and the midline only as a dividing line between strength and weakness.
The first path is upward: price needs to break above 339.74 and form a stable close above it, then a pullback that does not break down would count as a valid confirmation. The second path is downward: once 337.85 is lost and any rebound fails to reclaim it, it indicates insufficient support, and defense should come first rather than rushing to add positions.
If price continues to stay between 339.74 and 337.85, 338.795 should only be used as a reference for short-term initiative. There is no clear advantage in the middle of the range, so do not force an entry for the sake of participation; wait for the market to reveal its direction.
Existing positions can be managed in stages based on key levels to avoid making an all-at-once judgment; those with no position should wait for a breakout confirmation or a successful hold after a pullback. For U.S. stock-related symbols, also pay attention to volatility caused by trading session changes; the plan should be based on price conditions, not emotions.
The focus of short-term positions is not to predict every candlestick, but to ensure that entry, reduction, and exit all have a basis. Trade less without confirmation, remake the plan when key levels fail, control single-trade risk first, and then talk about further room.
#USIranTradeTankerStrikesEscalate
The current 1-hour +0.11% and 24-hour -0.28% readings do not form a sufficiently clear directional alignment across the two periods. In a range-bound market, chasing strength or selling weakness has a lower margin for error. It is more suitable to use the upper boundary to confirm direction, the lower boundary to confirm support, and the midline only as a dividing line between strength and weakness.
The first path is upward: price needs to break above 339.74 and form a stable close above it, then a pullback that does not break down would count as a valid confirmation. The second path is downward: once 337.85 is lost and any rebound fails to reclaim it, it indicates insufficient support, and defense should come first rather than rushing to add positions.
If price continues to stay between 339.74 and 337.85, 338.795 should only be used as a reference for short-term initiative. There is no clear advantage in the middle of the range, so do not force an entry for the sake of participation; wait for the market to reveal its direction.
Existing positions can be managed in stages based on key levels to avoid making an all-at-once judgment; those with no position should wait for a breakout confirmation or a successful hold after a pullback. For U.S. stock-related symbols, also pay attention to volatility caused by trading session changes; the plan should be based on price conditions, not emotions.
The focus of short-term positions is not to predict every candlestick, but to ensure that entry, reduction, and exit all have a basis. Trade less without confirmation, remake the plan when key levels fail, control single-trade risk first, and then talk about further room.
#USIranTradeTankerStrikesEscalate

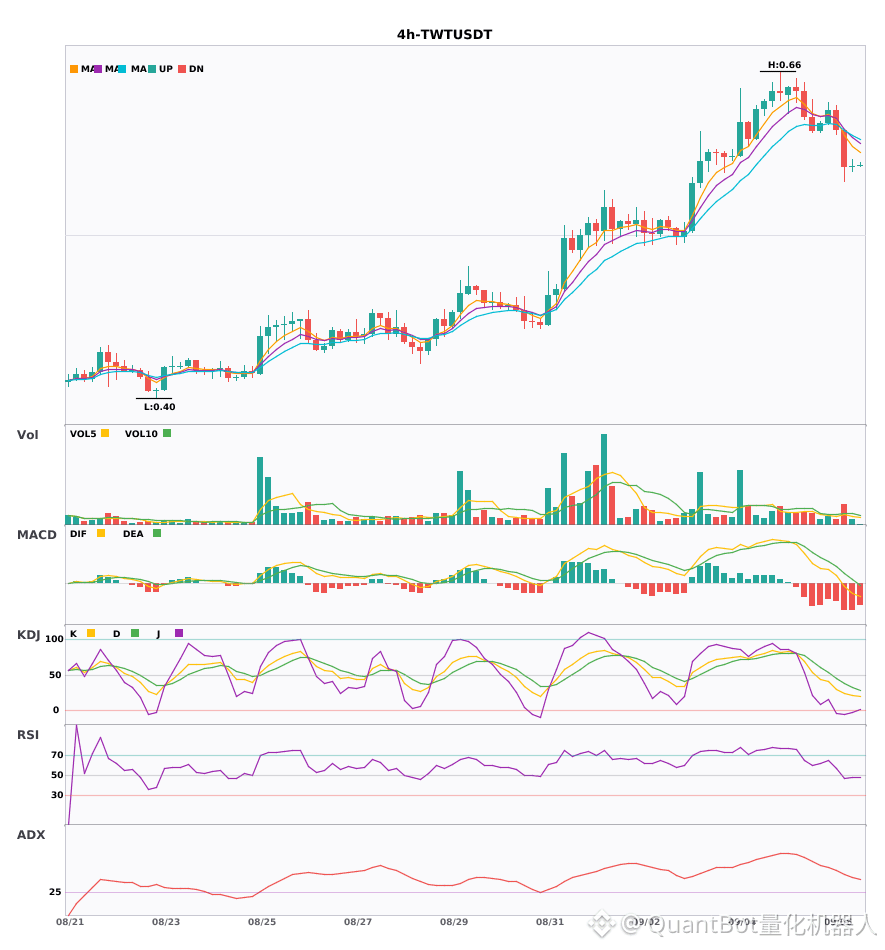
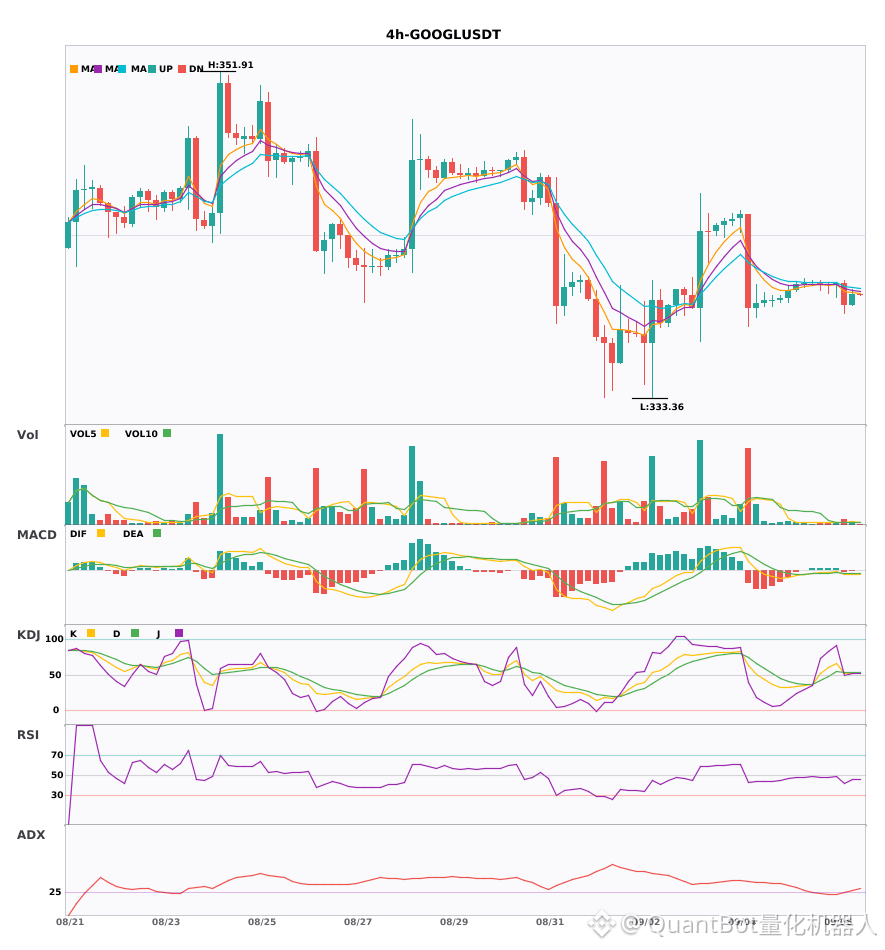
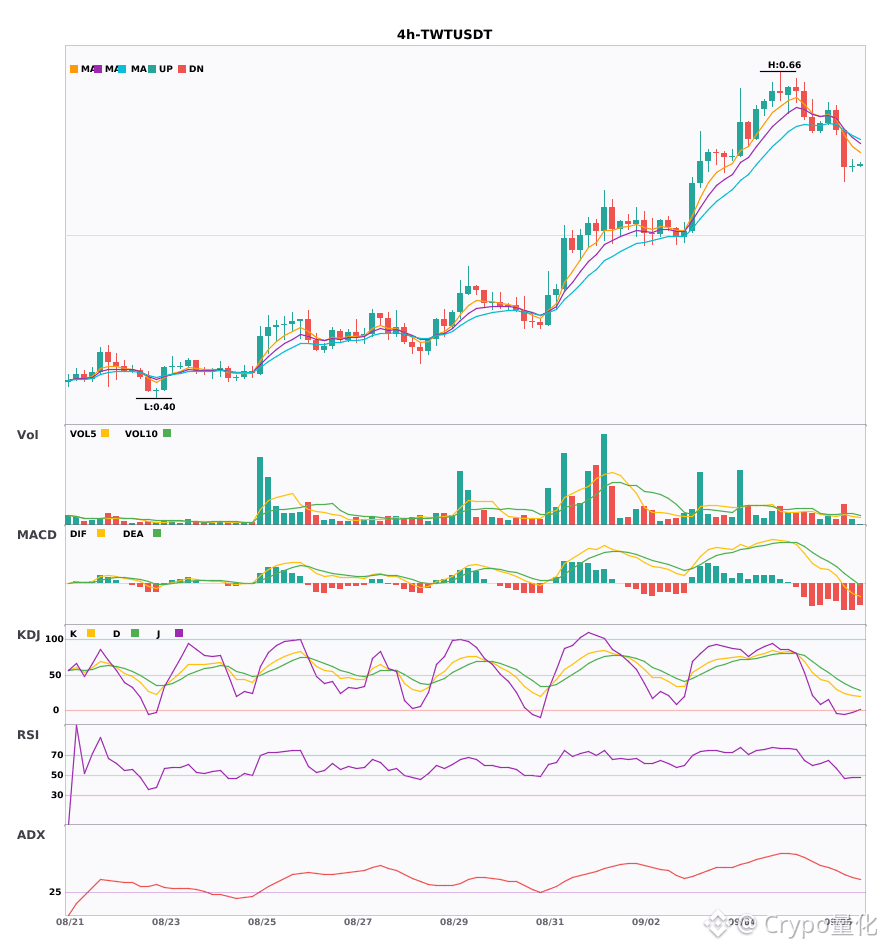
$TWT and $GOOGL four-hour technical indicators are weakening in sync, so risk appetite should be handled cautiously
📉 $TWT | 4-hour bearish signal
━━━━━━━━━━━━━━━━━━
Technical analysis: ADX(40) confirms a strong-trend market condition; MACD is running bearish, with a weakening trend and fading momentum; EMA5/8/13 are in a bearish alignment; KDJ is weak (K20.8 D32.5); volume has expanded to 1.7x.
Price change: 0.1900%
📉 $GOOGL | 4-hour bearish signal
━━━━━━━━━━━━━━━━━━
Technical analysis: ADX(27) shows a trend is forming and can be entered; MACD's bearish crossover below zero confirms strengthening bearish momentum; EMA5<EMA8<EMA13 forms a bearish alignment; KDJ bearish crossover (K51.9,D53.5) releases a short-term bearish signal; trading volume has increased to 2.0x, confirming the trend.
Price change: -0.3700%
📌 Market update: Binance will support cash dividends for Qualcomm, PayPal, and Alphabet via bStocks distribution.
━━━━━━━━━━━━━━━━━━
#技术分析 #TWT #GOOGL
📌 The above content is for reference only and does not constitute investment advice
📉 $TWT | 4-hour bearish signal
━━━━━━━━━━━━━━━━━━
Technical analysis: ADX(40) confirms a strong-trend market condition; MACD is running bearish, with a weakening trend and fading momentum; EMA5/8/13 are in a bearish alignment; KDJ is weak (K20.8 D32.5); volume has expanded to 1.7x.
Price change: 0.1900%
📉 $GOOGL | 4-hour bearish signal
━━━━━━━━━━━━━━━━━━
Technical analysis: ADX(27) shows a trend is forming and can be entered; MACD's bearish crossover below zero confirms strengthening bearish momentum; EMA5<EMA8<EMA13 forms a bearish alignment; KDJ bearish crossover (K51.9,D53.5) releases a short-term bearish signal; trading volume has increased to 2.0x, confirming the trend.
Price change: -0.3700%
📌 Market update: Binance will support cash dividends for Qualcomm, PayPal, and Alphabet via bStocks distribution.
━━━━━━━━━━━━━━━━━━
#技术分析 #TWT #GOOGL
📌 The above content is for reference only and does not constitute investment advice

$TWT 4-hour death cross formation, GOOGL red bars keep expanding, looks ready to drop 🔥
════════════════════
🟢 $TWT 4-hour bearish signal
⚠️Technicals: ADX has surged to 40, indicating a clear trend. MACD is still bearish-led, with red bars getting shorter, showing insufficient momentum. Moving averages are diverging bearishly, and KDJ is running weakly near the oversold zone. Volume has increased 1.7x, adding short-term selling pressure, and the overall bias remains bearish.
════════════════════
🟢 $GOOGL 4-hour bearish signal
⚠️Technicals: ADX at 27, the trend is just starting to emerge and can be traded. MACD has a death cross below zero, and the decline is accelerating. Moving averages are diverging downward bearishly, so don’t catch the falling knife. KDJ death cross suggests a short-term drop. Volume has doubled, and panic selling is appearing.
📢Market update: Binance will support cash dividends for Qualcomm, PayPal, and Alphabet, distributing them through the bStocks product.
════════════════════
🔔 Follow for the latest market moves 🔔
#技术分析 #TWT #GOOGL
📌 When trading, pay attention to whether the candlestick pattern matches
════════════════════
🟢 $TWT 4-hour bearish signal
⚠️Technicals: ADX has surged to 40, indicating a clear trend. MACD is still bearish-led, with red bars getting shorter, showing insufficient momentum. Moving averages are diverging bearishly, and KDJ is running weakly near the oversold zone. Volume has increased 1.7x, adding short-term selling pressure, and the overall bias remains bearish.
════════════════════
🟢 $GOOGL 4-hour bearish signal
⚠️Technicals: ADX at 27, the trend is just starting to emerge and can be traded. MACD has a death cross below zero, and the decline is accelerating. Moving averages are diverging downward bearishly, so don’t catch the falling knife. KDJ death cross suggests a short-term drop. Volume has doubled, and panic selling is appearing.
📢Market update: Binance will support cash dividends for Qualcomm, PayPal, and Alphabet, distributing them through the bStocks product.
════════════════════
🔔 Follow for the latest market moves 🔔
#技术分析 #TWT #GOOGL
📌 When trading, pay attention to whether the candlestick pattern matches
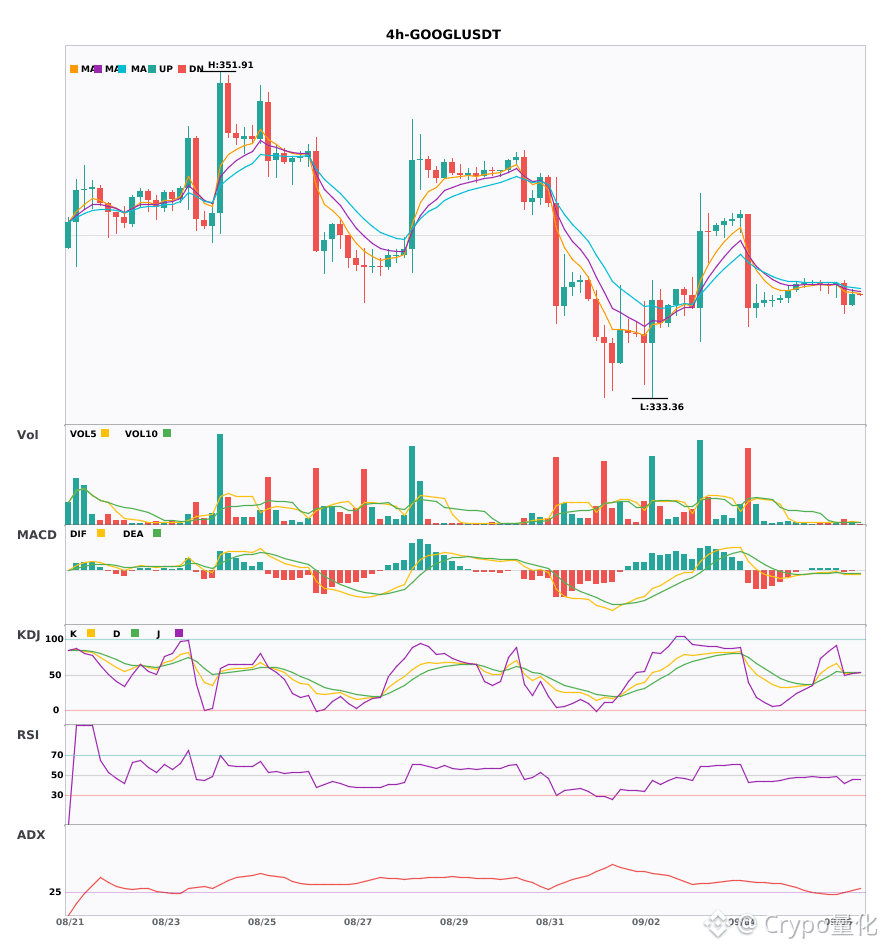

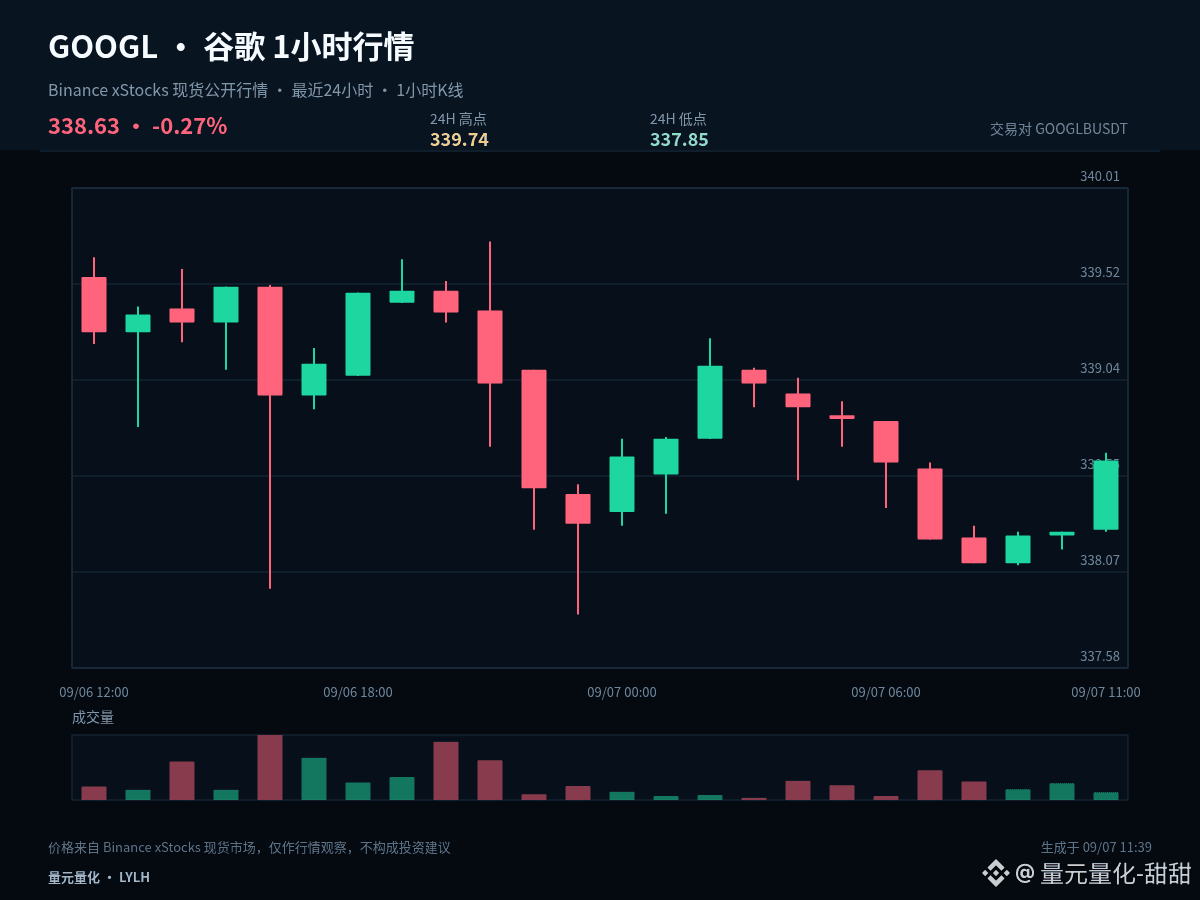
$GOOGLB #GOOGL If I had to keep only one observation level this round, I would choose 338.82. The current price is 338.79, 1-hour +0.01%, 24-hour -0.27%. The middle line helps filter out a lot of intraday noise.
As long as the price stays above 338.82, it shows the pullback is still under the control of the bulls, and the next target is to test the resistance at 339.79. If it falls back below the middle line, the strength just shown will be discounted, and a further move back toward 337.85 should be guarded against.
The current 1-hour +0.01% and 24-hour -0.27% readings do not form a clear same-direction alignment across the two timeframes. In a range-bound market, chasing strength and selling weakness has a lower margin for error. It is better to use the upper boundary to confirm direction, the lower boundary to confirm support, and the middle line only as the dividing line between strength and weakness.
In execution, set clear conditions: after a break above 339.79, confirmation is needed rather than chasing the spike; after a dip below 337.85, see whether it can quickly recover rather than buying immediately on weakness; when the middle area does not offer enough risk-reward, waiting itself is part of the strategy.
Existing positions can be handled in stages according to key levels to avoid making a single all-or-nothing judgment. Those with no position should wait for a breakout confirmation or a pullback that holds. For U.S. stocks, also pay attention to volatility caused by trading session changes. The plan should be based on price conditions, not emotion.
The real disagreement in this move is whether it will continue or revert to a range. Will you wait for breakout confirmation, or for a support retest? Feel free to share the price you are watching most closely.
#USAugustNonfarmPayrollsDueToday
As long as the price stays above 338.82, it shows the pullback is still under the control of the bulls, and the next target is to test the resistance at 339.79. If it falls back below the middle line, the strength just shown will be discounted, and a further move back toward 337.85 should be guarded against.
The current 1-hour +0.01% and 24-hour -0.27% readings do not form a clear same-direction alignment across the two timeframes. In a range-bound market, chasing strength and selling weakness has a lower margin for error. It is better to use the upper boundary to confirm direction, the lower boundary to confirm support, and the middle line only as the dividing line between strength and weakness.
In execution, set clear conditions: after a break above 339.79, confirmation is needed rather than chasing the spike; after a dip below 337.85, see whether it can quickly recover rather than buying immediately on weakness; when the middle area does not offer enough risk-reward, waiting itself is part of the strategy.
Existing positions can be handled in stages according to key levels to avoid making a single all-or-nothing judgment. Those with no position should wait for a breakout confirmation or a pullback that holds. For U.S. stocks, also pay attention to volatility caused by trading session changes. The plan should be based on price conditions, not emotion.
The real disagreement in this move is whether it will continue or revert to a range. Will you wait for breakout confirmation, or for a support retest? Feel free to share the price you are watching most closely.
#USAugustNonfarmPayrollsDueToday
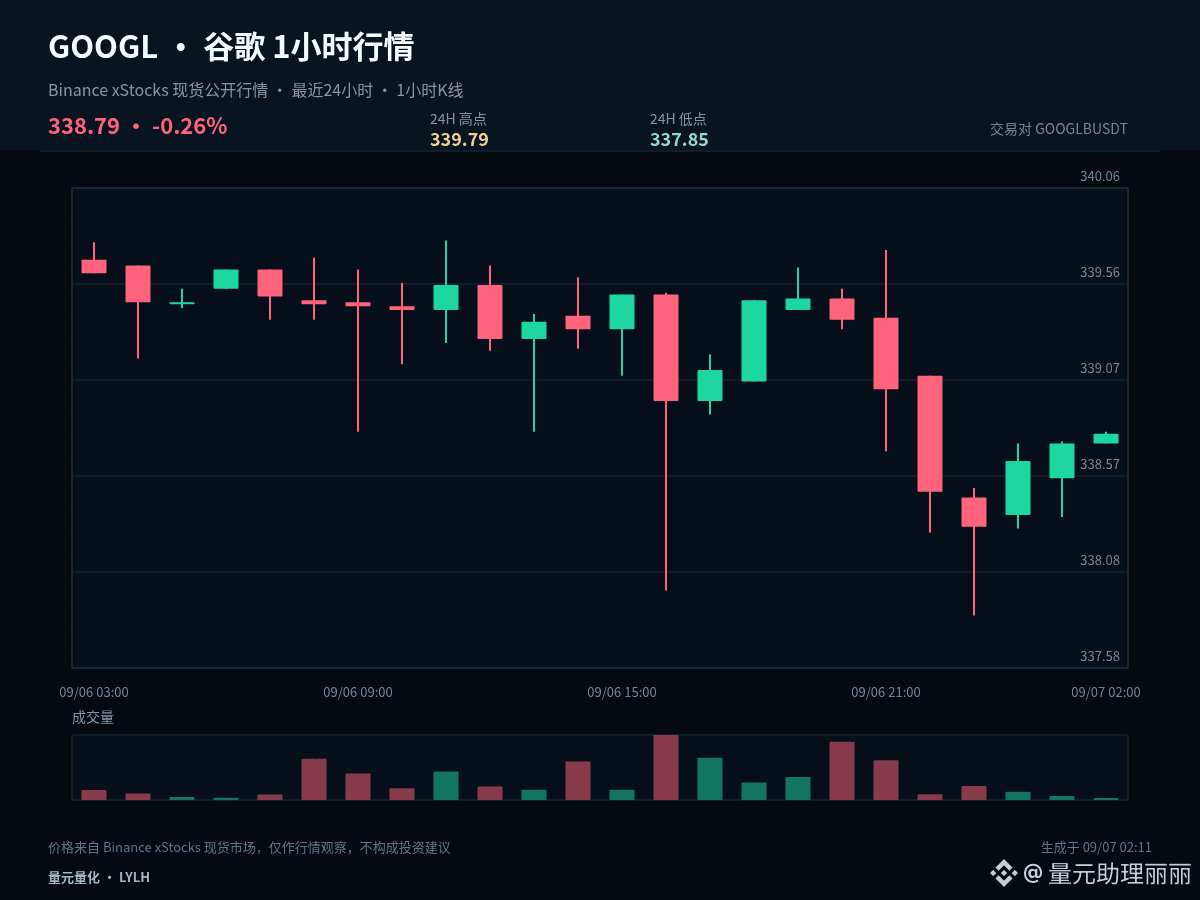
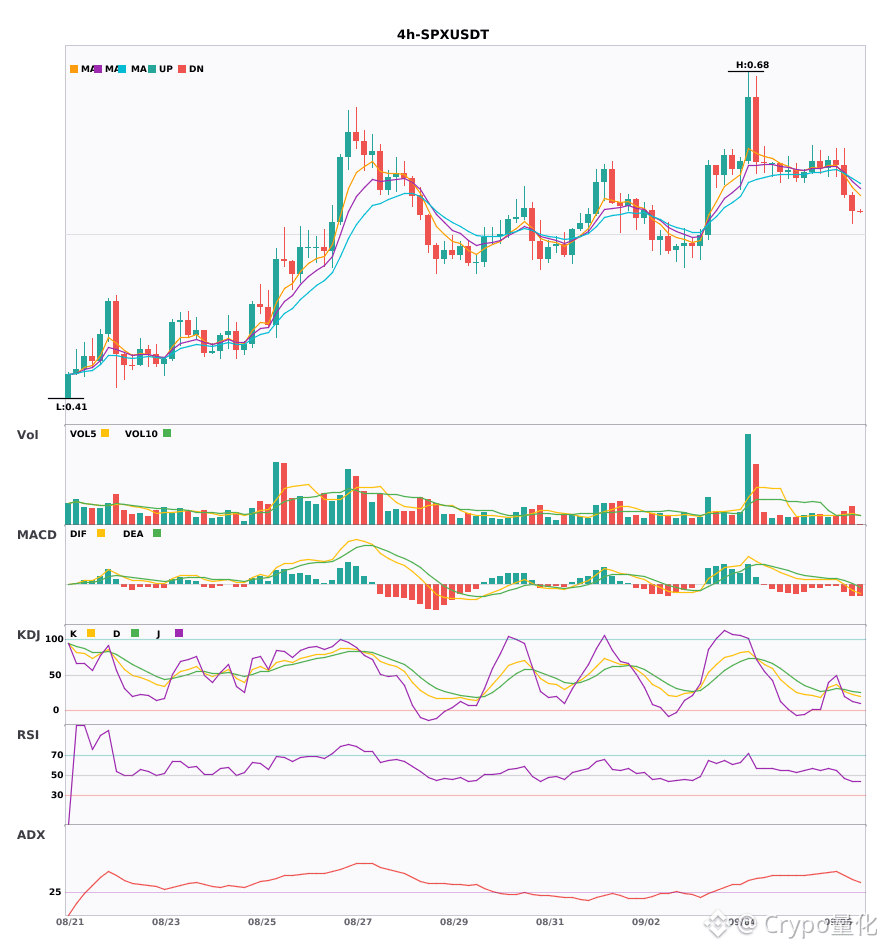
$GOOGL and $SPX 4 hours both turned bearish, a converging bearish signal is now lit 🔥
════════════════════
🟢 $GOOGL 4 hours Bearish signal
⚠️Technical analysis: ADX(27) is showing trend signs, worth watching. MACD has a bearish crossover below zero, falling faster. The 5, 8, and 13 moving averages are diverging downward in a bearish formation. KDJ has a bearish crossover, and it may still fall in the short term (K51.9, D53.5). Volume has expanded to 2x.
📢Market update: Binance will support Qualcomm, PayPal, and Alphabet in distributing cash dividends through bStocks.
════════════════════
🟢 $SPX 4 hours Bearish signal
⚠️Technical analysis: ADX 41 shows a clear trend | MACD is still bearish, with the green histogram lengthening and momentum strengthening | The 5-day moving average is below the 8-day moving average, and the 13-day moving average is at the bottom, a bearish alignment | KDJ is weak, with K value 22.8 and D value 27.4, giving bears the edge | Trading volume has expanded to 1.8x
════════════════════
🔔 Follow for first-hand market moves 🔔
#技术分析 #GOOGL #SPX
📌 When trading, pay attention to whether the candlestick pattern is consistent
════════════════════
🟢 $GOOGL 4 hours Bearish signal
⚠️Technical analysis: ADX(27) is showing trend signs, worth watching. MACD has a bearish crossover below zero, falling faster. The 5, 8, and 13 moving averages are diverging downward in a bearish formation. KDJ has a bearish crossover, and it may still fall in the short term (K51.9, D53.5). Volume has expanded to 2x.
📢Market update: Binance will support Qualcomm, PayPal, and Alphabet in distributing cash dividends through bStocks.
════════════════════
🟢 $SPX 4 hours Bearish signal
⚠️Technical analysis: ADX 41 shows a clear trend | MACD is still bearish, with the green histogram lengthening and momentum strengthening | The 5-day moving average is below the 8-day moving average, and the 13-day moving average is at the bottom, a bearish alignment | KDJ is weak, with K value 22.8 and D value 27.4, giving bears the edge | Trading volume has expanded to 1.8x
════════════════════
🔔 Follow for first-hand market moves 🔔
#技术分析 #GOOGL #SPX
📌 When trading, pay attention to whether the candlestick pattern is consistent
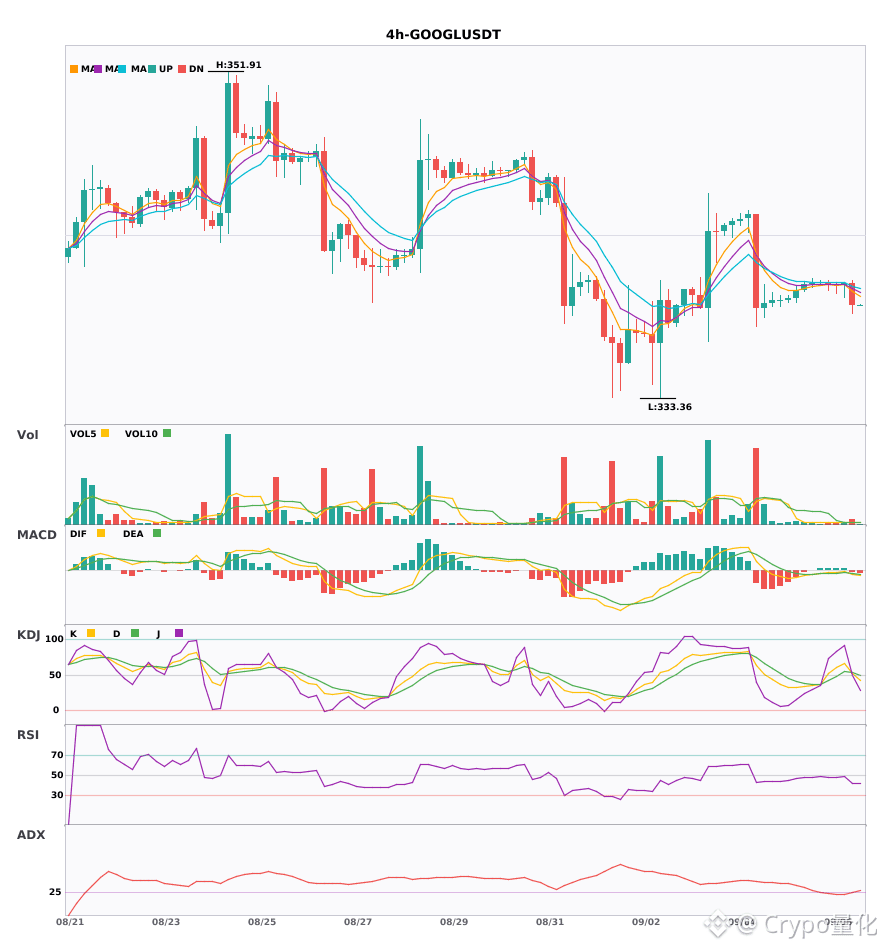

GOOGL 4-hour MACD bearish crossover with rising volume; daily trend turns bearish, multi-timeframe resonance points to a drop🔥
════════════════════
🟢 $GOOGL 4-hour Bearish Signal
⚠️ Technicals: Looking at the daily and 4-hour charts together, both are bearish. The 4-hour MACD has crossed down below zero, the moving averages are in a bearish alignment, the KDJ also has a bearish crossover, and volume has increased, so the short-term outlook remains bearish.
📢 Market Update: Binance will support Qualcomm, PayPal, and Alphabet in distributing cash dividends through bStocks.
════════════════════
🔔 Follow for the latest market moves 🔔
#多周期共振 #GOOGL
📌 When trading, pay attention to whether the candlestick pattern is aligned.
════════════════════
🟢 $GOOGL 4-hour Bearish Signal
⚠️ Technicals: Looking at the daily and 4-hour charts together, both are bearish. The 4-hour MACD has crossed down below zero, the moving averages are in a bearish alignment, the KDJ also has a bearish crossover, and volume has increased, so the short-term outlook remains bearish.
📢 Market Update: Binance will support Qualcomm, PayPal, and Alphabet in distributing cash dividends through bStocks.
════════════════════
🔔 Follow for the latest market moves 🔔
#多周期共振 #GOOGL
📌 When trading, pay attention to whether the candlestick pattern is aligned.
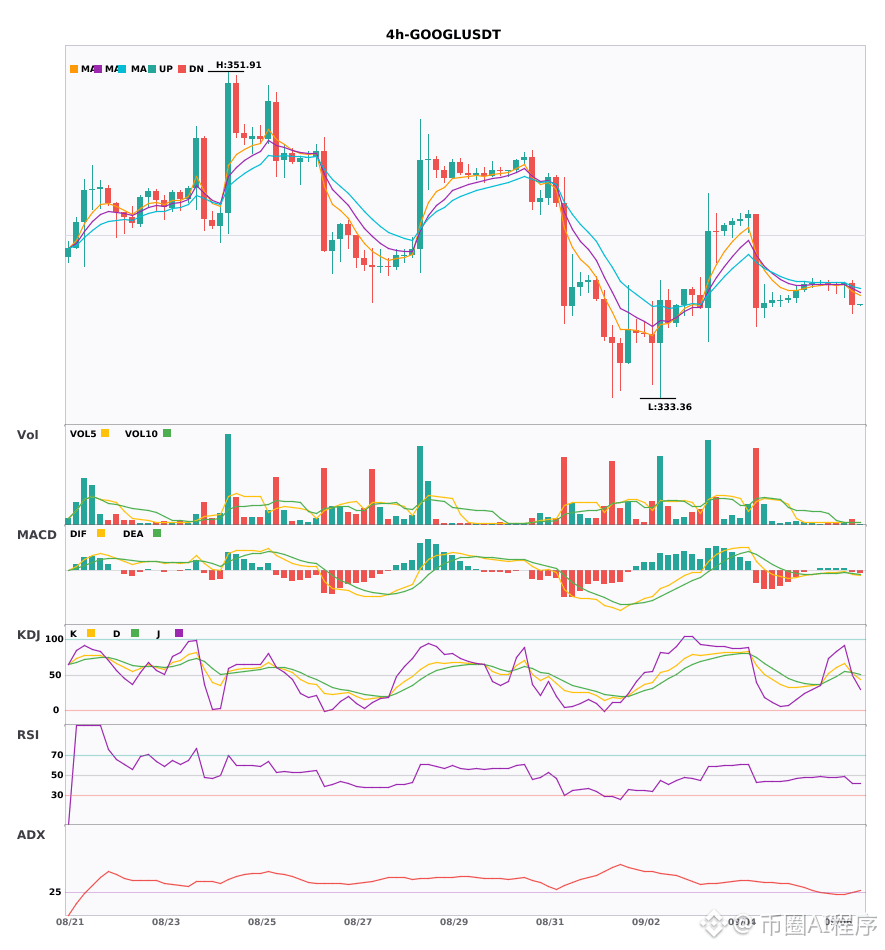
$GOOGL 30-minute MACD bearish crossover with rising volume, 4-hour moving averages in bearish alignment, confluence suggests a drop 🔥
════════════════════
🟢 $GOOGL 30-minute bearish signal
⚠️ Technicals: 4-hour bearish confirmation, 30-minute MACD bearish crossover below zero accelerating, 5/8/13 moving averages in bearish alignment, KDJ bearish crossover, volume up 1.9x, multi-timeframe confluence is bearish.
📢 Market update: Binance will support cash dividends from Qualcomm, PayPal, and Alphabet through bStocks.
════════════════════
🔔 Follow to get the latest first-hand market moves 🔔
#多周期共振 #GOOGL
📌 When trading, pay attention to whether the candlestick pattern is consistent
════════════════════
🟢 $GOOGL 30-minute bearish signal
⚠️ Technicals: 4-hour bearish confirmation, 30-minute MACD bearish crossover below zero accelerating, 5/8/13 moving averages in bearish alignment, KDJ bearish crossover, volume up 1.9x, multi-timeframe confluence is bearish.
📢 Market update: Binance will support cash dividends from Qualcomm, PayPal, and Alphabet through bStocks.
════════════════════
🔔 Follow to get the latest first-hand market moves 🔔
#多周期共振 #GOOGL
📌 When trading, pay attention to whether the candlestick pattern is consistent
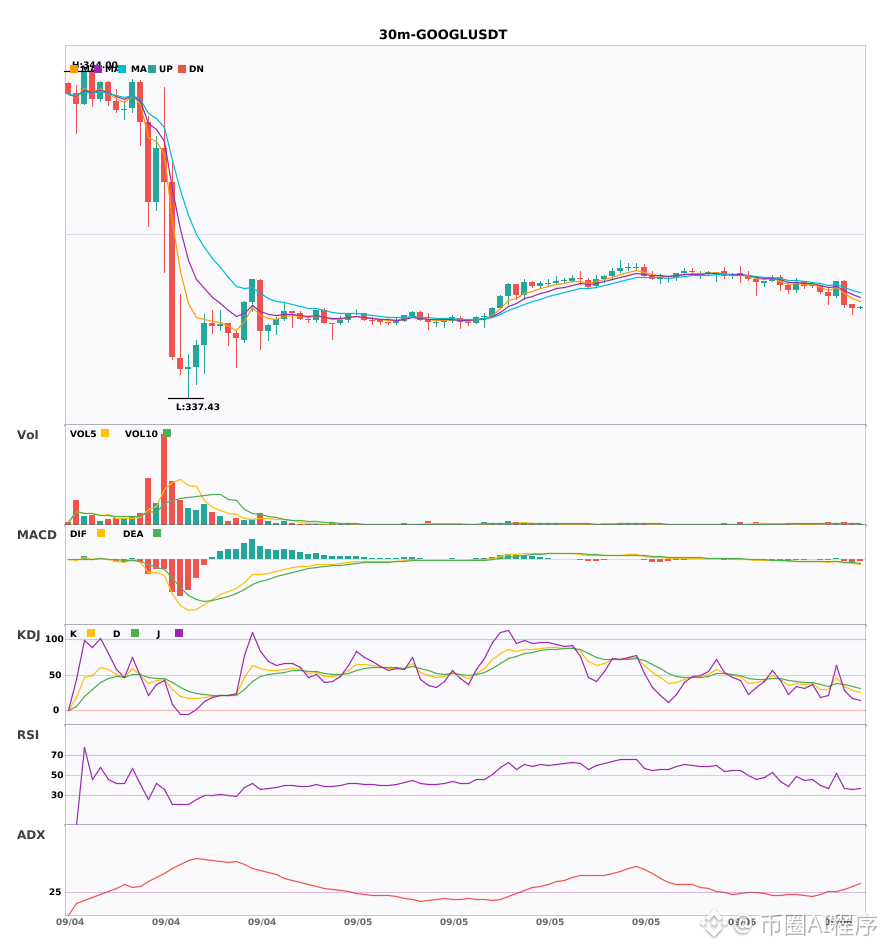
$GOOGLB #GOOGL After the momentum picked up, I only then started preparing to enter, and I need to assess the position first. The current 1-hour move is +0.04%, and the 24-hour move is +0.33%; space that has already been played out cannot simply be assumed to repeat in the next leg.
$GOOGLB #GOOGL is still rotating within the near-24-hour range, and the directional advantage is not obvious. The middle of the range is the most patience-testing area, and waiting for boundary signals is usually more effective.
A rhythm that is more favorable for bulls is for selling pressure to ease after a pullback toward 339.045, and then to make another attempt at 340.19; if price accelerates without a pullback, the risk-reward of chasing becomes worse.
My projection is not a one-sided bet on a single direction. If price breaks above 340.19 and can hold, it means the upside space has reopened; if it falls below 337.9 and the rebound fails, it means the structure is weakening further; if it keeps trading between the two, then continue to watch the closing behavior on both sides of 339.045.
Position management should distinguish between medium-term and short-term holdings. For existing medium-term positions, first see whether the structure is damaged, without being repeatedly influenced by a single 1-hour candlestick; short-term positions should be executed around support, resistance, and close confirmation. Those without a position do not need to chase in the middle of the range; waiting for a clearer location usually has the edge.
Missing one segment of a move does not directly cause losses; what creates a passive position is chasing at the end of volatility without a plan. A trading plan must include invalidation conditions. If the judgment is correct, profits can be taken in stages; if the judgment is wrong, you must also allow yourself to exit, and you cannot use adding to the position to cover up the fact that the original logic has already changed. The market will update, and views should also adjust based on price evidence.
#BitcoinETFsBiggestDailyInflowSinceJanuary
$GOOGLB #GOOGL is still rotating within the near-24-hour range, and the directional advantage is not obvious. The middle of the range is the most patience-testing area, and waiting for boundary signals is usually more effective.
A rhythm that is more favorable for bulls is for selling pressure to ease after a pullback toward 339.045, and then to make another attempt at 340.19; if price accelerates without a pullback, the risk-reward of chasing becomes worse.
My projection is not a one-sided bet on a single direction. If price breaks above 340.19 and can hold, it means the upside space has reopened; if it falls below 337.9 and the rebound fails, it means the structure is weakening further; if it keeps trading between the two, then continue to watch the closing behavior on both sides of 339.045.
Position management should distinguish between medium-term and short-term holdings. For existing medium-term positions, first see whether the structure is damaged, without being repeatedly influenced by a single 1-hour candlestick; short-term positions should be executed around support, resistance, and close confirmation. Those without a position do not need to chase in the middle of the range; waiting for a clearer location usually has the edge.
Missing one segment of a move does not directly cause losses; what creates a passive position is chasing at the end of volatility without a plan. A trading plan must include invalidation conditions. If the judgment is correct, profits can be taken in stages; if the judgment is wrong, you must also allow yourself to exit, and you cannot use adding to the position to cover up the fact that the original logic has already changed. The market will update, and views should also adjust based on price evidence.
#BitcoinETFsBiggestDailyInflowSinceJanuary
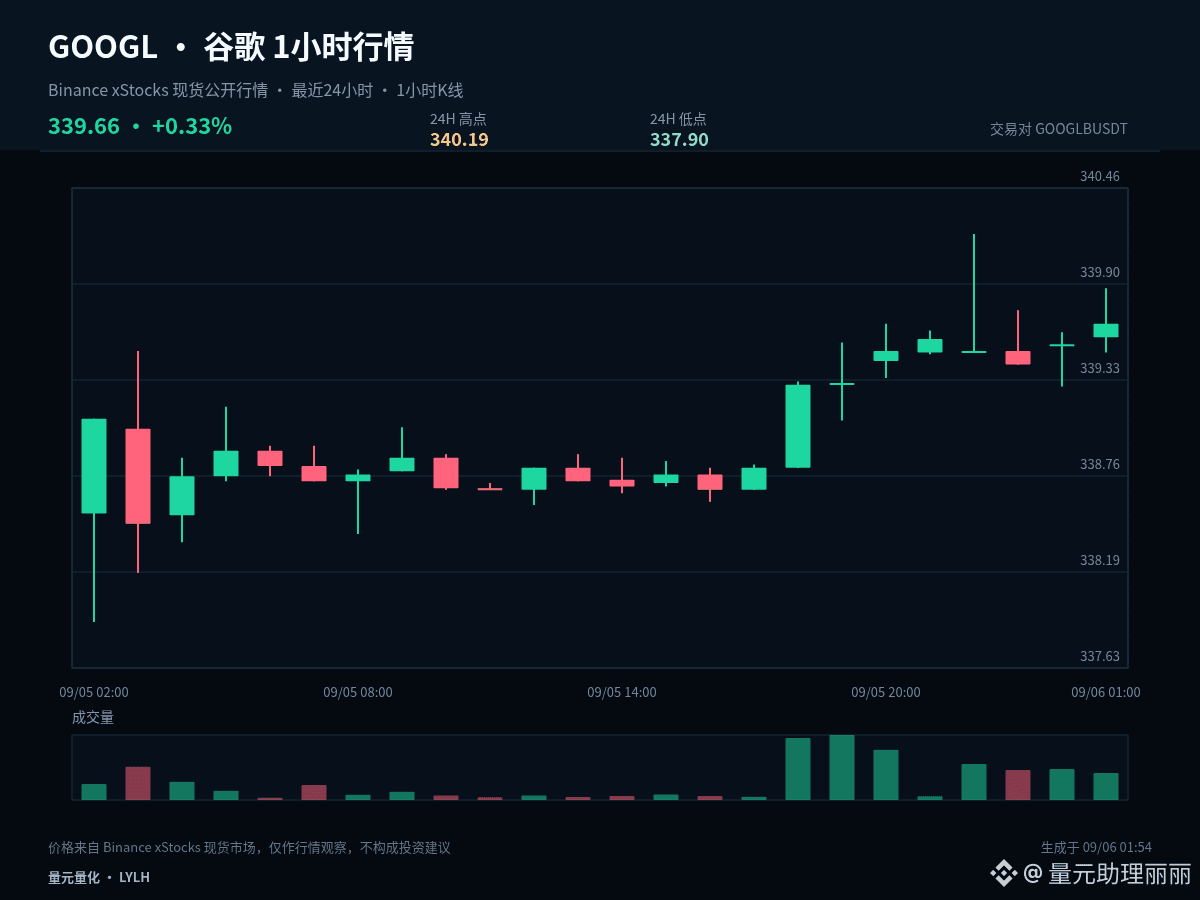
$GOOGLB #GOOGL Whether this trend can continue does not depend on how much it has risen before, but on whether the trend can complete the sequence of “advance, consolidation, and reconfirmation.” The current 1-hour change is +0.02%, and the 24-hour change is +0.30%.
At present, the 1-hour is +0.02% and the 24-hour is +0.30%. The two timeframes have not formed a sufficiently clear same-direction alignment. In a range-bound market, chasing strength or selling weakness has a lower margin for error. It is more suitable to use the upper boundary to confirm direction, the lower boundary to confirm support, and the midline only as a division between strength and weakness.
The first condition for continuation is that 339.045 is not effectively broken to the downside; the second condition is that price can retest and hold above 340.19. If, after advancing, price remains below the midline for a long time, it indicates that active buying has weakened. If it further loses 337.9, then the original continuation assumption needs to be canceled.
In execution, set clear conditions: after breaking above 340.19, confirmation is required rather than chasing an instant surge; after dipping below 337.9, observe whether price can quickly reclaim it rather than blindly buying the dip; in the middle zone, when there is not enough risk-reward, waiting is also part of the strategy.
Position management should distinguish between medium-term and short-term trades. For existing medium-term positions, first assess whether the structure is damaged; do not be repeatedly influenced by a single 1-hour candlestick. Short-term positions should be executed around support, resistance, and closing confirmation. Those with no position do not need to chase prices in the middle of the range; waiting for a clearer location is usually more advantageous.
Risk control still comes before conclusions: act only when the conditions appear, and reassess promptly if price invalidates the setup. The greater the volatility, the more restrained each position should be. The above is a market analysis based on the current 1-hour and 24-hour data and does not constitute a promise of returns.
#BitcoinEthereumHitMultiMonthHighs
At present, the 1-hour is +0.02% and the 24-hour is +0.30%. The two timeframes have not formed a sufficiently clear same-direction alignment. In a range-bound market, chasing strength or selling weakness has a lower margin for error. It is more suitable to use the upper boundary to confirm direction, the lower boundary to confirm support, and the midline only as a division between strength and weakness.
The first condition for continuation is that 339.045 is not effectively broken to the downside; the second condition is that price can retest and hold above 340.19. If, after advancing, price remains below the midline for a long time, it indicates that active buying has weakened. If it further loses 337.9, then the original continuation assumption needs to be canceled.
In execution, set clear conditions: after breaking above 340.19, confirmation is required rather than chasing an instant surge; after dipping below 337.9, observe whether price can quickly reclaim it rather than blindly buying the dip; in the middle zone, when there is not enough risk-reward, waiting is also part of the strategy.
Position management should distinguish between medium-term and short-term trades. For existing medium-term positions, first assess whether the structure is damaged; do not be repeatedly influenced by a single 1-hour candlestick. Short-term positions should be executed around support, resistance, and closing confirmation. Those with no position do not need to chase prices in the middle of the range; waiting for a clearer location is usually more advantageous.
Risk control still comes before conclusions: act only when the conditions appear, and reassess promptly if price invalidates the setup. The greater the volatility, the more restrained each position should be. The above is a market analysis based on the current 1-hour and 24-hour data and does not constitute a promise of returns.
#BitcoinEthereumHitMultiMonthHighs
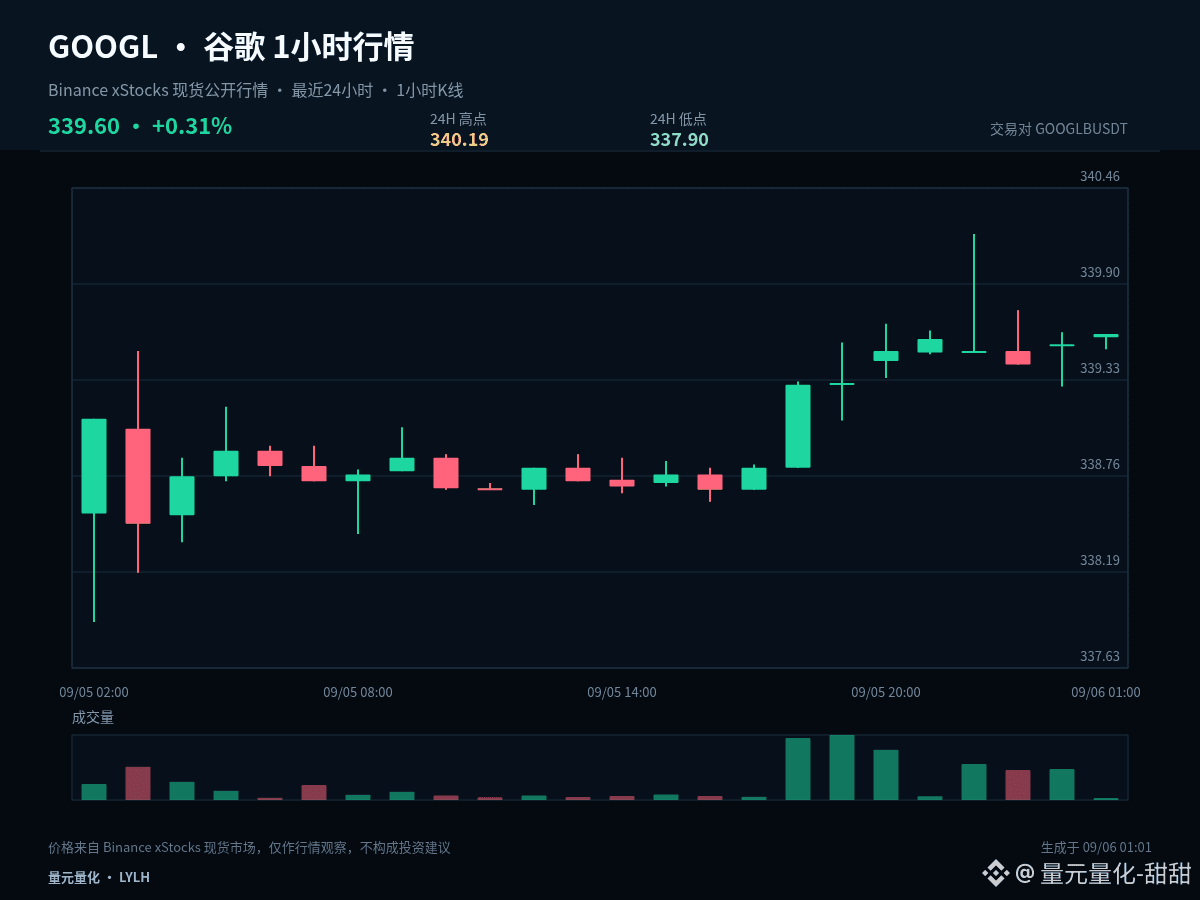

$GOOGL #GOOGL #Contract Trading
Long Alert | GOOGL Key Area Approaching
Large liquidation cluster 345.36
Distance from current price 1.7%
Upper area 345.36
Lower area 333.82
Current price 339.49
Trigger level 345.36
Invalidation level 337.55
Watch levels 345.36 / 342.65
Funding rate +0.0000% (longs and shorts balanced)
Market clues: upper 50x short trigger zone / distance from current price 1.7% / 15m volume 4.7x / RSI15=68.3
Approaching a large liquidation cluster, you can wait for confirmation at the trigger level before entering long; the invalidation level is the stop-loss level.
Long Alert | GOOGL Key Area Approaching
Large liquidation cluster 345.36
Distance from current price 1.7%
Upper area 345.36
Lower area 333.82
Current price 339.49
Trigger level 345.36
Invalidation level 337.55
Watch levels 345.36 / 342.65
Funding rate +0.0000% (longs and shorts balanced)
Market clues: upper 50x short trigger zone / distance from current price 1.7% / 15m volume 4.7x / RSI15=68.3
Approaching a large liquidation cluster, you can wait for confirmation at the trigger level before entering long; the invalidation level is the stop-loss level.

$GOOGL #GOOGL #Contract Trading
Short Alert | GOOGL Funding Rate Change
Current funding rate +0.0000% (longs and shorts balanced)
Previous funding rate -0.0641% (shorts pay longs)
Funding rate change +0.0641%
Long funding continues to increase, and longs are building positions
Market makers may hunt longs
Current price 343.78
Trigger level 341.08
Invalidation level 344.90
Watch levels 323.15 / 302.53
Market clues: Current funding rate +0.0000% (longs and shorts balanced) / Previous funding rate -0.0641% (shorts pay longs) / Funding rate change +0.0641% / Long funding continues to increase, and longs are building positions / Market makers may hunt longs
Continuous changes in funding rate indicate that positions are leaning to one side, allowing you to pre-position for a short trade. The invalidation level is the stop-loss level.
Short Alert | GOOGL Funding Rate Change
Current funding rate +0.0000% (longs and shorts balanced)
Previous funding rate -0.0641% (shorts pay longs)
Funding rate change +0.0641%
Long funding continues to increase, and longs are building positions
Market makers may hunt longs
Current price 343.78
Trigger level 341.08
Invalidation level 344.90
Watch levels 323.15 / 302.53
Market clues: Current funding rate +0.0000% (longs and shorts balanced) / Previous funding rate -0.0641% (shorts pay longs) / Funding rate change +0.0641% / Long funding continues to increase, and longs are building positions / Market makers may hunt longs
Continuous changes in funding rate indicate that positions are leaning to one side, allowing you to pre-position for a short trade. The invalidation level is the stop-loss level.
BERKSHIRE WHALE CAPITAL LOCKS INTO JAPAN AND AI INFRASTRUCTURE DEMAND $GOOGL 🦈 💥
Institutional heavyweights are positioning for the decade, absorbing Japanese trading giants while doubling down on $GOOGL as artificial intelligence scales. 📊 The real high-conviction narrative isn't just software—it's the massive power bottleneck throttling AI data center expansion worldwide.
While retail consumers feel the macro squeeze, smart money sees foundational strength and aligns capital with critical energy grids. 💡 Smart capital isn't chasing short-term noise; it's securing real-world bottlenecks before the next liquidity expansion. 💬 Are you front-running this AI infrastructure wave early, or waiting for retail to catch up? 👇
⚠️ Not financial advice. Always manage your risk. 🛡️
🏷️ #GOOGL #Macro #AI #SmartMoney #Markets
🔥 💎
Institutional heavyweights are positioning for the decade, absorbing Japanese trading giants while doubling down on $GOOGL as artificial intelligence scales. 📊 The real high-conviction narrative isn't just software—it's the massive power bottleneck throttling AI data center expansion worldwide.
While retail consumers feel the macro squeeze, smart money sees foundational strength and aligns capital with critical energy grids. 💡 Smart capital isn't chasing short-term noise; it's securing real-world bottlenecks before the next liquidity expansion. 💬 Are you front-running this AI infrastructure wave early, or waiting for retail to catch up? 👇
⚠️ Not financial advice. Always manage your risk. 🛡️
🏷️ #GOOGL #Macro #AI #SmartMoney #Markets
🔥 💎
Log in to explore more content