
#footprintchart
footprintchart
61 views
2 Discussing
Hot
Latest


📊 BTC FOOTPRINT ANALYSIS: WHAT ARE BUYERS AND SELLERS TELLING US?
Let’s break down this BTCUSDT 15-minute footprint chart and understand what’s happening behind the candles.
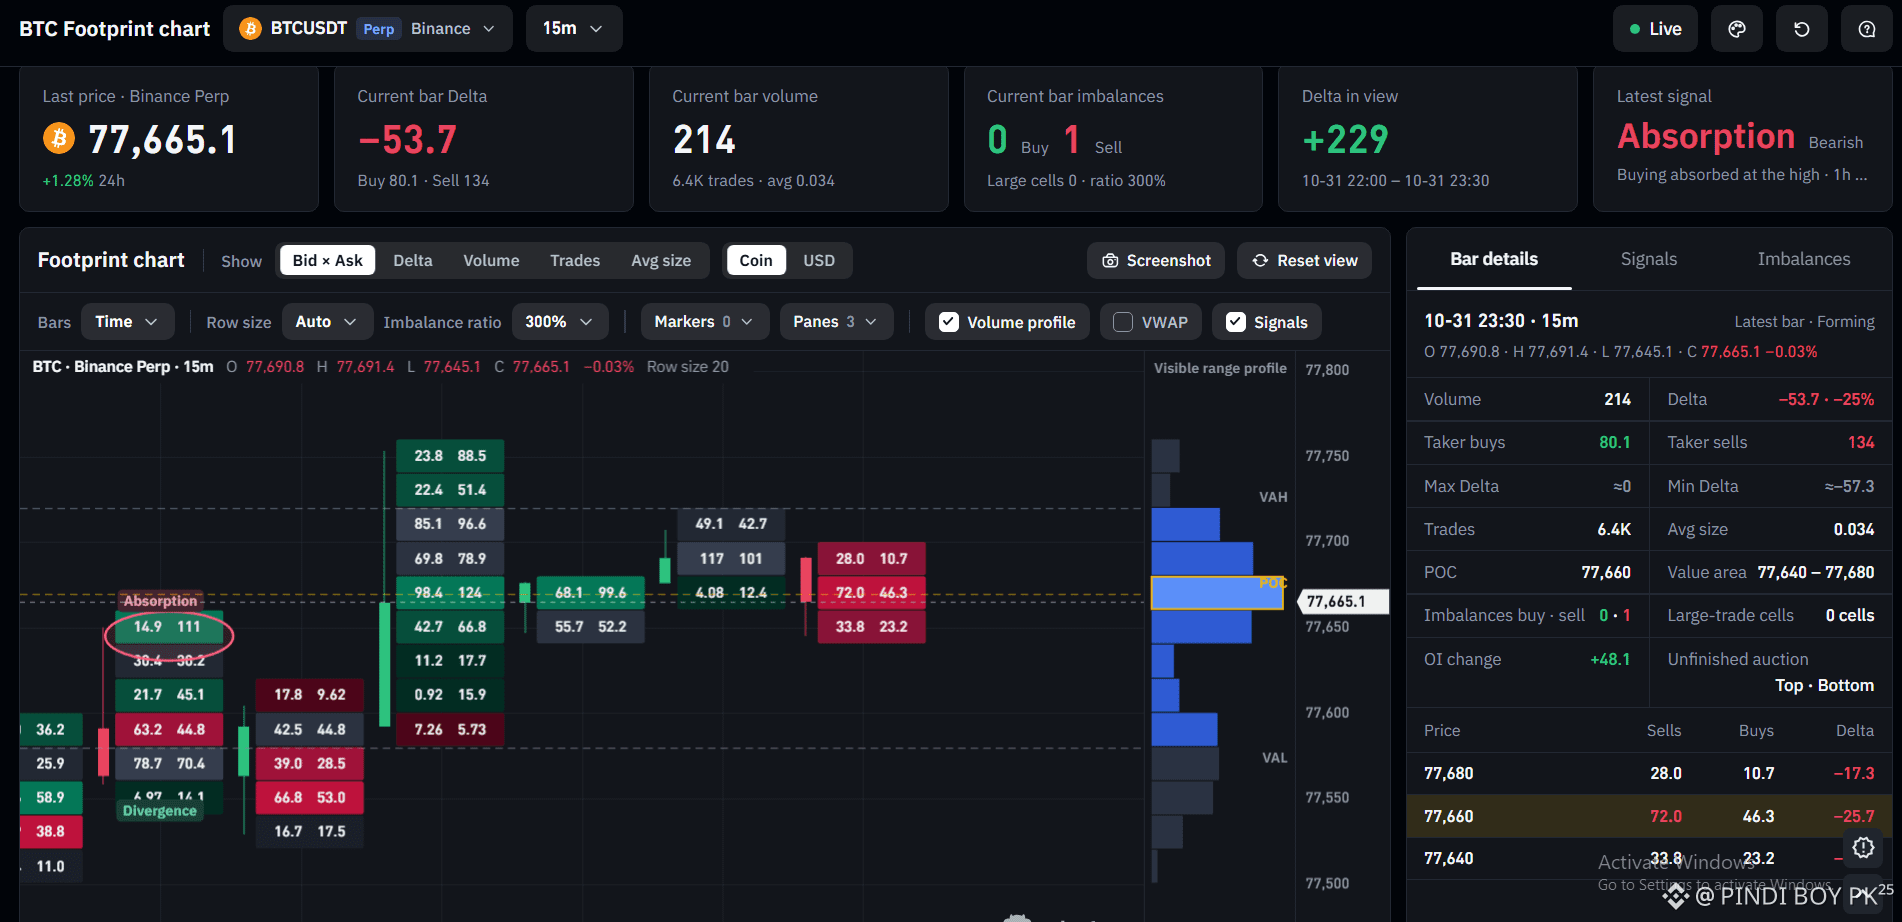
Bitcoin is trading around $77,665 in this snapshot. The current bar shows a negative delta of -53.7, with taker sells at 134 versus taker buys at 80.1. This indicates stronger aggressive selling during the candle, but it doesn't automatically confirm a bearish reversal.
🔍 Here’s What I’m Watching:
🟢 Footprint Numbers: These show buying and selling activity at individual price levels, helping traders identify where aggressive orders are entering.
🔴 Delta: The difference between buying and selling volume. Negative delta suggests sellers are more aggressive, while positive delta indicates stronger buying pressure.
📍 POC at $77,660: This is the price level with the highest traded volume in the displayed bar. The value area is marked between $77,640 and $77,680.
⚠️ Absorption Signal: The chart flags bearish absorption, suggesting buying pressure may be getting absorbed by sellers near a higher price area. Confirmation from subsequent candles is still essential.
My takeaway: I’d watch whether BTC holds the $77,640–$77,660 area or breaks below it. Order flow provides clues, not guarantees. Always manage risk and wait for price confirmation.
#bitcoin #BTC #FootprintChart #cryptotrading #TechnicalAnalysis
$BTC
$LSK
$COW
{spot}(COWUSDT)
📊 BTC FOOTPRINT ANALYSIS: WHAT ARE BUYERS AND SELLERS TELLING US?
Let’s break down this BTCUSDT 15-minute footprint chart and understand what’s happening behind the candles.
Bitcoin is trading around $77,665 in this snapshot. The current bar shows a negative delta of -53.7, with taker sells at 134 versus taker buys at 80.1. This indicates stronger aggressive selling during the candle, but it doesn't automatically confirm a bearish reversal.
🔍 Here’s What I’m Watching:
🟢 Footprint Numbers: These show buying and selling activity at individual price levels, helping traders identify where aggressive orders are entering.
🔴 Delta: The difference between buying and selling volume. Negative delta suggests sellers are more aggressive, while positive delta indicates stronger buying pressure.
📍 POC at $77,660: This is the price level with the highest traded volume in the displayed bar. The value area is marked between $77,640 and $77,680.
⚠️ Absorption Signal: The chart flags bearish absorption, suggesting buying pressure may be getting absorbed by sellers near a higher price area. Confirmation from subsequent candles is still essential.
My takeaway: I’d watch whether BTC holds the $77,640–$77,660 area or breaks below it. Order flow provides clues, not guarantees. Always manage risk and wait for price confirmation.
#bitcoin #BTC #FootprintChart #cryptotrading #TechnicalAnalysis
$BTC
$LSK
$COW
Let’s break down this BTCUSDT 15-minute footprint chart and understand what’s happening behind the candles.
Bitcoin is trading around $77,665 in this snapshot. The current bar shows a negative delta of -53.7, with taker sells at 134 versus taker buys at 80.1. This indicates stronger aggressive selling during the candle, but it doesn't automatically confirm a bearish reversal.
🔍 Here’s What I’m Watching:
🟢 Footprint Numbers: These show buying and selling activity at individual price levels, helping traders identify where aggressive orders are entering.
🔴 Delta: The difference between buying and selling volume. Negative delta suggests sellers are more aggressive, while positive delta indicates stronger buying pressure.
📍 POC at $77,660: This is the price level with the highest traded volume in the displayed bar. The value area is marked between $77,640 and $77,680.
⚠️ Absorption Signal: The chart flags bearish absorption, suggesting buying pressure may be getting absorbed by sellers near a higher price area. Confirmation from subsequent candles is still essential.
My takeaway: I’d watch whether BTC holds the $77,640–$77,660 area or breaks below it. Order flow provides clues, not guarantees. Always manage risk and wait for price confirmation.
#bitcoin #BTC #FootprintChart #cryptotrading #TechnicalAnalysis
$BTC
$LSK
$COW
1
242
Log in to explore more content
Join global crypto users on Binance Square
⚡️ Get latest and useful information about crypto.
💬 Trusted by the world’s largest crypto exchange.
👍 Discover real insights from verified creators.
Email / Phone number
Trending Topics
1
#BinanceReopensWithdrawalsForMoreAssets
577 views
70 Discussing
2
#AppleReportsMixedResults
1,771 views
113 Discussing
3
#BinanceWithdrawalScamWarning
73,632 views
913 Discussing
4
#USMidtermElections
655,491 views
3,476 Discussing
5
#USOctoberNFP-AreRateCutsStillPossible
78,136 views
703 Discussing
6
#Verify1to1BinanceReserves
66,634 views
530 Discussing
7
#BinanceRestores28FiatWithdrawals
203,891 views
1,189 Discussing
8
#BitMineAdds8573ETHTotalHoldingsReach6.06M
47 views
6 Discussing
9
#HKSFCEyesTokenizedGoldETFPilot
47 views
8 Discussing
10
#SouthKoreaRulingPartyToRecommendDelayingVirtualAssetTax
0 views
0 Discussing