
#csopskhynix2l
csopskhynix2l
17,153 views
361 Discussing
Hot
Latest

·
--
Bullish
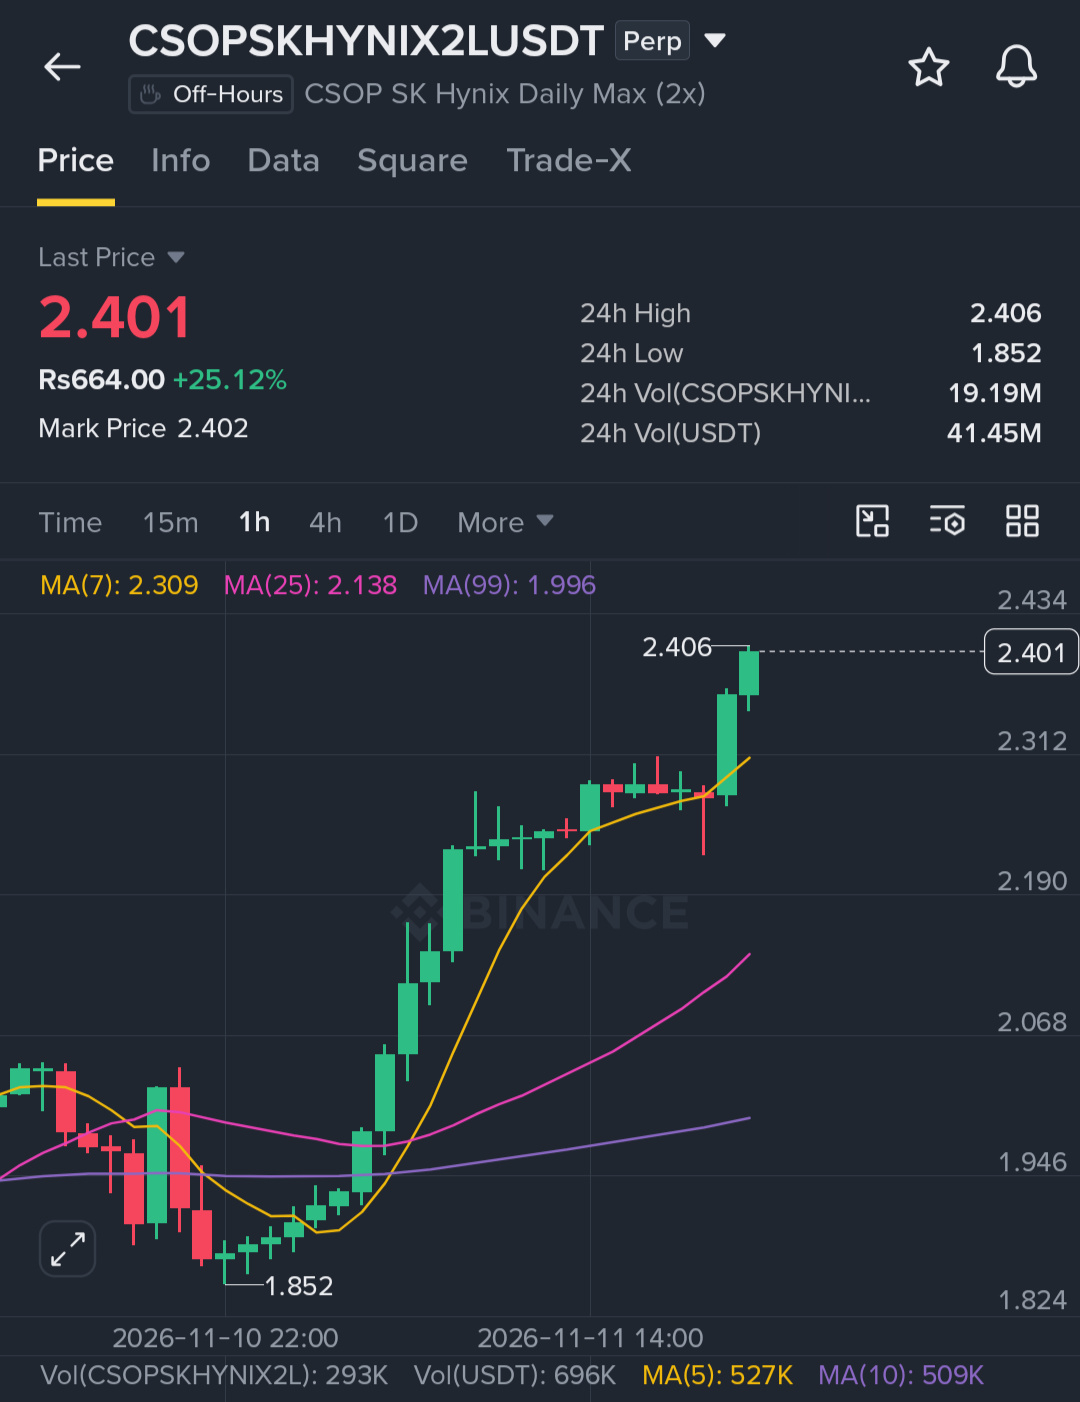
$CSOPSKHYNIX2L is holding firm and buyers are stepping in, so the structure favors a push toward higher targets. 🔥
Trade Setup (Long):
🟢 Entry Zone: 2.355 – 2.377
🎯 Targets: 2.425 / 2.485
⛔ Stop Loss: 2.285
Price is holding bullish strength. Enter on pullbacks and manage risk appropriately.
Click here to buy now 👉 $CSOPSKHYNIX2L
{future}(CSOPSKHYNIX2LUSDT)
#CSOPSKHYNIX2L #AnthropicRejectsIPODelayValuationinQuestion
$CSOPSKHYNIX2L is holding firm and buyers are stepping in, so the structure favors a push toward higher targets. 🔥
Trade Setup (Long):
🟢 Entry Zone: 2.355 – 2.377
🎯 Targets: 2.425 / 2.485
⛔ Stop Loss: 2.285
Price is holding bullish strength. Enter on pullbacks and manage risk appropriately.
Click here to buy now 👉 $CSOPSKHYNIX2L
#CSOPSKHYNIX2L #AnthropicRejectsIPODelayValuationinQuestion
Trade Setup (Long):
🟢 Entry Zone: 2.355 – 2.377
🎯 Targets: 2.425 / 2.485
⛔ Stop Loss: 2.285
Price is holding bullish strength. Enter on pullbacks and manage risk appropriately.
Click here to buy now 👉 $CSOPSKHYNIX2L
#CSOPSKHYNIX2L #AnthropicRejectsIPODelayValuationinQuestion
2
33

·
--
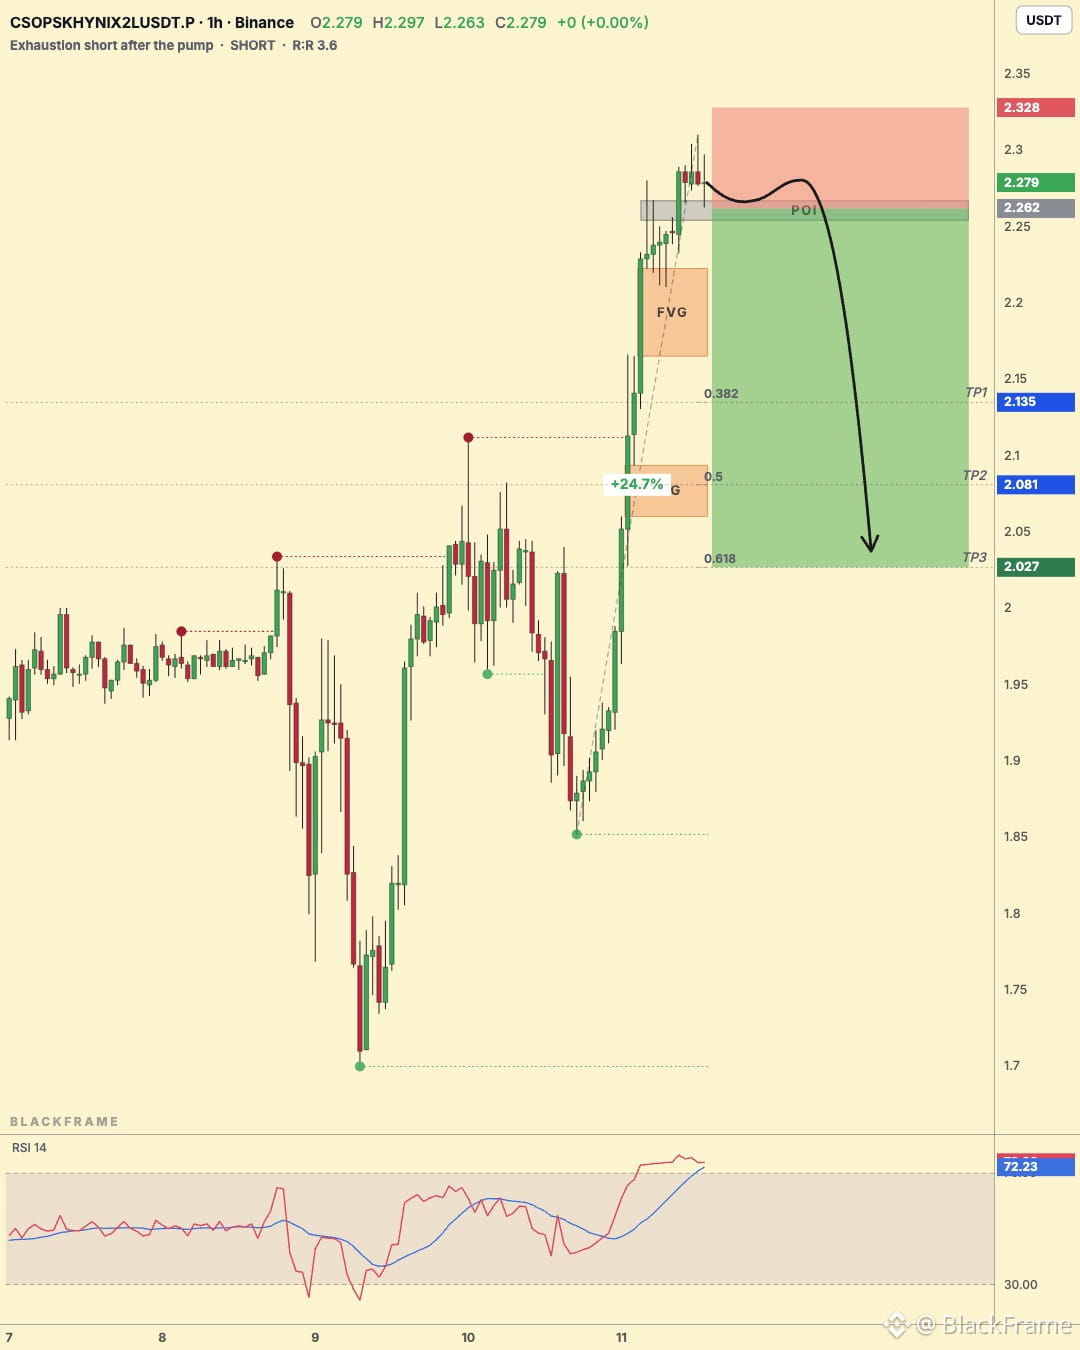
🚨 $CSOPSKHYNIX2L ran +24.7% and is running out of fuel
SHORT · 1H
Entry: $2.254 - $2.267
TP1: $2.135
TP2: $2.081
TP3: $2.027
SL: $2.328
$CSOPSKHYNIX2L pumped +24.7% in the last 24 hours. RSI is overheated on the 1H, a bearish divergence printed on the 15M and the 15M structure just flipped down. Entry is on the first 15M weakness, targets are the 0.382, 0.5 and 0.618 retracements of the pump.
#CSOPSKHYNIX2L #TradingSignals · NFA
🚨 $CSOPSKHYNIX2L ran +24.7% and is running out of fuel
SHORT · 1H
Entry: $2.254 - $2.267
TP1: $2.135
TP2: $2.081
TP3: $2.027
SL: $2.328
$CSOPSKHYNIX2L pumped +24.7% in the last 24 hours. RSI is overheated on the 1H, a bearish divergence printed on the 15M and the 15M structure just flipped down. Entry is on the first 15M weakness, targets are the 0.382, 0.5 and 0.618 retracements of the pump.
#CSOPSKHYNIX2L #TradingSignals · NFA
SHORT · 1H
Entry: $2.254 - $2.267
TP1: $2.135
TP2: $2.081
TP3: $2.027
SL: $2.328
$CSOPSKHYNIX2L pumped +24.7% in the last 24 hours. RSI is overheated on the 1H, a bearish divergence printed on the 15M and the 15M structure just flipped down. Entry is on the first 15M weakness, targets are the 0.382, 0.5 and 0.618 retracements of the pump.
#CSOPSKHYNIX2L #TradingSignals · NFA
56
·
--
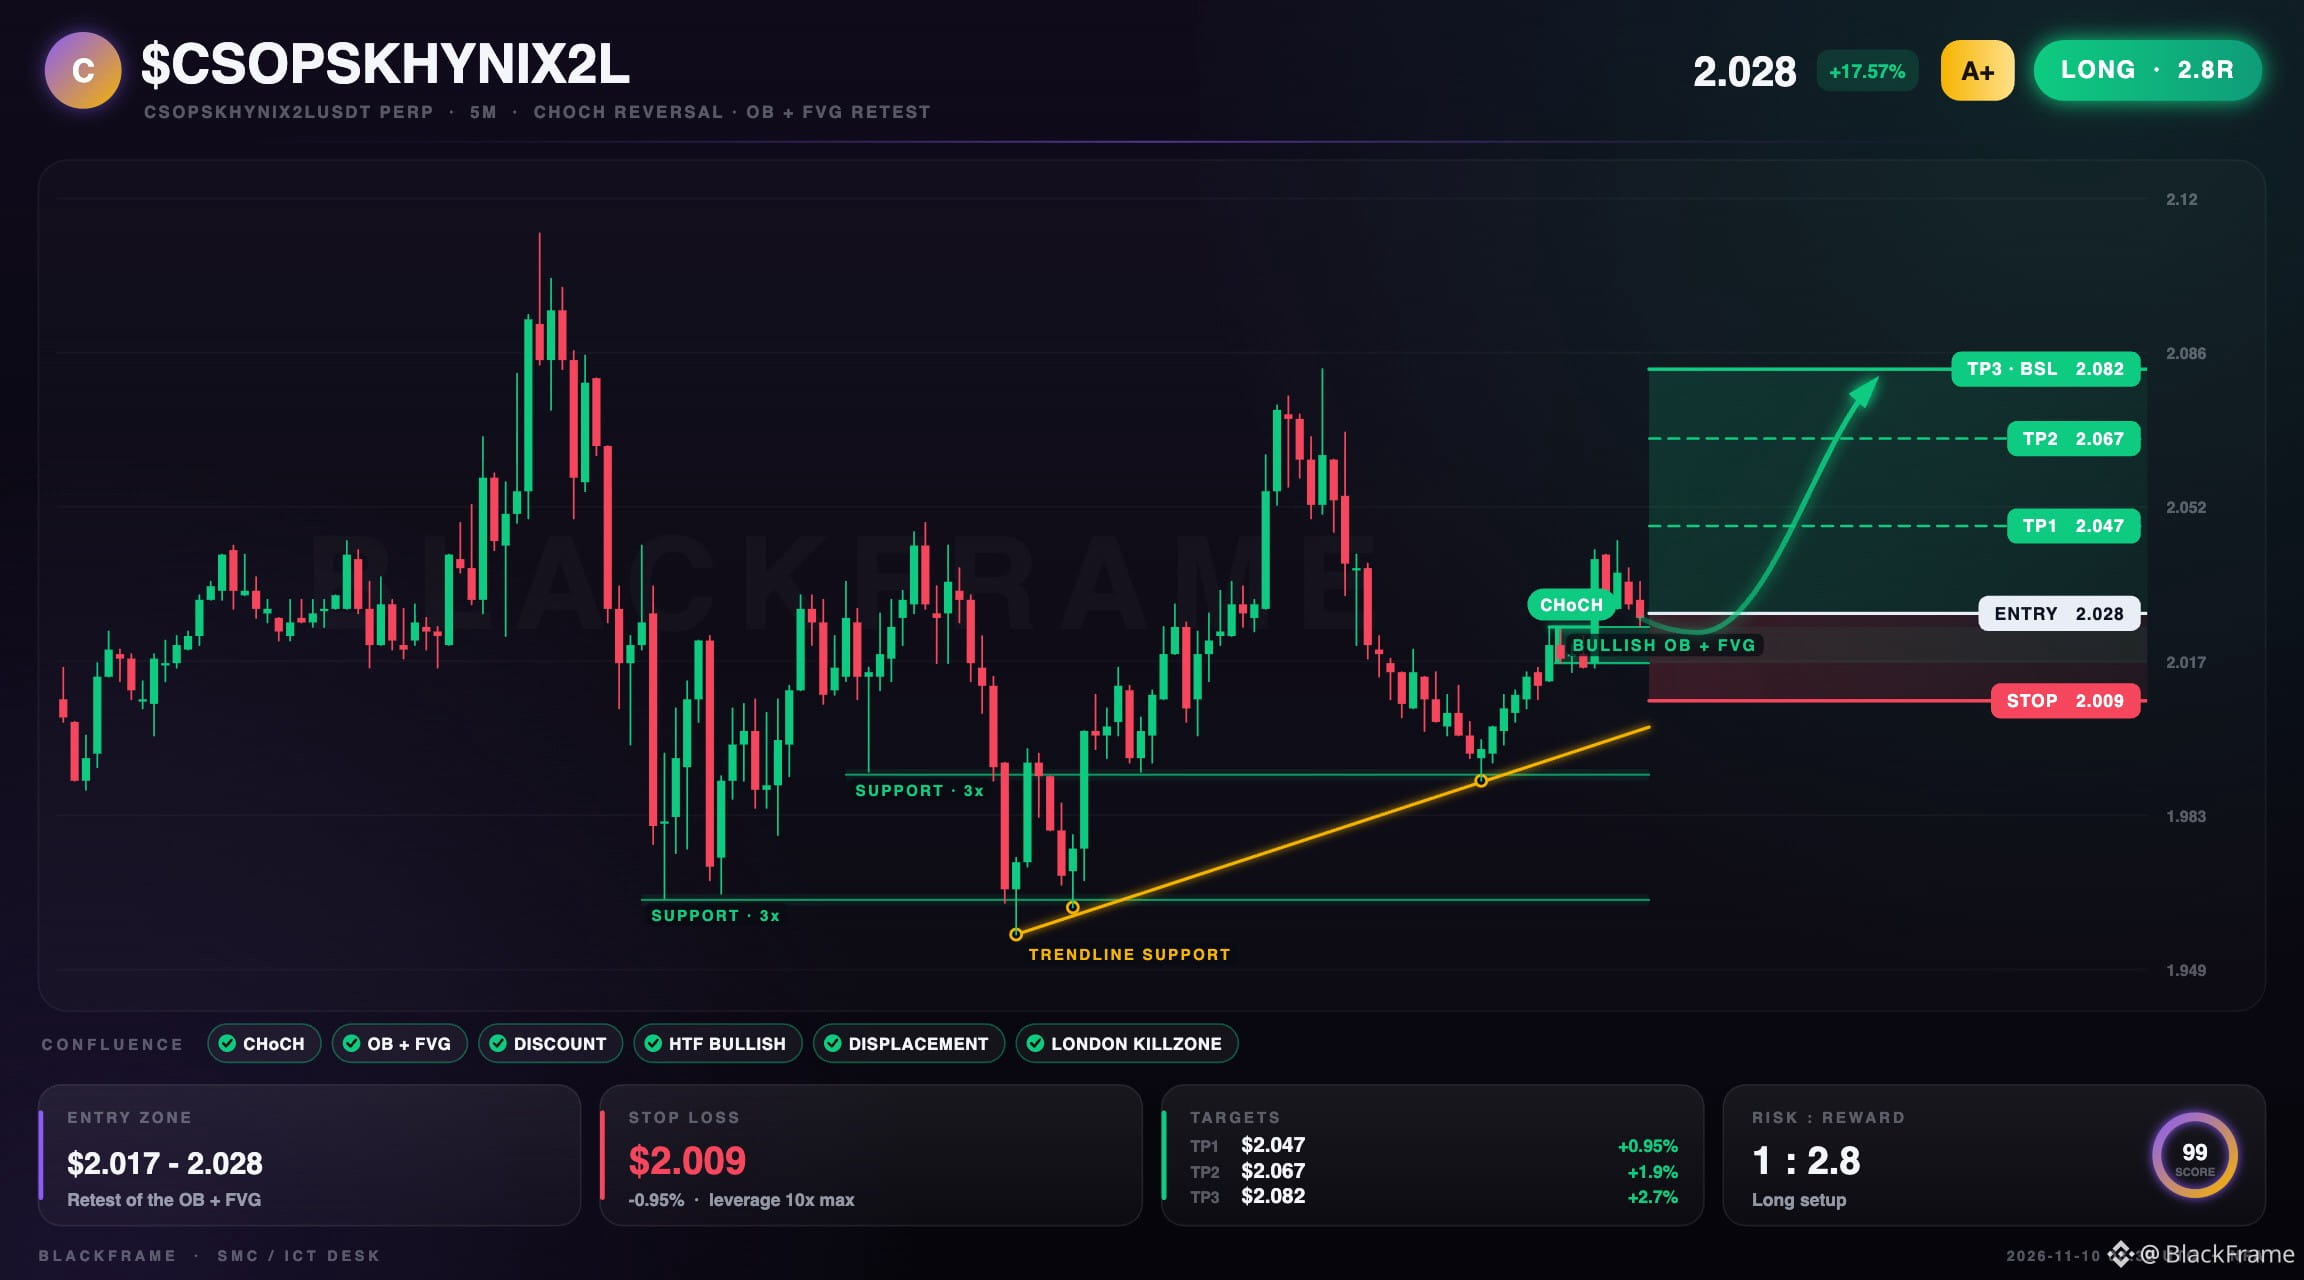
🚀 $CSOPSKHYNIX2L hits bullish CHoCH on 5M
LONG · 5M
Entry: $2.025 - $2.028
TP1: $2.047
TP2: $2.067
TP3: $2.082
SL: $2.009
CHoCH confirmed on 5M aligns with an order block and FVG stacked in the $2.017-2.025 zone, offering buying from discount. London killzone and strong displacement out of the zone add momentum, with higher timeframe bias bullish. Enter at $2.028, stop at $2.009, target buy‑side liquidity at $2.082.
#CSOPSKHYNIX2L #TradingSignals · NFA
🚀 $CSOPSKHYNIX2L hits bullish CHoCH on 5M
LONG · 5M
Entry: $2.025 - $2.028
TP1: $2.047
TP2: $2.067
TP3: $2.082
SL: $2.009
CHoCH confirmed on 5M aligns with an order block and FVG stacked in the $2.017-2.025 zone, offering buying from discount. London killzone and strong displacement out of the zone add momentum, with higher timeframe bias bullish. Enter at $2.028, stop at $2.009, target buy‑side liquidity at $2.082.
#CSOPSKHYNIX2L #TradingSignals · NFA
LONG · 5M
Entry: $2.025 - $2.028
TP1: $2.047
TP2: $2.067
TP3: $2.082
SL: $2.009
CHoCH confirmed on 5M aligns with an order block and FVG stacked in the $2.017-2.025 zone, offering buying from discount. London killzone and strong displacement out of the zone add momentum, with higher timeframe bias bullish. Enter at $2.028, stop at $2.009, target buy‑side liquidity at $2.082.
#CSOPSKHYNIX2L #TradingSignals · NFA
75
·
--
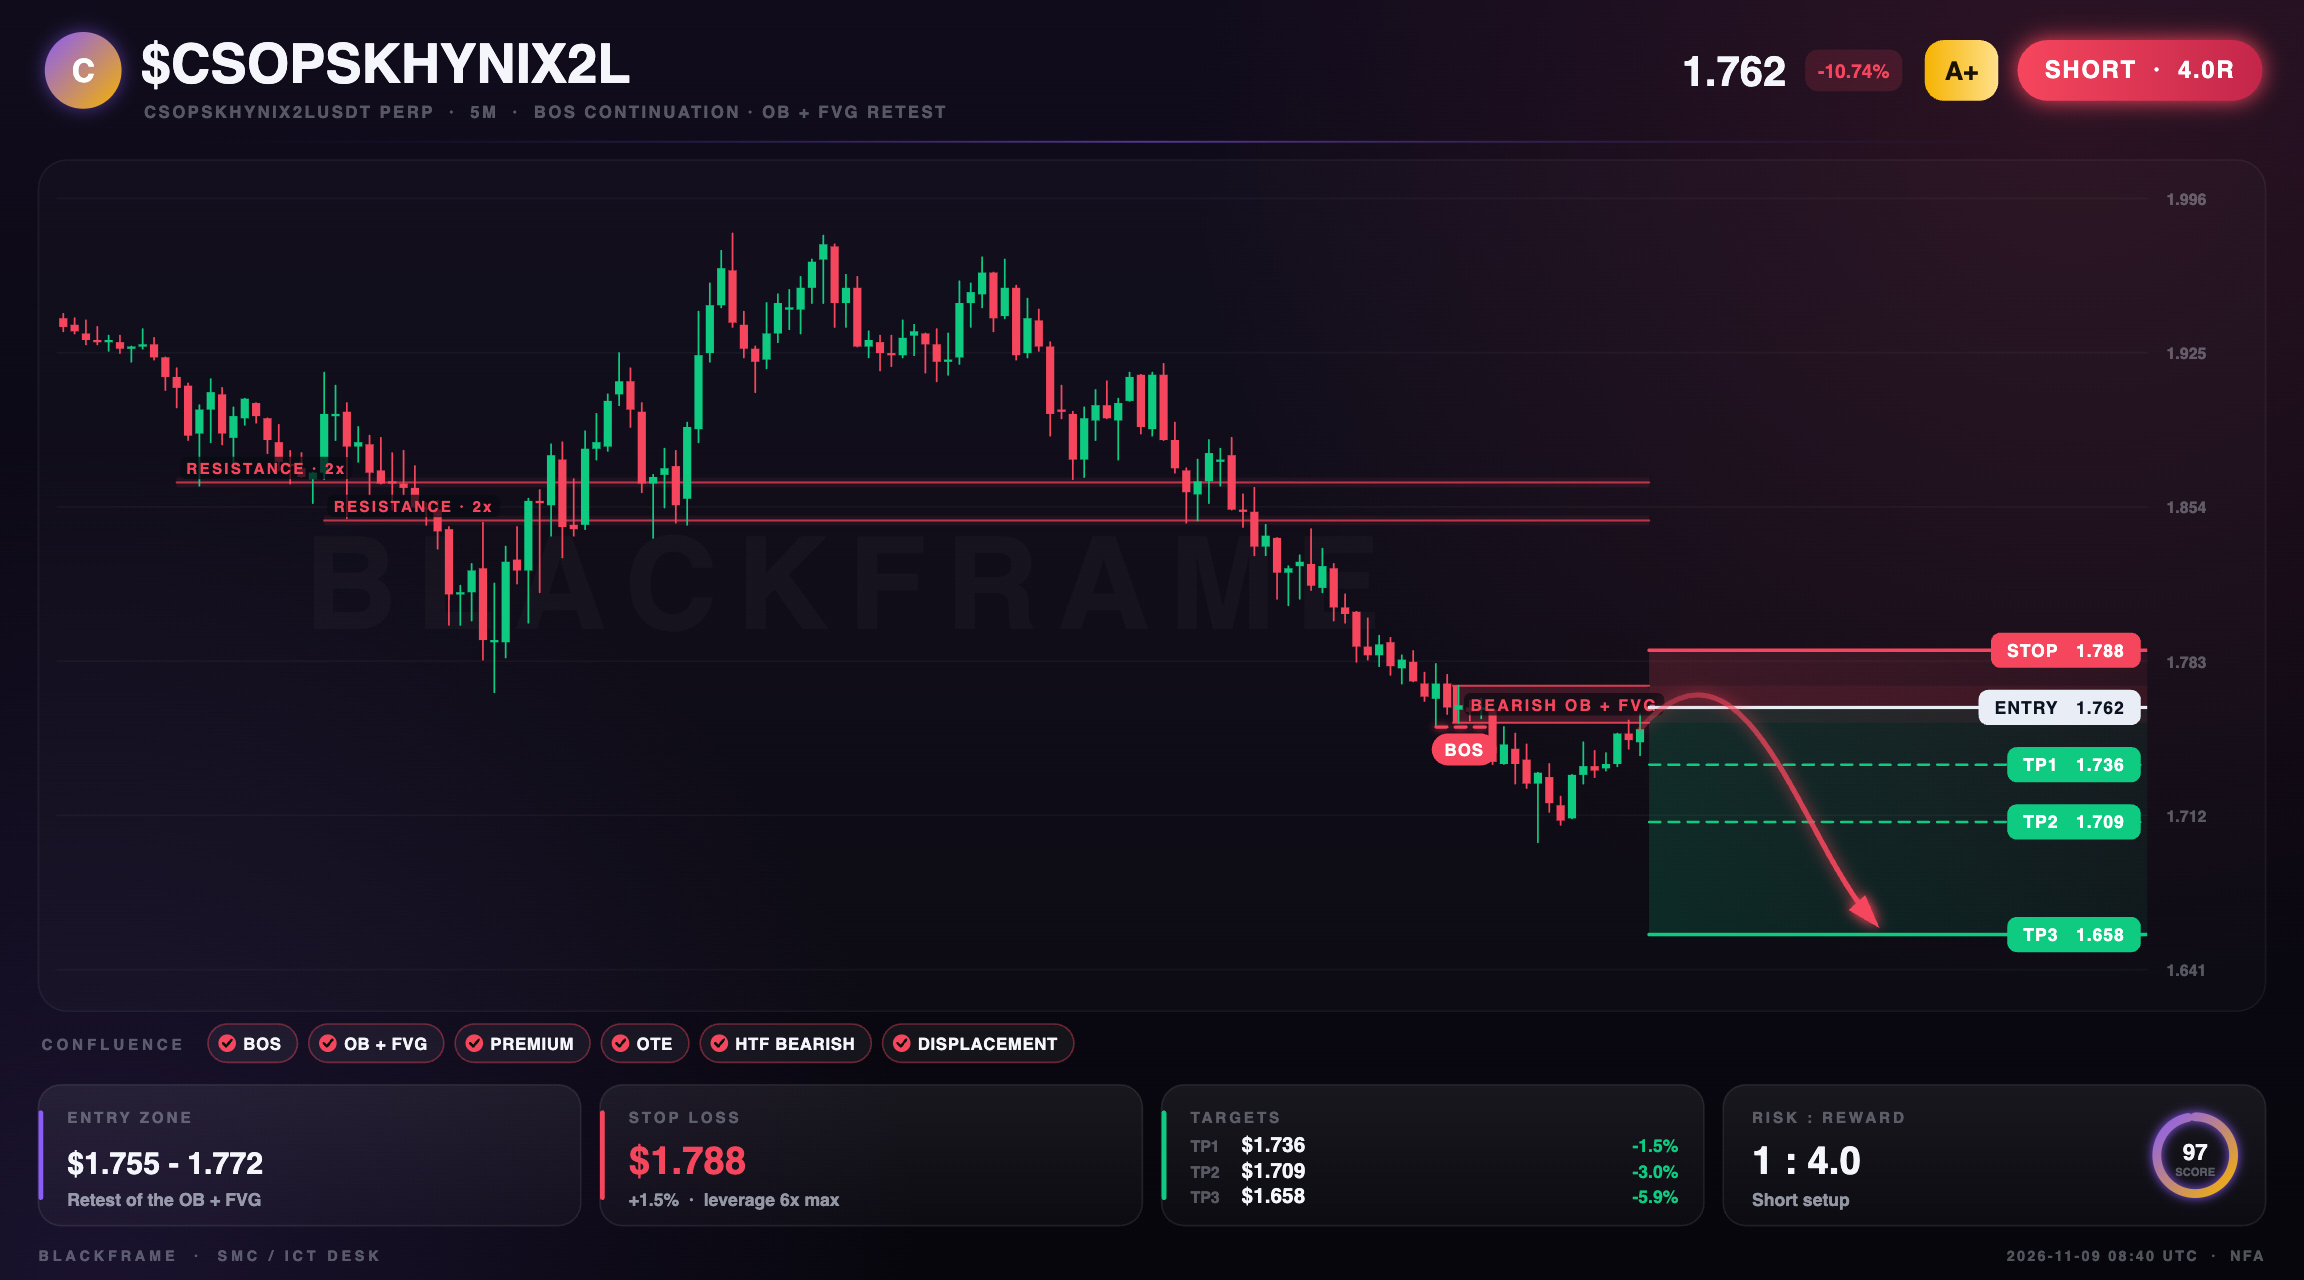
⚡️ $CSOPSKHYNIX2L dives into sell‑side OTE
SHORT · 5M
Entry: $1.755 - $1.762
TP1: $1.736
TP2: $1.709
TP3: $1.658
SL: $1.788
BOS confirms the 5M downtrend and an OB‑FVG stack sits at $1.755-1.772. Price is selling from premium inside the OTE pocket with strong displacement and a London killzone bias. Target is $1.658; stop at $1.788.
#CSOPSKHYNIX2L #PriceAction · NFA
⚡️ $CSOPSKHYNIX2L dives into sell‑side OTE
SHORT · 5M
Entry: $1.755 - $1.762
TP1: $1.736
TP2: $1.709
TP3: $1.658
SL: $1.788
BOS confirms the 5M downtrend and an OB‑FVG stack sits at $1.755-1.772. Price is selling from premium inside the OTE pocket with strong displacement and a London killzone bias. Target is $1.658; stop at $1.788.
#CSOPSKHYNIX2L #PriceAction · NFA
SHORT · 5M
Entry: $1.755 - $1.762
TP1: $1.736
TP2: $1.709
TP3: $1.658
SL: $1.788
BOS confirms the 5M downtrend and an OB‑FVG stack sits at $1.755-1.772. Price is selling from premium inside the OTE pocket with strong displacement and a London killzone bias. Target is $1.658; stop at $1.788.
#CSOPSKHYNIX2L #PriceAction · NFA
82

·
--
Looking at the order book for CSOPSKHYNIX2L, don’t praise how good this candle looks just yet—the next round of turnover will show whether the momentum can hold.
Binance TradFi Perpetuals (traditional financial assets; elevated gap risk outside trading hours) | CSOPSKHYNIX2L is up 14.09% over the past 24 hours, and strength remains. For a continuation, watch for a pullback first. Current price is around 2.259, with 24-hour turnover of around 36.6769 million; the 30m volume ratio is 2.4x, indicating rising participation. Funding picture: 72% of accounts are long; the taker buy/sell ratio is 0.94 (aggressive buying and selling are nearly balanced); 30m open interest is up 1.2%; funding rate is +0.0891%.
Reference indicators: The 30m RSI at 98.21 is overheated, suggesting that enthusiasm for chasing the price is running high. The 30m ATR trend-band reference level is 2.04004; the current price is above it, suggesting the structure favors trend continuation.
The order book needs to provide two answers: Can the taker buy/sell ratio of 0.94 move out of the equilibrium zone around 1, and can the 30m RSI at 98.2 first fall back below 70? If both hold, this move is worth discussing further; if only one does, treat it as sentiment-driven volatility.
#CSOPSKHYNIX2L #UnusualMoveAlert
Looking at the order book for CSOPSKHYNIX2L, don’t praise how good this candle looks just yet—the next round of turnover will show whether the momentum can hold.
Binance TradFi Perpetuals (traditional financial assets; elevated gap risk outside trading hours) | CSOPSKHYNIX2L is up 14.09% over the past 24 hours, and strength remains. For a continuation, watch for a pullback first. Current price is around 2.259, with 24-hour turnover of around 36.6769 million; the 30m volume ratio is 2.4x, indicating rising participation. Funding picture: 72% of accounts are long; the taker buy/sell ratio is 0.94 (aggressive buying and selling are nearly balanced); 30m open interest is up 1.2%; funding rate is +0.0891%.
Reference indicators: The 30m RSI at 98.21 is overheated, suggesting that enthusiasm for chasing the price is running high. The 30m ATR trend-band reference level is 2.04004; the current price is above it, suggesting the structure favors trend continuation.
The order book needs to provide two answers: Can the taker buy/sell ratio of 0.94 move out of the equilibrium zone around 1, and can the 30m RSI at 98.2 first fall back below 70? If both hold, this move is worth discussing further; if only one does, treat it as sentiment-driven volatility.
#CSOPSKHYNIX2L #UnusualMoveAlert
Binance TradFi Perpetuals (traditional financial assets; elevated gap risk outside trading hours) | CSOPSKHYNIX2L is up 14.09% over the past 24 hours, and strength remains. For a continuation, watch for a pullback first. Current price is around 2.259, with 24-hour turnover of around 36.6769 million; the 30m volume ratio is 2.4x, indicating rising participation. Funding picture: 72% of accounts are long; the taker buy/sell ratio is 0.94 (aggressive buying and selling are nearly balanced); 30m open interest is up 1.2%; funding rate is +0.0891%.
Reference indicators: The 30m RSI at 98.21 is overheated, suggesting that enthusiasm for chasing the price is running high. The 30m ATR trend-band reference level is 2.04004; the current price is above it, suggesting the structure favors trend continuation.
The order book needs to provide two answers: Can the taker buy/sell ratio of 0.94 move out of the equilibrium zone around 1, and can the 30m RSI at 98.2 first fall back below 70? If both hold, this move is worth discussing further; if only one does, treat it as sentiment-driven volatility.
#CSOPSKHYNIX2L #UnusualMoveAlert
28

·
--
$CSOPSKHYNIX2L 4 Bullish signal on the hourly timeframe 🔥
════════════════════
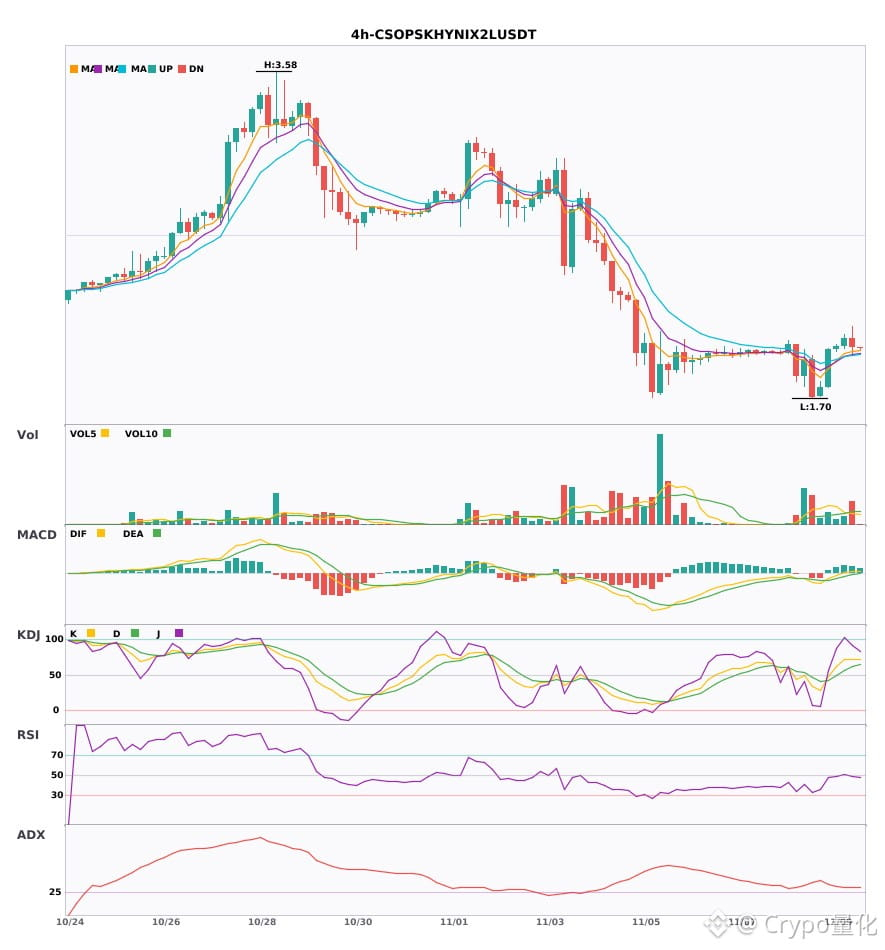
🔴 $CSOPSKHYNIX2L 4-hour bullish signal
⚠️Technical analysis: ADX (32) indicates a clear trending market | MACD is bullish, with a strong trend but weakening momentum | EMA5 > EMA8 > EMA13 bullish alignment | KDJ is strong, with bulls in control (K: 71.8, D: 61.8) | Volume increased (1.8x)
════════════════════
🔔 Follow us for first-hand market updates 🔔
#技术分析 #CSOPSKHYNIX2L
📌 When trading, pay attention to whether the candlestick pattern confirms the setup
$CSOPSKHYNIX2L 4 Bullish signal on the hourly timeframe 🔥
════════════════════
🔴 $CSOPSKHYNIX2L 4-hour bullish signal
⚠️Technical analysis: ADX (32) indicates a clear trending market | MACD is bullish, with a strong trend but weakening momentum | EMA5 > EMA8 > EMA13 bullish alignment | KDJ is strong, with bulls in control (K: 71.8, D: 61.8) | Volume increased (1.8x)
════════════════════
🔔 Follow us for first-hand market updates 🔔
#技术分析 #CSOPSKHYNIX2L
📌 When trading, pay attention to whether the candlestick pattern confirms the setup
════════════════════
🔴 $CSOPSKHYNIX2L 4-hour bullish signal
⚠️Technical analysis: ADX (32) indicates a clear trending market | MACD is bullish, with a strong trend but weakening momentum | EMA5 > EMA8 > EMA13 bullish alignment | KDJ is strong, with bulls in control (K: 71.8, D: 61.8) | Volume increased (1.8x)
════════════════════
🔔 Follow us for first-hand market updates 🔔
#技术分析 #CSOPSKHYNIX2L
📌 When trading, pay attention to whether the candlestick pattern confirms the setup
1
·
--
CSOPSKHYNIX2L fell 10.23% in 24h, while long accounts still make up 80% and the funding rate remains at +0.2398%.
Binance TradFi perpetuals (traditional finance category, high gap risk outside trading hours) | CSOPSKHYNIX2L remains weak intraday; first, watch whether selling pressure eases. Current price is around 1.763, with 24h trading volume of about 33.3534 million; the 30m volume ratio is only 0.5x, indicating weak participation. Funding data: long accounts make up 80%; taker buy/sell ratio is 0.91 (taker trades are close to balanced); 30m open interest is +1.3%; funding rate is +0.2398%.
Reference indicators: the 30m ATR trend band reference level is 1.89641. The current price is below it, indicating a weak structure; watch whether it can reclaim this level. The 30m KDJ is 12.4/18.33/0.55, suggesting short-term panic/oversold conditions. The J value is low; the key thing to watch next is whether any rebound gets a second confirmation.
Which would you wait for first: whether the taker buy/sell ratio of 0.91 can move out of the balanced zone around 1, or whether the current price can reclaim the ATR trend band reference level of 1.89641?
#CSOPSKHYNIX2L #Unusual Movement Alert
CSOPSKHYNIX2L fell 10.23% in 24h, while long accounts still make up 80% and the funding rate remains at +0.2398%.
Binance TradFi perpetuals (traditional finance category, high gap risk outside trading hours) | CSOPSKHYNIX2L remains weak intraday; first, watch whether selling pressure eases. Current price is around 1.763, with 24h trading volume of about 33.3534 million; the 30m volume ratio is only 0.5x, indicating weak participation. Funding data: long accounts make up 80%; taker buy/sell ratio is 0.91 (taker trades are close to balanced); 30m open interest is +1.3%; funding rate is +0.2398%.
Reference indicators: the 30m ATR trend band reference level is 1.89641. The current price is below it, indicating a weak structure; watch whether it can reclaim this level. The 30m KDJ is 12.4/18.33/0.55, suggesting short-term panic/oversold conditions. The J value is low; the key thing to watch next is whether any rebound gets a second confirmation.
Which would you wait for first: whether the taker buy/sell ratio of 0.91 can move out of the balanced zone around 1, or whether the current price can reclaim the ATR trend band reference level of 1.89641?
#CSOPSKHYNIX2L #Unusual Movement Alert
Binance TradFi perpetuals (traditional finance category, high gap risk outside trading hours) | CSOPSKHYNIX2L remains weak intraday; first, watch whether selling pressure eases. Current price is around 1.763, with 24h trading volume of about 33.3534 million; the 30m volume ratio is only 0.5x, indicating weak participation. Funding data: long accounts make up 80%; taker buy/sell ratio is 0.91 (taker trades are close to balanced); 30m open interest is +1.3%; funding rate is +0.2398%.
Reference indicators: the 30m ATR trend band reference level is 1.89641. The current price is below it, indicating a weak structure; watch whether it can reclaim this level. The 30m KDJ is 12.4/18.33/0.55, suggesting short-term panic/oversold conditions. The J value is low; the key thing to watch next is whether any rebound gets a second confirmation.
Which would you wait for first: whether the taker buy/sell ratio of 0.91 can move out of the balanced zone around 1, or whether the current price can reclaim the ATR trend band reference level of 1.89641?
#CSOPSKHYNIX2L #Unusual Movement Alert
2
·
--
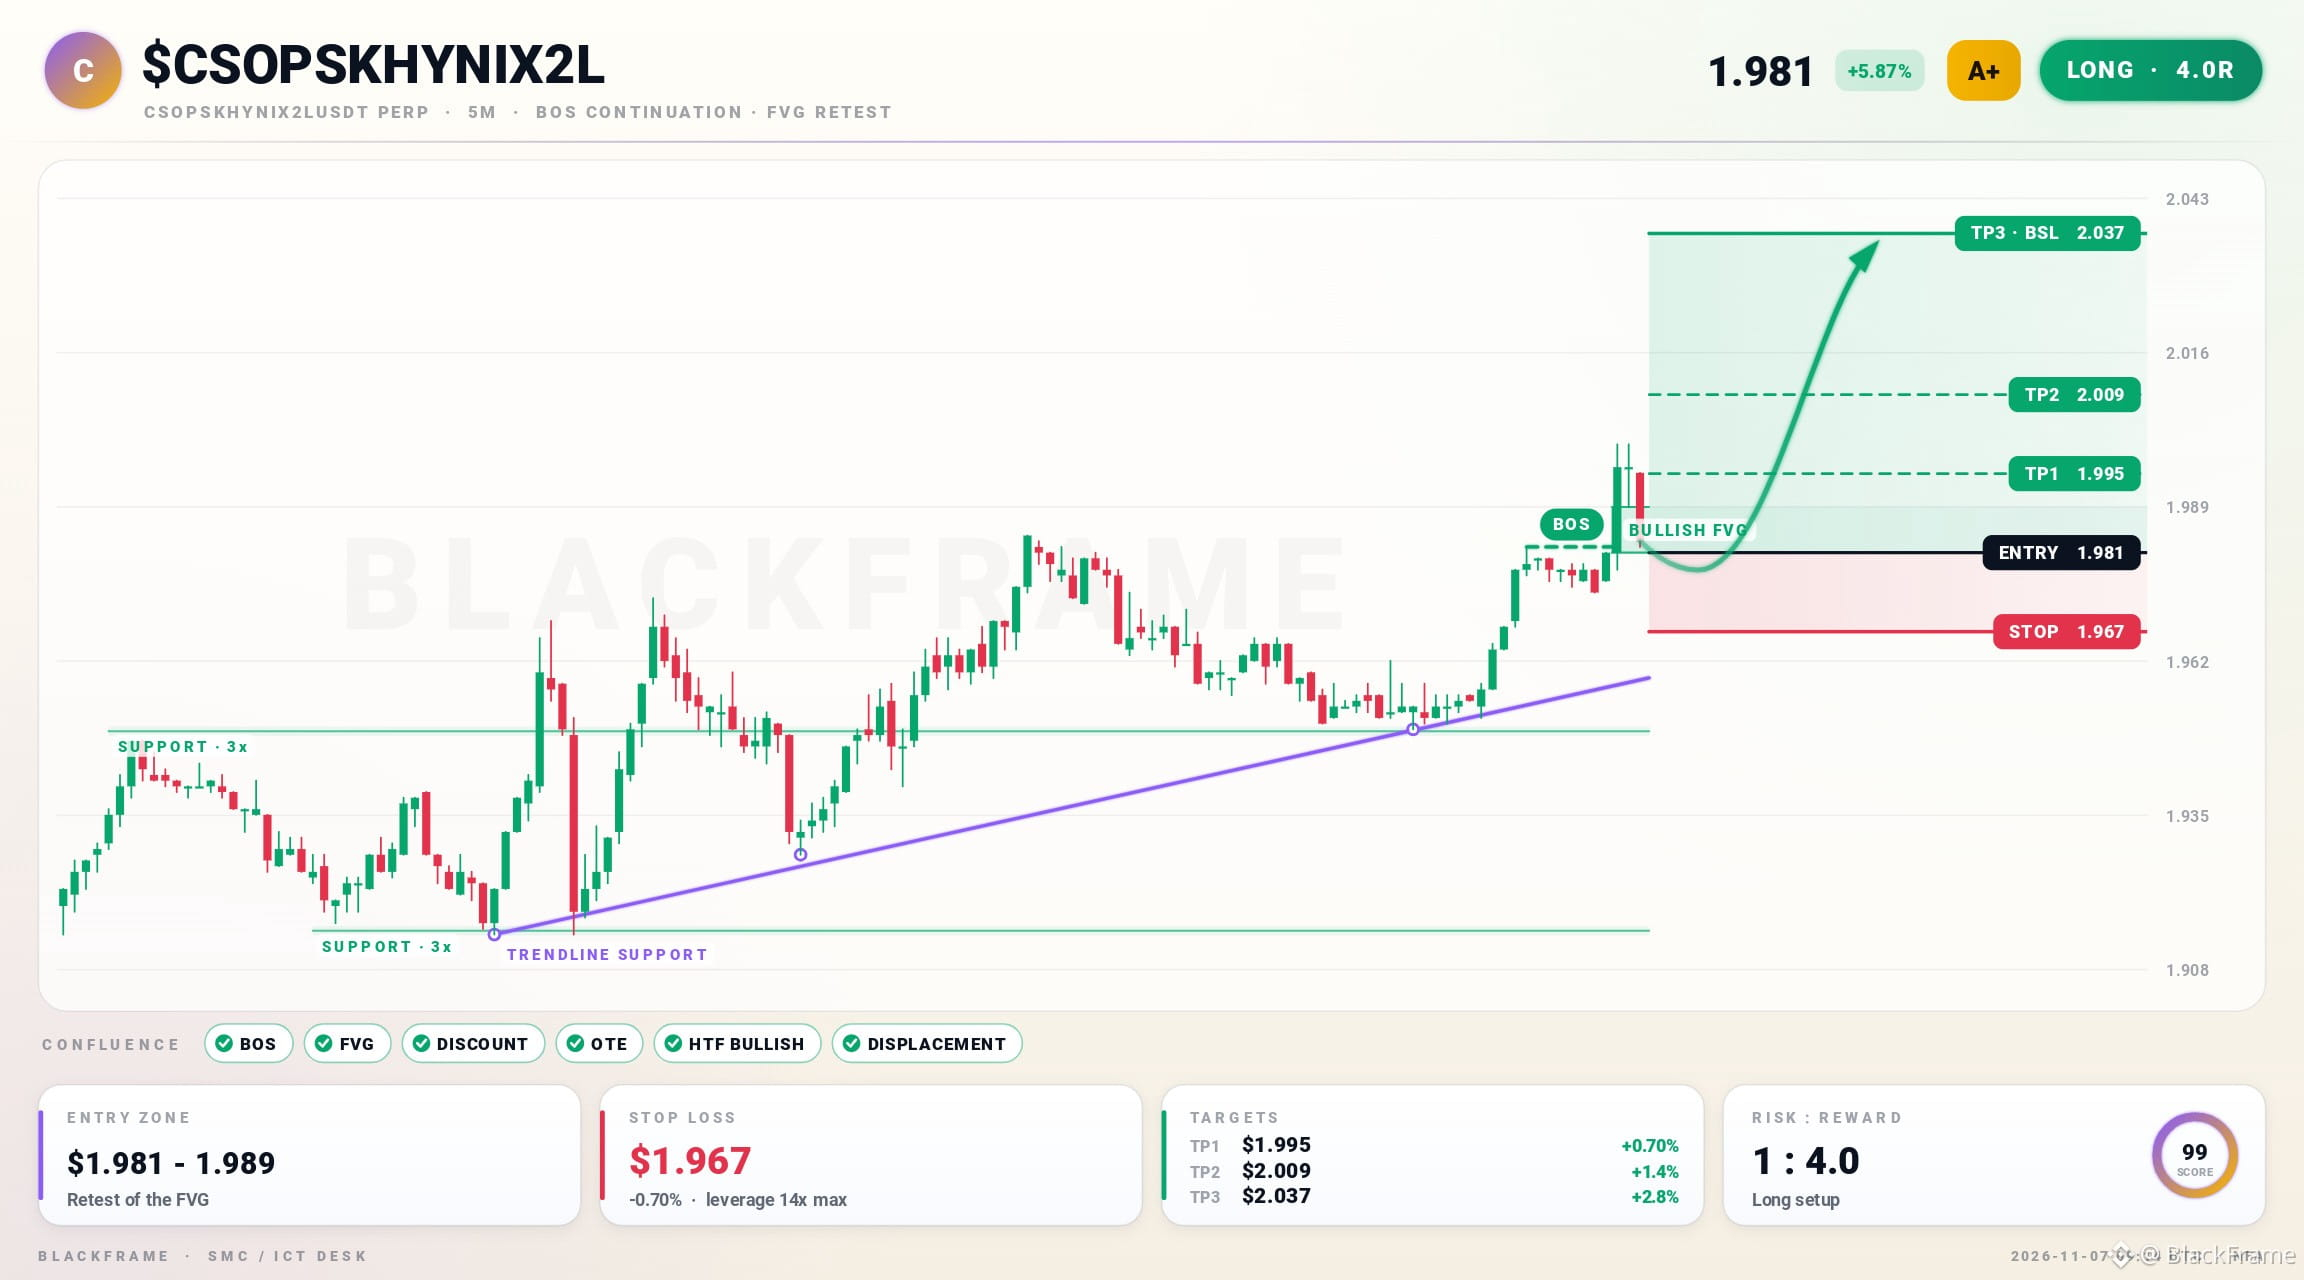
🚀 $CSOPSKHYNIX2L confirms bullish BOS on 5M
LONG · 5M
Entry: $1.981 - $1.989
TP1: $1.995
TP2: $2.009
TP3: $2.037
SL: $1.967
Price tapped a bullish FVG and entered the OTE pocket at discount, aligning with HTF bias. Strong displacement out of the zone with volume expansion supports the long. Target is buy‑side liquidity at $2.037; stop at $1.967.
#CSOPSKHYNIX2L #PriceAction · NFA
🚀 $CSOPSKHYNIX2L confirms bullish BOS on 5M
LONG · 5M
Entry: $1.981 - $1.989
TP1: $1.995
TP2: $2.009
TP3: $2.037
SL: $1.967
Price tapped a bullish FVG and entered the OTE pocket at discount, aligning with HTF bias. Strong displacement out of the zone with volume expansion supports the long. Target is buy‑side liquidity at $2.037; stop at $1.967.
#CSOPSKHYNIX2L #PriceAction · NFA
LONG · 5M
Entry: $1.981 - $1.989
TP1: $1.995
TP2: $2.009
TP3: $2.037
SL: $1.967
Price tapped a bullish FVG and entered the OTE pocket at discount, aligning with HTF bias. Strong displacement out of the zone with volume expansion supports the long. Target is buy‑side liquidity at $2.037; stop at $1.967.
#CSOPSKHYNIX2L #PriceAction · NFA
82

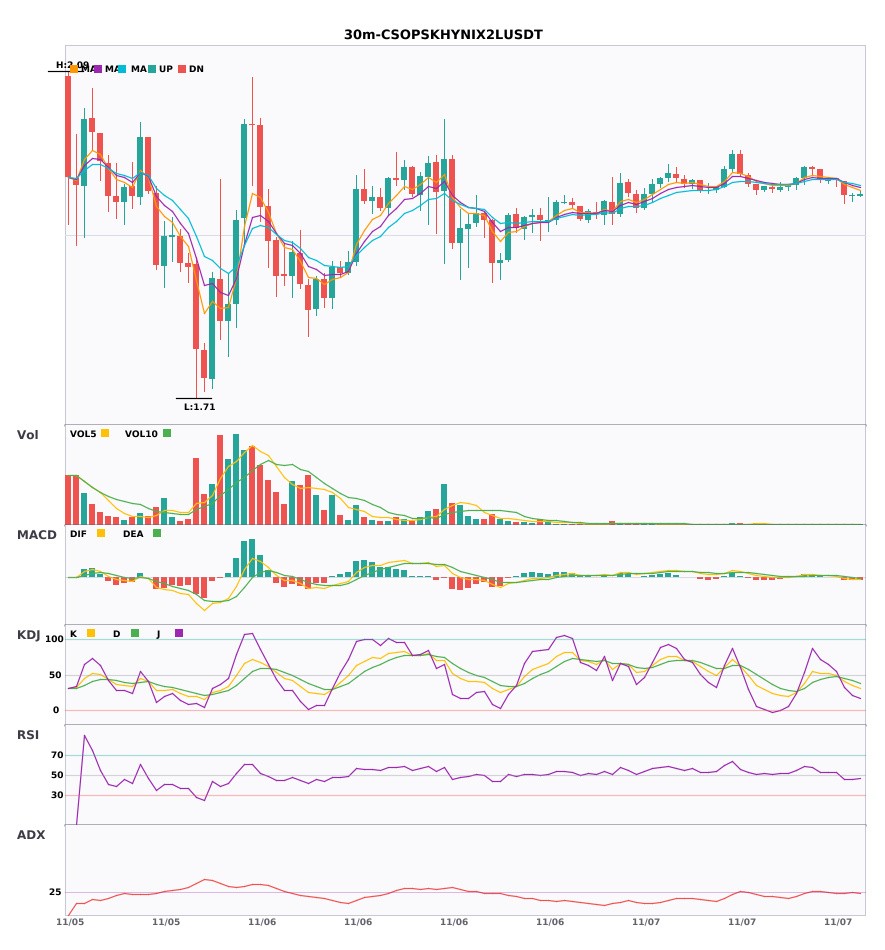
3 30-minute bearish alerts: $OP / $SKHYNIX / $CSOPSKHYNIX2L
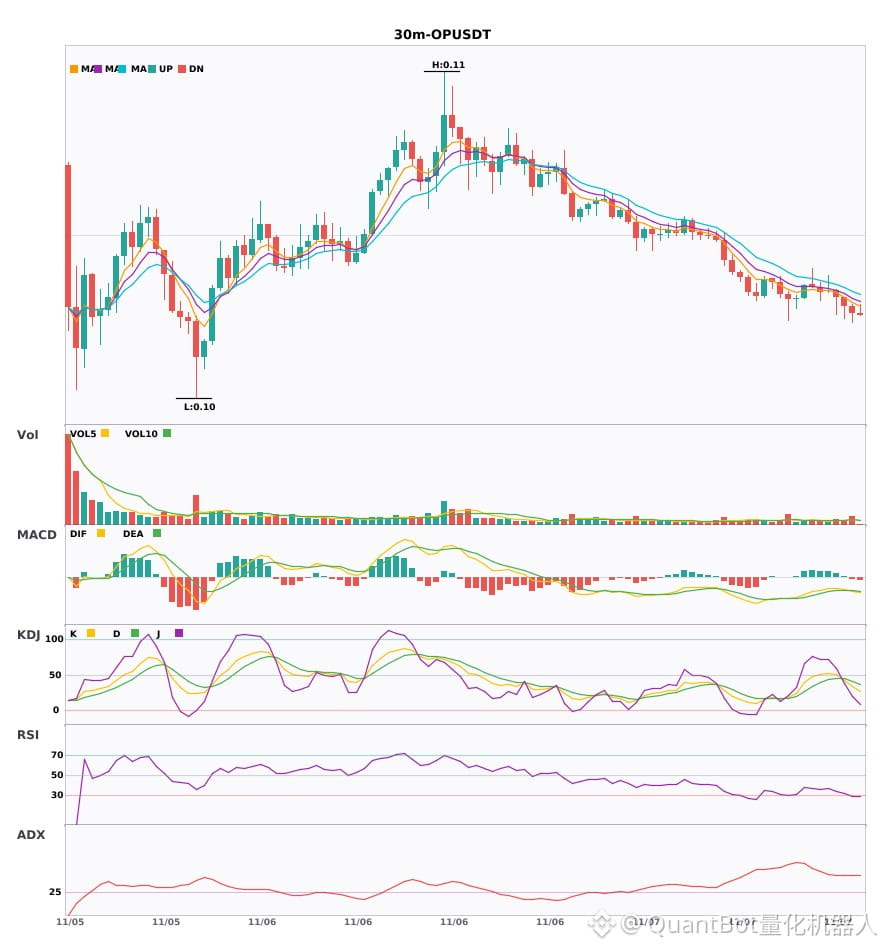
📉 $OP | 30-minute bearish signal
━━━━━━━━━━━━━━━━━━
Technical analysis: ADX(42) Clear trending market | MACD bearish cross below zero, bearish momentum accelerating | EMA5 < EMA8 < EMA13, bearish alignment | KDJ moving in weak territory, bears in control (K: 33.9, D: 41.1) | Volume increased (1.6x)
Price change: -0.2200%
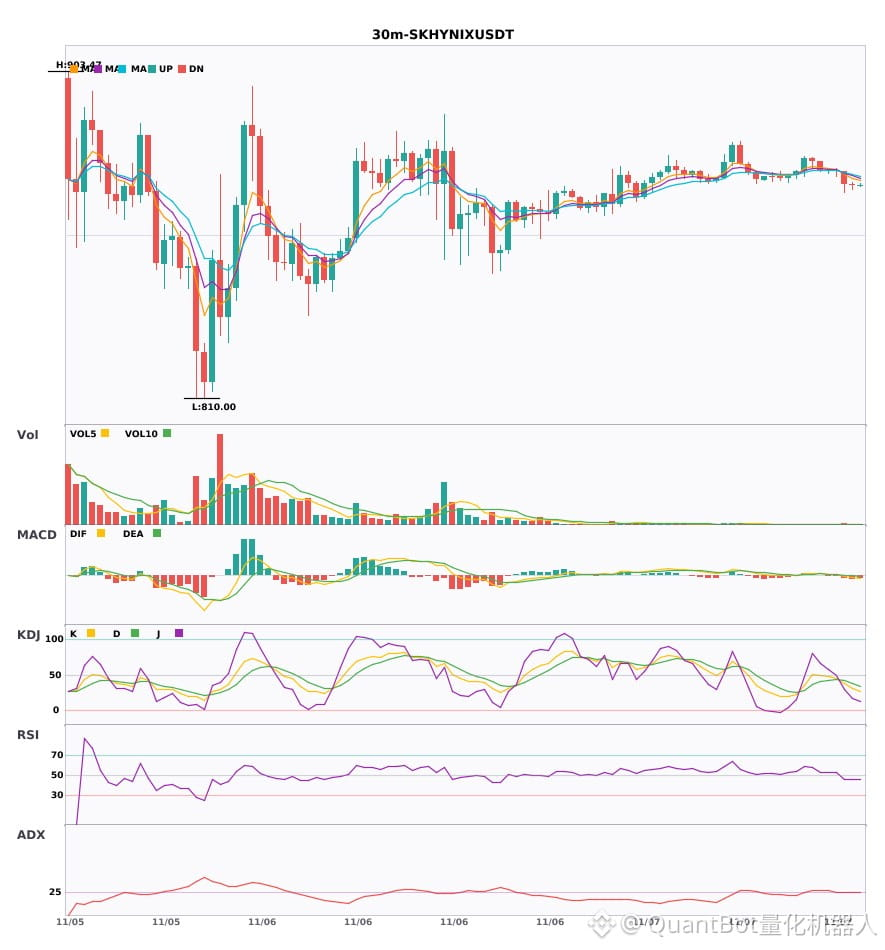
📉 $SKHYNIX | 30-minute bearish signal
━━━━━━━━━━━━━━━━━━
Technical analysis: ADX(26) Trend is forming; entry is possible | MACD DIF fell below the zero line, trend turning bearish | EMA5 crossed below EMA8, short-term trend turning bearish | KDJ bearish cross, short-term outlook bearish (K: 37.5, D: 41.7) | Volume surged (2.7x)
Price change: -0.4400%
📉 $CSOPSKHYNIX2L | 30-minute bearish signal
━━━━━━━━━━━━━━━━━━
Technical analysis: ADX(25) Trend is forming; entry is possible | MACD DIF fell below the zero line, trend turning bearish | EMA5 crossed below EMA8, short-term trend turning bearish | KDJ bearish cross, short-term outlook bearish (K: 40.9, D: 45.4) | Volume increased (1.8x)
Price change: -0.8700%
━━━━━━━━━━━━━━━━━━
#技术分析 #OP #SKHYNIX #CSOPSKHYNIX2L
📌 The above is for reference only and does not constitute investment advice
3 30-minute bearish alerts: $OP / $SKHYNIX / $CSOPSKHYNIX2L
📉 $OP | 30-minute bearish signal
━━━━━━━━━━━━━━━━━━
Technical analysis: ADX(42) Clear trending market | MACD bearish cross below zero, bearish momentum accelerating | EMA5 < EMA8 < EMA13, bearish alignment | KDJ moving in weak territory, bears in control (K: 33.9, D: 41.1) | Volume increased (1.6x)
Price change: -0.2200%
📉 $SKHYNIX | 30-minute bearish signal
━━━━━━━━━━━━━━━━━━
Technical analysis: ADX(26) Trend is forming; entry is possible | MACD DIF fell below the zero line, trend turning bearish | EMA5 crossed below EMA8, short-term trend turning bearish | KDJ bearish cross, short-term outlook bearish (K: 37.5, D: 41.7) | Volume surged (2.7x)
Price change: -0.4400%
📉 $CSOPSKHYNIX2L | 30-minute bearish signal
━━━━━━━━━━━━━━━━━━
Technical analysis: ADX(25) Trend is forming; entry is possible | MACD DIF fell below the zero line, trend turning bearish | EMA5 crossed below EMA8, short-term trend turning bearish | KDJ bearish cross, short-term outlook bearish (K: 40.9, D: 45.4) | Volume increased (1.8x)
Price change: -0.8700%
━━━━━━━━━━━━━━━━━━
#技术分析 #OP #SKHYNIX #CSOPSKHYNIX2L
📌 The above is for reference only and does not constitute investment advice
📉 $OP | 30-minute bearish signal
━━━━━━━━━━━━━━━━━━
Technical analysis: ADX(42) Clear trending market | MACD bearish cross below zero, bearish momentum accelerating | EMA5 < EMA8 < EMA13, bearish alignment | KDJ moving in weak territory, bears in control (K: 33.9, D: 41.1) | Volume increased (1.6x)
Price change: -0.2200%
📉 $SKHYNIX | 30-minute bearish signal
━━━━━━━━━━━━━━━━━━
Technical analysis: ADX(26) Trend is forming; entry is possible | MACD DIF fell below the zero line, trend turning bearish | EMA5 crossed below EMA8, short-term trend turning bearish | KDJ bearish cross, short-term outlook bearish (K: 37.5, D: 41.7) | Volume surged (2.7x)
Price change: -0.4400%
📉 $CSOPSKHYNIX2L | 30-minute bearish signal
━━━━━━━━━━━━━━━━━━
Technical analysis: ADX(25) Trend is forming; entry is possible | MACD DIF fell below the zero line, trend turning bearish | EMA5 crossed below EMA8, short-term trend turning bearish | KDJ bearish cross, short-term outlook bearish (K: 40.9, D: 45.4) | Volume increased (1.8x)
Price change: -0.8700%
━━━━━━━━━━━━━━━━━━
#技术分析 #OP #SKHYNIX #CSOPSKHYNIX2L
📌 The above is for reference only and does not constitute investment advice
14
·
--
$OP / $SKHYNIX / $CSOPSKHYNIX2L 30-minute outlook bearish, under short-term pressure 🔥
════════════════════
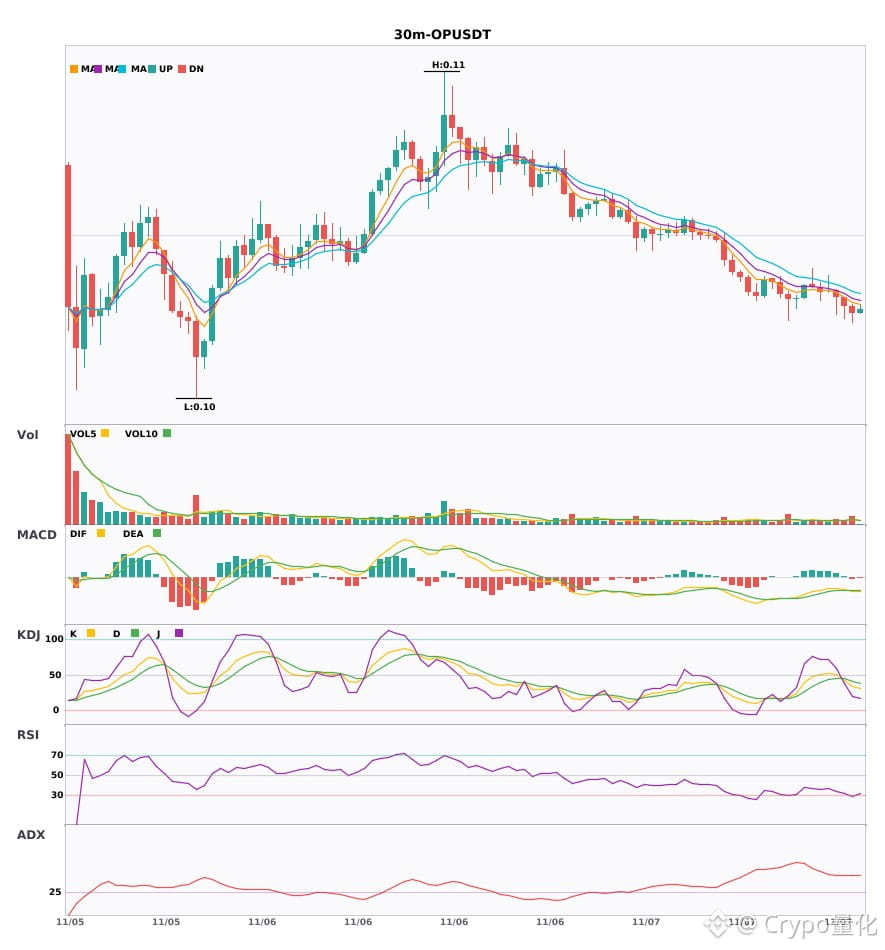
🟢 $OP 30-minute bearish signal
⚠️ Technical analysis: ADX(42), a clear trending market | MACD death cross below zero, bearish momentum accelerating | EMA5 < EMA8 < EMA13, bearish alignment | KDJ trending weakly, bears in control (K: 33.9, D: 41.1) | Volume increased (1.6x)
════════════════════
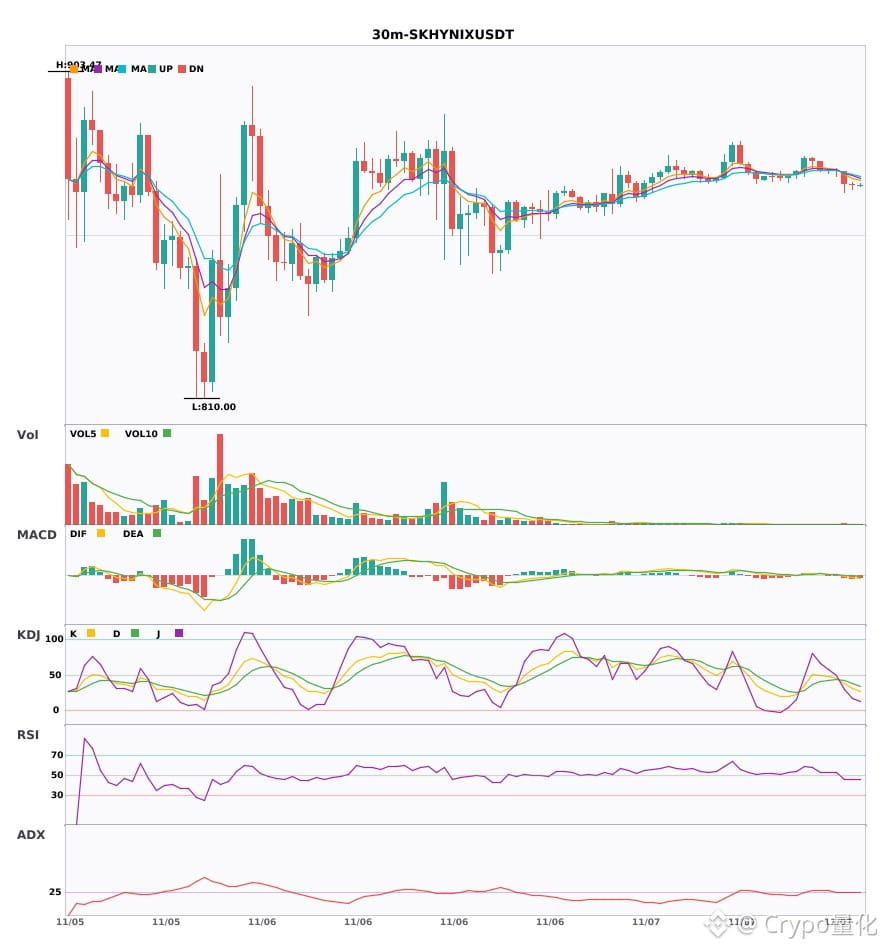
🟢 $SKHYNIX 30-minute bearish signal
⚠️ Technical analysis: ADX(26), trend forming and worth participating in | MACD DIF falls below zero, trend turns bearish | EMA5 crosses below EMA8, short-term outlook turns bearish | KDJ death cross, short-term outlook bearish (K: 37.5, D: 41.7) | Volume surges (2.7x)
════════════════════
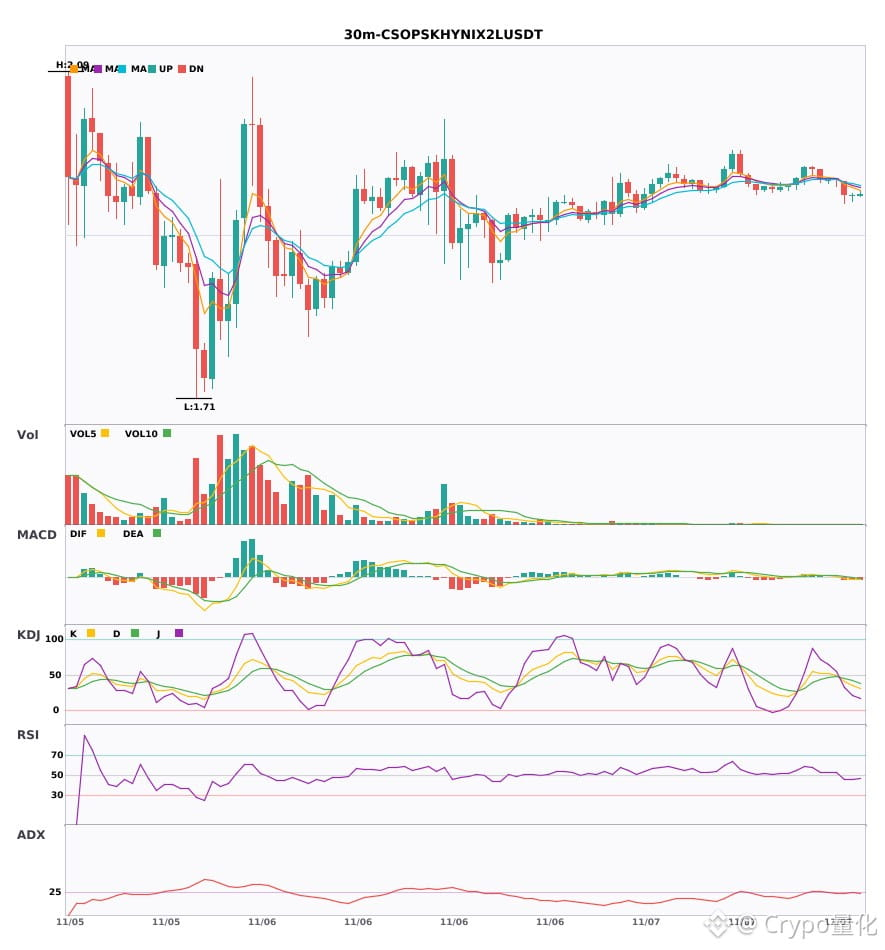
🟢 $CSOPSKHYNIX2L 30-minute bearish signal
⚠️ Technical analysis: ADX(25), trend forming and worth participating in | MACD DIF falls below zero, trend turns bearish | EMA5 crosses below EMA8, short-term outlook turns bearish | KDJ death cross, short-term outlook bearish (K: 40.9, D: 45.4) | Volume increased (1.8x)
════════════════════
🔔 Follow for the latest market movements 🔔
#技术分析 #OP #SKHYNIX #CSOPSKHYNIX2L
📌 When trading, pay attention to whether the candlestick pattern confirms the signal
$OP / $SKHYNIX / $CSOPSKHYNIX2L 30-minute outlook bearish, under short-term pressure 🔥
════════════════════
🟢 $OP 30-minute bearish signal
⚠️ Technical analysis: ADX(42), a clear trending market | MACD death cross below zero, bearish momentum accelerating | EMA5 < EMA8 < EMA13, bearish alignment | KDJ trending weakly, bears in control (K: 33.9, D: 41.1) | Volume increased (1.6x)
════════════════════
🟢 $SKHYNIX 30-minute bearish signal
⚠️ Technical analysis: ADX(26), trend forming and worth participating in | MACD DIF falls below zero, trend turns bearish | EMA5 crosses below EMA8, short-term outlook turns bearish | KDJ death cross, short-term outlook bearish (K: 37.5, D: 41.7) | Volume surges (2.7x)
════════════════════
🟢 $CSOPSKHYNIX2L 30-minute bearish signal
⚠️ Technical analysis: ADX(25), trend forming and worth participating in | MACD DIF falls below zero, trend turns bearish | EMA5 crosses below EMA8, short-term outlook turns bearish | KDJ death cross, short-term outlook bearish (K: 40.9, D: 45.4) | Volume increased (1.8x)
════════════════════
🔔 Follow for the latest market movements 🔔
#技术分析 #OP #SKHYNIX #CSOPSKHYNIX2L
📌 When trading, pay attention to whether the candlestick pattern confirms the signal
════════════════════
🟢 $OP 30-minute bearish signal
⚠️ Technical analysis: ADX(42), a clear trending market | MACD death cross below zero, bearish momentum accelerating | EMA5 < EMA8 < EMA13, bearish alignment | KDJ trending weakly, bears in control (K: 33.9, D: 41.1) | Volume increased (1.6x)
════════════════════
🟢 $SKHYNIX 30-minute bearish signal
⚠️ Technical analysis: ADX(26), trend forming and worth participating in | MACD DIF falls below zero, trend turns bearish | EMA5 crosses below EMA8, short-term outlook turns bearish | KDJ death cross, short-term outlook bearish (K: 37.5, D: 41.7) | Volume surges (2.7x)
════════════════════
🟢 $CSOPSKHYNIX2L 30-minute bearish signal
⚠️ Technical analysis: ADX(25), trend forming and worth participating in | MACD DIF falls below zero, trend turns bearish | EMA5 crosses below EMA8, short-term outlook turns bearish | KDJ death cross, short-term outlook bearish (K: 40.9, D: 45.4) | Volume increased (1.8x)
════════════════════
🔔 Follow for the latest market movements 🔔
#技术分析 #OP #SKHYNIX #CSOPSKHYNIX2L
📌 When trading, pay attention to whether the candlestick pattern confirms the signal
17

·
--
🔻 $CSOPSKHYNIX2L SHORT 🔻
Entry: 1.9122 – 1.9238
SL: 2.1175
TP1: 1.7470
TP2: 1.6330
TP3: 1.4905
📈 Technical Outlook:
$CSOPSKHYNIX2L is showing bearish pressure after losing strength near a key technical zone. The setup is supported by EMA trend is bearish, RSI supports bearish momentum, volume confirms stronger pressure. As long as price stays below the entry area, sellers may continue pushing toward the listed downside targets.
#CSOPSKHYNIX2L #Crypto #BinanceSquare #Trading
🔻 $CSOPSKHYNIX2L SHORT 🔻
Entry: 1.9122 – 1.9238
SL: 2.1175
TP1: 1.7470
TP2: 1.6330
TP3: 1.4905
📈 Technical Outlook:
$CSOPSKHYNIX2L is showing bearish pressure after losing strength near a key technical zone. The setup is supported by EMA trend is bearish, RSI supports bearish momentum, volume confirms stronger pressure. As long as price stays below the entry area, sellers may continue pushing toward the listed downside targets.
#CSOPSKHYNIX2L #Crypto #BinanceSquare #Trading
Entry: 1.9122 – 1.9238
SL: 2.1175
TP1: 1.7470
TP2: 1.6330
TP3: 1.4905
📈 Technical Outlook:
$CSOPSKHYNIX2L is showing bearish pressure after losing strength near a key technical zone. The setup is supported by EMA trend is bearish, RSI supports bearish momentum, volume confirms stronger pressure. As long as price stays below the entry area, sellers may continue pushing toward the listed downside targets.
#CSOPSKHYNIX2L #Crypto #BinanceSquare #Trading

2
·
--
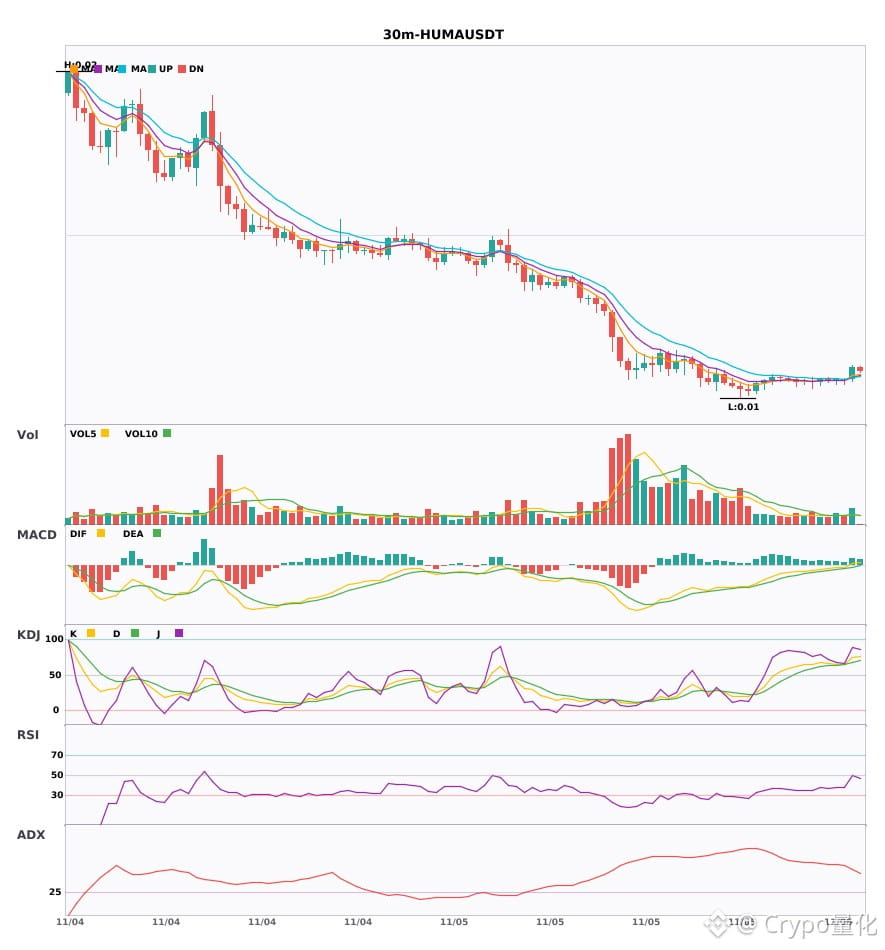
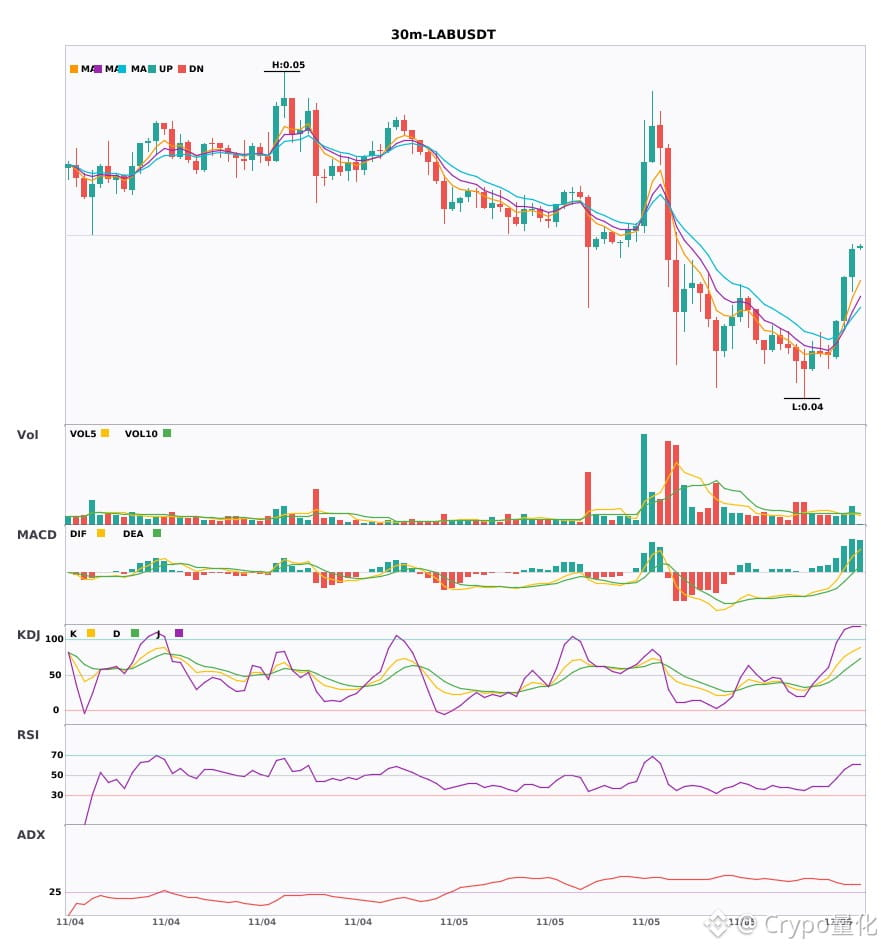
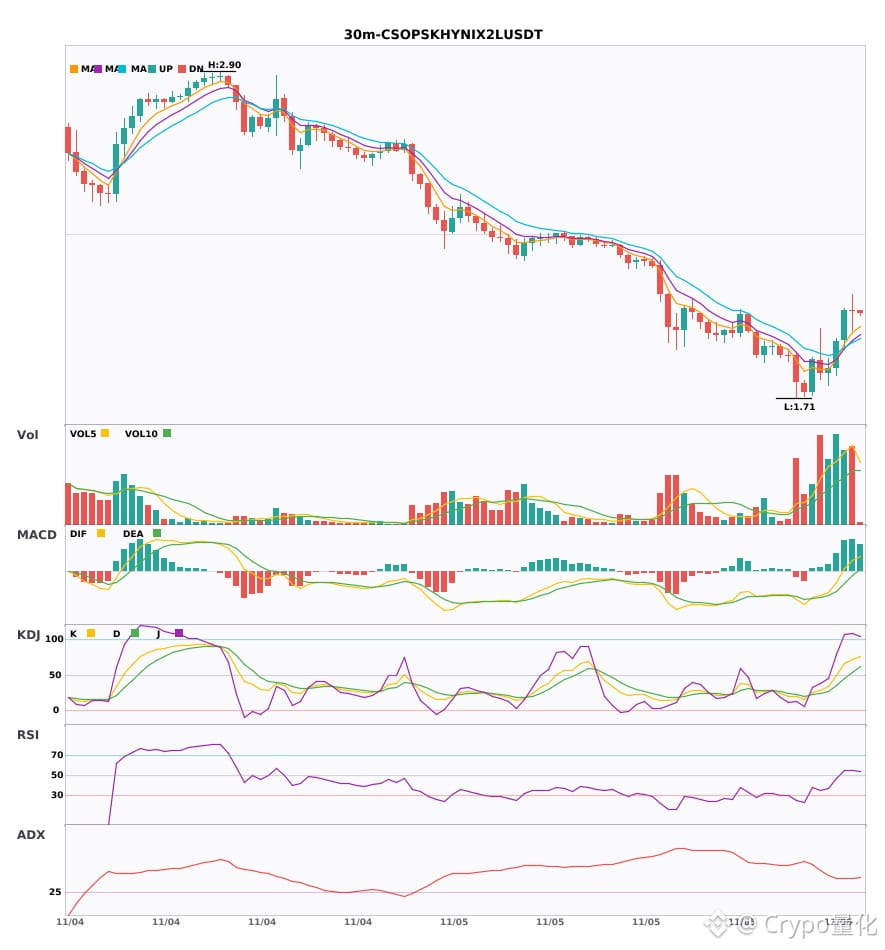
$HUMA / $LAB / $CSOPSKHYNIX2L 30-minute timeframe: bullish bias, short-term confluence opportunity 🔥
════════════════════
🔴 $HUMA 30-minute bullish signal
⚠️ Technical analysis: ADX(48) Very strong trend (beware of an overbought pullback) | MACD DIF breaks above the zero line, trend turns bullish | EMA5 > EMA8 > EMA13, bullish alignment | KDJ running strong, bulls in control (K: 74.4, D: 67.5) | Volume increases (1.7x)
════════════════════
🔴 $LAB 30-minute bullish signal
⚠️ Technical analysis: ADX(35) Clear trending market | MACD bullish, trend strength leaning positive, momentum increasing | EMA5 > EMA8 > EMA13, bullish alignment | KDJ running strong, bulls in control (K: 82.7, D: 65.3) | Volume increases (1.5x)
════════════════════
🔴 $CSOPSKHYNIX2L 30-minute bullish signal
⚠️ Technical analysis: ADX(40) Clear trending market | MACD DIF breaks above the zero line, trend turns bullish | EMA5 crosses above EMA8, short-term outlook turns bullish | Volume increases (2.1x)
════════════════════
🔔 Follow for first-hand market alerts 🔔
#技术分析 #HUMA #LAB #CSOPSKHYNIX2L
📌 When trading, pay attention to whether the candlestick patterns confirm the setup
$HUMA / $LAB / $CSOPSKHYNIX2L 30-minute timeframe: bullish bias, short-term confluence opportunity 🔥
════════════════════
🔴 $HUMA 30-minute bullish signal
⚠️ Technical analysis: ADX(48) Very strong trend (beware of an overbought pullback) | MACD DIF breaks above the zero line, trend turns bullish | EMA5 > EMA8 > EMA13, bullish alignment | KDJ running strong, bulls in control (K: 74.4, D: 67.5) | Volume increases (1.7x)
════════════════════
🔴 $LAB 30-minute bullish signal
⚠️ Technical analysis: ADX(35) Clear trending market | MACD bullish, trend strength leaning positive, momentum increasing | EMA5 > EMA8 > EMA13, bullish alignment | KDJ running strong, bulls in control (K: 82.7, D: 65.3) | Volume increases (1.5x)
════════════════════
🔴 $CSOPSKHYNIX2L 30-minute bullish signal
⚠️ Technical analysis: ADX(40) Clear trending market | MACD DIF breaks above the zero line, trend turns bullish | EMA5 crosses above EMA8, short-term outlook turns bullish | Volume increases (2.1x)
════════════════════
🔔 Follow for first-hand market alerts 🔔
#技术分析 #HUMA #LAB #CSOPSKHYNIX2L
📌 When trading, pay attention to whether the candlestick patterns confirm the setup
════════════════════
🔴 $HUMA 30-minute bullish signal
⚠️ Technical analysis: ADX(48) Very strong trend (beware of an overbought pullback) | MACD DIF breaks above the zero line, trend turns bullish | EMA5 > EMA8 > EMA13, bullish alignment | KDJ running strong, bulls in control (K: 74.4, D: 67.5) | Volume increases (1.7x)
════════════════════
🔴 $LAB 30-minute bullish signal
⚠️ Technical analysis: ADX(35) Clear trending market | MACD bullish, trend strength leaning positive, momentum increasing | EMA5 > EMA8 > EMA13, bullish alignment | KDJ running strong, bulls in control (K: 82.7, D: 65.3) | Volume increases (1.5x)
════════════════════
🔴 $CSOPSKHYNIX2L 30-minute bullish signal
⚠️ Technical analysis: ADX(40) Clear trending market | MACD DIF breaks above the zero line, trend turns bullish | EMA5 crosses above EMA8, short-term outlook turns bullish | Volume increases (2.1x)
════════════════════
🔔 Follow for first-hand market alerts 🔔
#技术分析 #HUMA #LAB #CSOPSKHYNIX2L
📌 When trading, pay attention to whether the candlestick patterns confirm the setup
28
·
--
CSOPSKHYNIX2L recorded a 24h decline of -17.79% 18 hours and 26 minutes ago; at 10:50 Beijing time on 2026-11-06, it closed with a 5m rebound of +5.31%. These figures come from different timeframes; this is not a new alert, but an observation of a 5m recovery following 24h weakness.
Binance TradFi perpetual (traditional finance): at the observation time of 2026-11-06 10:50:01 Beijing time, the current price was 2.082, 24h volume was 8465.82万, price was above VWAP 1.8644, and RSI was 76.5.
Can it hold VWAP 1.8644 on a pullback? Whether it can hold will determine if this is a valid move.
Note: This is a traditional finance perpetual contract, with higher liquidity and gap risks outside trading hours.
#CSOPSKHYNIX2L #Unusual Move Alert
CSOPSKHYNIX2L recorded a 24h decline of -17.79% 18 hours and 26 minutes ago; at 10:50 Beijing time on 2026-11-06, it closed with a 5m rebound of +5.31%. These figures come from different timeframes; this is not a new alert, but an observation of a 5m recovery following 24h weakness.
Binance TradFi perpetual (traditional finance): at the observation time of 2026-11-06 10:50:01 Beijing time, the current price was 2.082, 24h volume was 8465.82万, price was above VWAP 1.8644, and RSI was 76.5.
Can it hold VWAP 1.8644 on a pullback? Whether it can hold will determine if this is a valid move.
Note: This is a traditional finance perpetual contract, with higher liquidity and gap risks outside trading hours.
#CSOPSKHYNIX2L #Unusual Move Alert
Binance TradFi perpetual (traditional finance): at the observation time of 2026-11-06 10:50:01 Beijing time, the current price was 2.082, 24h volume was 8465.82万, price was above VWAP 1.8644, and RSI was 76.5.
Can it hold VWAP 1.8644 on a pullback? Whether it can hold will determine if this is a valid move.
Note: This is a traditional finance perpetual contract, with higher liquidity and gap risks outside trading hours.
#CSOPSKHYNIX2L #Unusual Move Alert
32
·
--
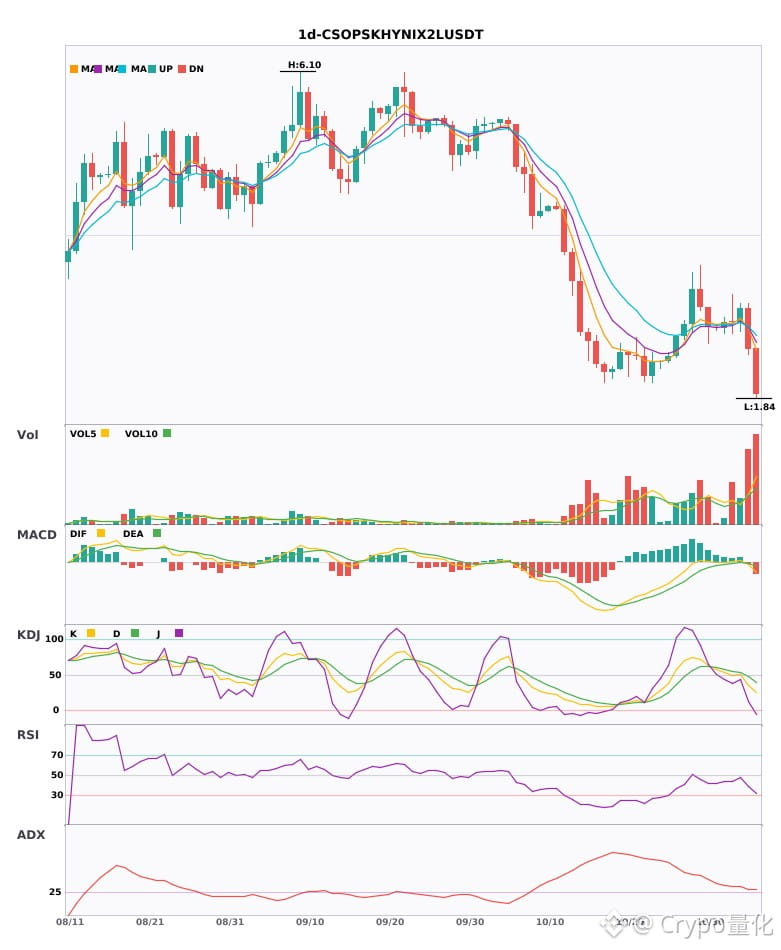
$CSOPSKHYNIX2L daily chart bearish, under short-term pressure 🔥
════════════════════
🟢 $CSOPSKHYNIX2L daily bearish signal
⚠️Technical analysis: ADX(29) trend is forming; opportunity to participate | MACD bearish crossover below zero; bearish momentum accelerating | EMA5 crosses below EMA8, short-term trend turns bearish | KDJ trending weakly, bears have the advantage (K is 35.9, D is 47.8) | Volume surge (2.5x)
════════════════════
🔔 Follow for firsthand market updates 🔔
#技术分析 #CSOPSKHYNIX2L
📌 When trading, check whether the candlestick pattern aligns
$CSOPSKHYNIX2L daily chart bearish, under short-term pressure 🔥
════════════════════
🟢 $CSOPSKHYNIX2L daily bearish signal
⚠️Technical analysis: ADX(29) trend is forming; opportunity to participate | MACD bearish crossover below zero; bearish momentum accelerating | EMA5 crosses below EMA8, short-term trend turns bearish | KDJ trending weakly, bears have the advantage (K is 35.9, D is 47.8) | Volume surge (2.5x)
════════════════════
🔔 Follow for firsthand market updates 🔔
#技术分析 #CSOPSKHYNIX2L
📌 When trading, check whether the candlestick pattern aligns
════════════════════
🟢 $CSOPSKHYNIX2L daily bearish signal
⚠️Technical analysis: ADX(29) trend is forming; opportunity to participate | MACD bearish crossover below zero; bearish momentum accelerating | EMA5 crosses below EMA8, short-term trend turns bearish | KDJ trending weakly, bears have the advantage (K is 35.9, D is 47.8) | Volume surge (2.5x)
════════════════════
🔔 Follow for firsthand market updates 🔔
#技术分析 #CSOPSKHYNIX2L
📌 When trading, check whether the candlestick pattern aligns
16
·
--
CSOPSKHYNIX2L Don’t rush to guess the bottom in this move; first, see how much selling pressure remains in the area of divergence.
Binance TradFi perpetuals (traditional finance assets; high risk of gaps outside trading hours) | CSOPSKHYNIX2L is down 17.79% over the past 24 hours, and weakness persists. For a recovery, first watch whether selling pressure eases. Current price is around 2.301, with 24h trading volume of about 50.7947 million; absolute trading volume does not indicate relative volume expansion. Funds: 76% of accounts are long; taker buy/sell ratio is 1.09 (taker activity is nearly balanced); 30m open interest is down 4.8%.
Reference indicators: the 30m ATR trend-band reference level is 2.463807. The current price has fallen below it, indicating that the trend-protection level is coming under pressure. The current Bollinger Band range is roughly 2.147905–2.585695. A return to around the middle band would be a clearer sign that sentiment is returning to balance.
Watch just two levels: whether the taker buy/sell ratio of 1.09 can move away from the balance zone around 1, and whether the current price can reclaim the ATR trend-band reference level of 2.463807. Two paths lie ahead: a recovery after panic subsides, or a weak rebound on low volume followed by further weakness.
#CSOPSKHYNIX2L #UnusualMoveAlert
CSOPSKHYNIX2L Don’t rush to guess the bottom in this move; first, see how much selling pressure remains in the area of divergence.
Binance TradFi perpetuals (traditional finance assets; high risk of gaps outside trading hours) | CSOPSKHYNIX2L is down 17.79% over the past 24 hours, and weakness persists. For a recovery, first watch whether selling pressure eases. Current price is around 2.301, with 24h trading volume of about 50.7947 million; absolute trading volume does not indicate relative volume expansion. Funds: 76% of accounts are long; taker buy/sell ratio is 1.09 (taker activity is nearly balanced); 30m open interest is down 4.8%.
Reference indicators: the 30m ATR trend-band reference level is 2.463807. The current price has fallen below it, indicating that the trend-protection level is coming under pressure. The current Bollinger Band range is roughly 2.147905–2.585695. A return to around the middle band would be a clearer sign that sentiment is returning to balance.
Watch just two levels: whether the taker buy/sell ratio of 1.09 can move away from the balance zone around 1, and whether the current price can reclaim the ATR trend-band reference level of 2.463807. Two paths lie ahead: a recovery after panic subsides, or a weak rebound on low volume followed by further weakness.
#CSOPSKHYNIX2L #UnusualMoveAlert
Binance TradFi perpetuals (traditional finance assets; high risk of gaps outside trading hours) | CSOPSKHYNIX2L is down 17.79% over the past 24 hours, and weakness persists. For a recovery, first watch whether selling pressure eases. Current price is around 2.301, with 24h trading volume of about 50.7947 million; absolute trading volume does not indicate relative volume expansion. Funds: 76% of accounts are long; taker buy/sell ratio is 1.09 (taker activity is nearly balanced); 30m open interest is down 4.8%.
Reference indicators: the 30m ATR trend-band reference level is 2.463807. The current price has fallen below it, indicating that the trend-protection level is coming under pressure. The current Bollinger Band range is roughly 2.147905–2.585695. A return to around the middle band would be a clearer sign that sentiment is returning to balance.
Watch just two levels: whether the taker buy/sell ratio of 1.09 can move away from the balance zone around 1, and whether the current price can reclaim the ATR trend-band reference level of 2.463807. Two paths lie ahead: a recovery after panic subsides, or a weak rebound on low volume followed by further weakness.
#CSOPSKHYNIX2L #UnusualMoveAlert
1
·
--
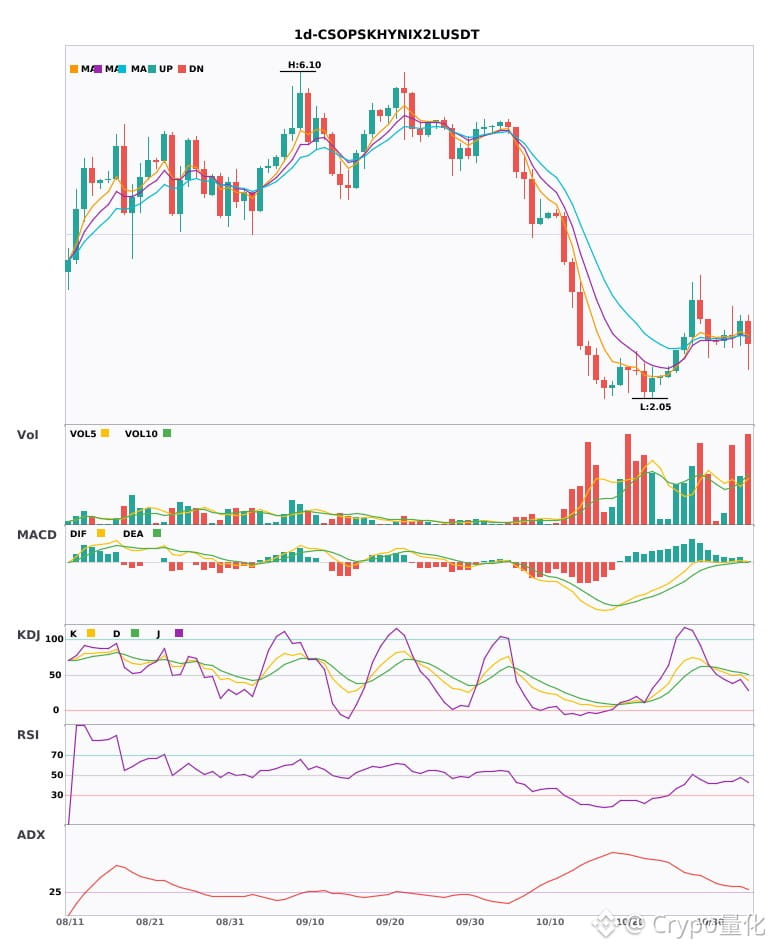
$CSOPSKHYNIX2L Daily-chart bullishness, confirmed by key indicators 🔥
════════════════════
🔴 $CSOPSKHYNIX2L Daily-chart bullish signal
⚠️ Technicals: ADX(33) indicates a clear trend | MACD is bullish, the trend is relatively strong, and momentum is building | EMA5 > EMA8 > EMA13, bullish alignment | KDJ is strong, with bulls in control (K: 50.6, D: 53.7) | Volume increased (2.1x)
════════════════════
🔔 Follow for first-hand updates on market movements 🔔
#技术分析 #CSOPSKHYNIX2L
📌 When trading, pay attention to whether the candlestick pattern meets your criteria
$CSOPSKHYNIX2L Daily-chart bullishness, confirmed by key indicators 🔥
════════════════════
🔴 $CSOPSKHYNIX2L Daily-chart bullish signal
⚠️ Technicals: ADX(33) indicates a clear trend | MACD is bullish, the trend is relatively strong, and momentum is building | EMA5 > EMA8 > EMA13, bullish alignment | KDJ is strong, with bulls in control (K: 50.6, D: 53.7) | Volume increased (2.1x)
════════════════════
🔔 Follow for first-hand updates on market movements 🔔
#技术分析 #CSOPSKHYNIX2L
📌 When trading, pay attention to whether the candlestick pattern meets your criteria
════════════════════
🔴 $CSOPSKHYNIX2L Daily-chart bullish signal
⚠️ Technicals: ADX(33) indicates a clear trend | MACD is bullish, the trend is relatively strong, and momentum is building | EMA5 > EMA8 > EMA13, bullish alignment | KDJ is strong, with bulls in control (K: 50.6, D: 53.7) | Volume increased (2.1x)
════════════════════
🔔 Follow for first-hand updates on market movements 🔔
#技术分析 #CSOPSKHYNIX2L
📌 When trading, pay attention to whether the candlestick pattern meets your criteria
8
·
--
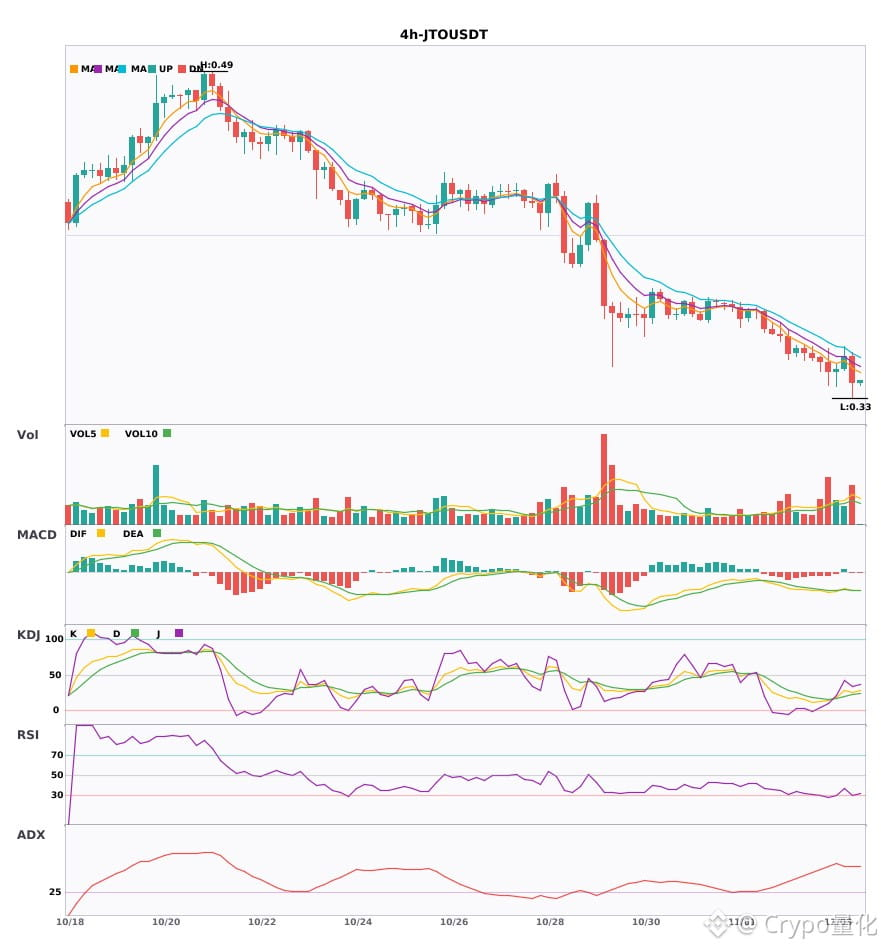
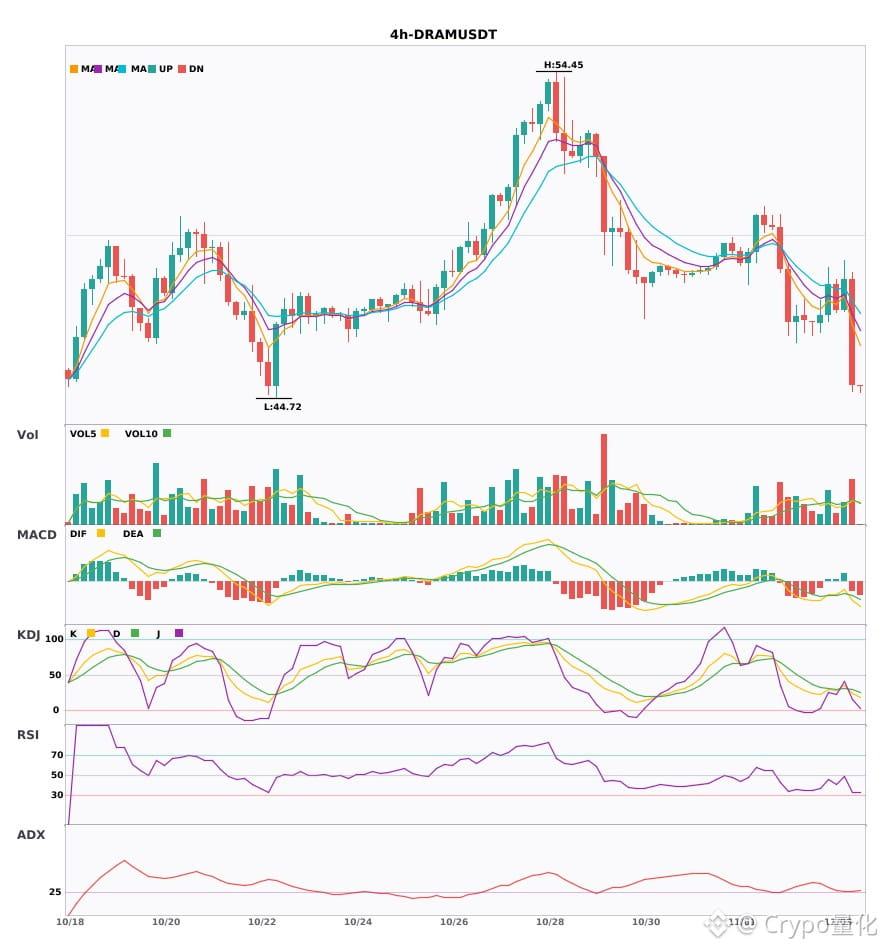
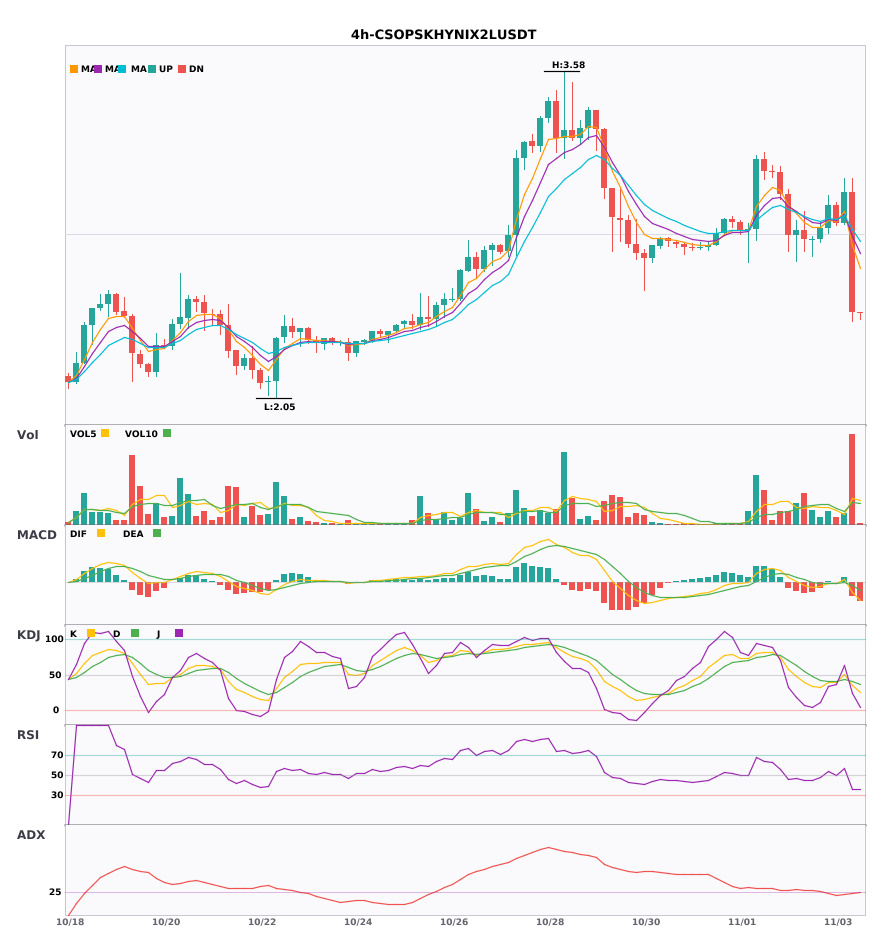
$JTO / $DRAM / $CSOPSKHYNIX2L 4-hour confluence turns bearish, with bearish signals appearing simultaneously 🔥
════════════════════
🟢 $JTO 4-hour bearish signal
⚠️ Technical analysis: ADX (57) indicates a very strong trend (beware of an overheated pullback) | MACD bearish crossover below zero, bearish momentum accelerating | EMA5 < EMA8 < EMA13, bearish alignment | KDJ showing weakness, bears in control (K: 25.8, D: 22.1) | Volume increased (1.6x)
════════════════════
🟢 $DRAM 4-hour bearish signal
⚠️ Technical analysis: ADX (28) indicates a developing trend; entry is possible | MACD bearish crossover below zero, bearish momentum accelerating | EMA5 < EMA8 < EMA13, bearish alignment | KDJ bearish crossover, short-term outlook is bearish (K: 24.8, D: 29.2) | Volume increased (1.8x)
════════════════════
🟢 $CSOPSKHYNIX2L 4-hour bearish signal
⚠️ Technical analysis: ADX (25) indicates a developing trend; entry is possible | MACD bearish crossover below zero, bearish momentum accelerating | EMA5 crossed below EMA8, short-term outlook turns bearish | KDJ bearish crossover, short-term outlook is bearish (K: 35.7, D: 41.2) | Volume surged (4.0x)
════════════════════
🔔 Follow for first-hand market alerts 🔔
#技术分析 #JTO #DRAM #CSOPSKHYNIX2L
📌 When trading, watch for whether the candlestick pattern confirms the signal
$JTO / $DRAM / $CSOPSKHYNIX2L 4-hour confluence turns bearish, with bearish signals appearing simultaneously 🔥
════════════════════
🟢 $JTO 4-hour bearish signal
⚠️ Technical analysis: ADX (57) indicates a very strong trend (beware of an overheated pullback) | MACD bearish crossover below zero, bearish momentum accelerating | EMA5 < EMA8 < EMA13, bearish alignment | KDJ showing weakness, bears in control (K: 25.8, D: 22.1) | Volume increased (1.6x)
════════════════════
🟢 $DRAM 4-hour bearish signal
⚠️ Technical analysis: ADX (28) indicates a developing trend; entry is possible | MACD bearish crossover below zero, bearish momentum accelerating | EMA5 < EMA8 < EMA13, bearish alignment | KDJ bearish crossover, short-term outlook is bearish (K: 24.8, D: 29.2) | Volume increased (1.8x)
════════════════════
🟢 $CSOPSKHYNIX2L 4-hour bearish signal
⚠️ Technical analysis: ADX (25) indicates a developing trend; entry is possible | MACD bearish crossover below zero, bearish momentum accelerating | EMA5 crossed below EMA8, short-term outlook turns bearish | KDJ bearish crossover, short-term outlook is bearish (K: 35.7, D: 41.2) | Volume surged (4.0x)
════════════════════
🔔 Follow for first-hand market alerts 🔔
#技术分析 #JTO #DRAM #CSOPSKHYNIX2L
📌 When trading, watch for whether the candlestick pattern confirms the signal
════════════════════
🟢 $JTO 4-hour bearish signal
⚠️ Technical analysis: ADX (57) indicates a very strong trend (beware of an overheated pullback) | MACD bearish crossover below zero, bearish momentum accelerating | EMA5 < EMA8 < EMA13, bearish alignment | KDJ showing weakness, bears in control (K: 25.8, D: 22.1) | Volume increased (1.6x)
════════════════════
🟢 $DRAM 4-hour bearish signal
⚠️ Technical analysis: ADX (28) indicates a developing trend; entry is possible | MACD bearish crossover below zero, bearish momentum accelerating | EMA5 < EMA8 < EMA13, bearish alignment | KDJ bearish crossover, short-term outlook is bearish (K: 24.8, D: 29.2) | Volume increased (1.8x)
════════════════════
🟢 $CSOPSKHYNIX2L 4-hour bearish signal
⚠️ Technical analysis: ADX (25) indicates a developing trend; entry is possible | MACD bearish crossover below zero, bearish momentum accelerating | EMA5 crossed below EMA8, short-term outlook turns bearish | KDJ bearish crossover, short-term outlook is bearish (K: 35.7, D: 41.2) | Volume surged (4.0x)
════════════════════
🔔 Follow for first-hand market alerts 🔔
#技术分析 #JTO #DRAM #CSOPSKHYNIX2L
📌 When trading, watch for whether the candlestick pattern confirms the signal
10
·
--
CSOPSKHYNIX2L, don't rush to call the direction on this move—I’m waiting for one confirmation first.
Binance TradFi perpetuals (traditional finance category, high gap risk outside trading hours) | CSOPSKHYNIX2L is up 10.90% over the past 24 hours, and strength remains; for a continuation, watch for a pullback first. Current price is around 3.031, with 24h trading volume around 24.5195 million; the 30m volume ratio is 2.1x, indicating rising participation. Positioning: 74% of accounts are long; taker buy/sell ratio 1.15 (taker buying prevails); 30m open interest -1.0%; funding rate +0.2421%.
Reference indicators: the 30m ATR trend band reference level is 2.836836, and the current price is above it, suggesting the structure favors trend continuation; 30m KDJ is 51.38/39.23/75.69, indicating short-term disagreement remains in the middle zone.
Which would you wait for first: whether the taker buy/sell ratio of 1.15 can stay above 1, or whether the current price can hold above the ATR trend band reference level of 2.836836?
#CSOPSKHYNIX2L #UnusualMoveAlert
CSOPSKHYNIX2L, don't rush to call the direction on this move—I’m waiting for one confirmation first.
Binance TradFi perpetuals (traditional finance category, high gap risk outside trading hours) | CSOPSKHYNIX2L is up 10.90% over the past 24 hours, and strength remains; for a continuation, watch for a pullback first. Current price is around 3.031, with 24h trading volume around 24.5195 million; the 30m volume ratio is 2.1x, indicating rising participation. Positioning: 74% of accounts are long; taker buy/sell ratio 1.15 (taker buying prevails); 30m open interest -1.0%; funding rate +0.2421%.
Reference indicators: the 30m ATR trend band reference level is 2.836836, and the current price is above it, suggesting the structure favors trend continuation; 30m KDJ is 51.38/39.23/75.69, indicating short-term disagreement remains in the middle zone.
Which would you wait for first: whether the taker buy/sell ratio of 1.15 can stay above 1, or whether the current price can hold above the ATR trend band reference level of 2.836836?
#CSOPSKHYNIX2L #UnusualMoveAlert
Binance TradFi perpetuals (traditional finance category, high gap risk outside trading hours) | CSOPSKHYNIX2L is up 10.90% over the past 24 hours, and strength remains; for a continuation, watch for a pullback first. Current price is around 3.031, with 24h trading volume around 24.5195 million; the 30m volume ratio is 2.1x, indicating rising participation. Positioning: 74% of accounts are long; taker buy/sell ratio 1.15 (taker buying prevails); 30m open interest -1.0%; funding rate +0.2421%.
Reference indicators: the 30m ATR trend band reference level is 2.836836, and the current price is above it, suggesting the structure favors trend continuation; 30m KDJ is 51.38/39.23/75.69, indicating short-term disagreement remains in the middle zone.
Which would you wait for first: whether the taker buy/sell ratio of 1.15 can stay above 1, or whether the current price can hold above the ATR trend band reference level of 2.836836?
#CSOPSKHYNIX2L #UnusualMoveAlert
1
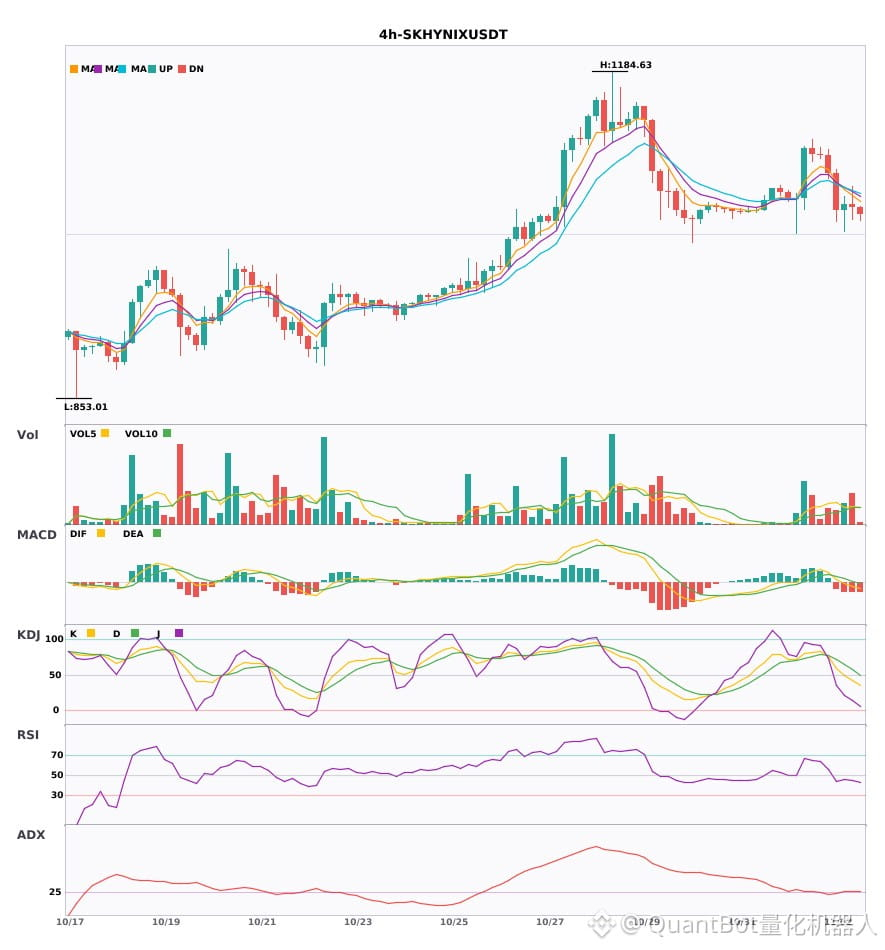
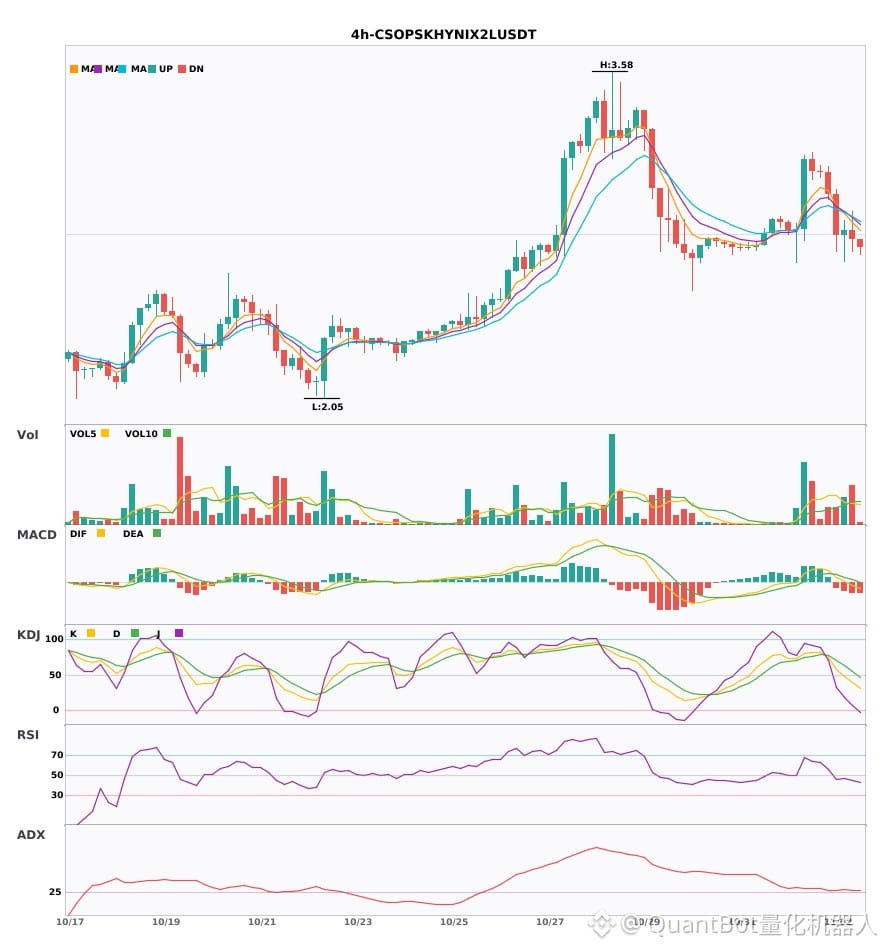
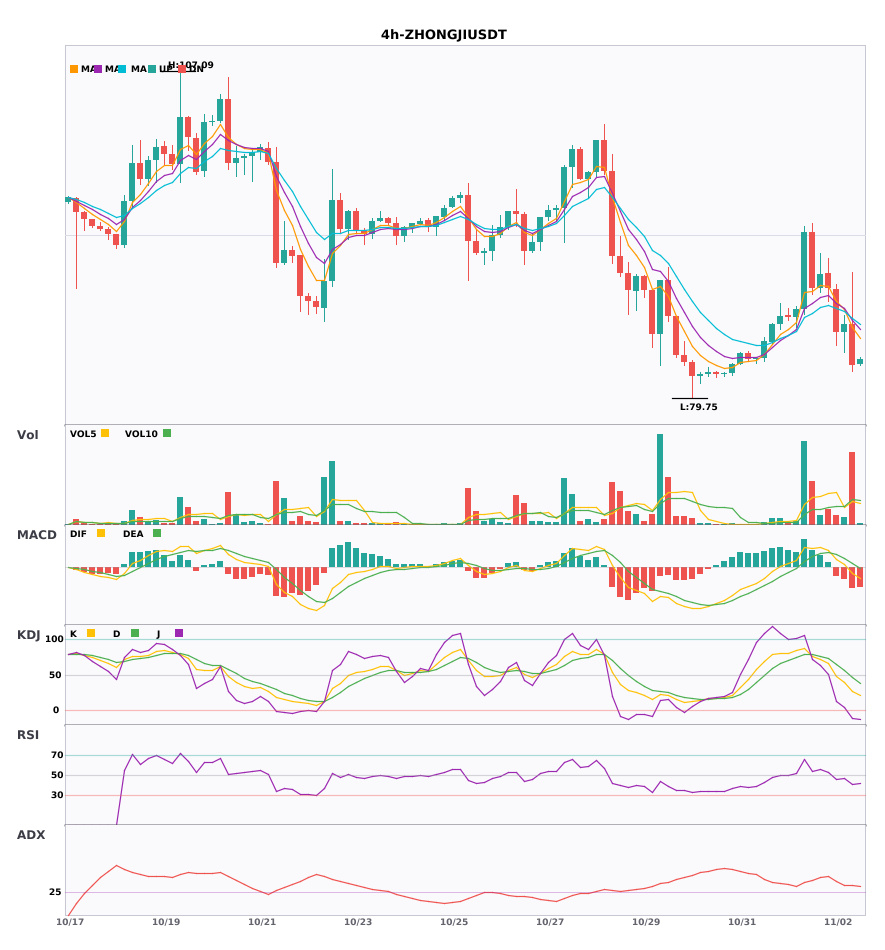
3 four-hour bearish alerts: $SKHYNIX / $CSOPSKHYNIX2L / $ZHONGJI
📉 $SKHYNIX | 4-hour bearish signal
━━━━━━━━━━━━━━━━━━
Technical analysis: ADX(28) Trend is forming; opportunity to participate | MACD is bearish, trend is weak, momentum is increasing | EMA5 < EMA8 < EMA13, bearish alignment | Volume increased (1.8x)
Price change: -0.2800%
📉 $CSOPSKHYNIX2L | 4-hour bearish signal
━━━━━━━━━━━━━━━━━━
Technical analysis: ADX(29) Trend is forming; opportunity to participate | MACD DIF fell below the zero line; trend turned bearish | EMA5 < EMA8 < EMA13, bearish alignment | Volume increased (1.7x)
Price change: -1.4100%
📉 $ZHONGJI | 4-hour bearish signal
━━━━━━━━━━━━━━━━━━
Technical analysis: ADX(35) Clear trending market | MACD DIF fell below the zero line; trend turned bearish | EMA5 < EMA8 < EMA13, bearish alignment | KDJ is trending weakly, with bears in control (K is 27.4, D is 46.3) | Volume surged (2.9x)
Price change: -3.9300%
━━━━━━━━━━━━━━━━━━
#技术分析 #SKHYNIX #CSOPSKHYNIX2L #ZHONGJI
📌 The above content is for reference only and does not constitute investment advice
3 four-hour bearish alerts: $SKHYNIX / $CSOPSKHYNIX2L / $ZHONGJI
📉 $SKHYNIX | 4-hour bearish signal
━━━━━━━━━━━━━━━━━━
Technical analysis: ADX(28) Trend is forming; opportunity to participate | MACD is bearish, trend is weak, momentum is increasing | EMA5 < EMA8 < EMA13, bearish alignment | Volume increased (1.8x)
Price change: -0.2800%
📉 $CSOPSKHYNIX2L | 4-hour bearish signal
━━━━━━━━━━━━━━━━━━
Technical analysis: ADX(29) Trend is forming; opportunity to participate | MACD DIF fell below the zero line; trend turned bearish | EMA5 < EMA8 < EMA13, bearish alignment | Volume increased (1.7x)
Price change: -1.4100%
📉 $ZHONGJI | 4-hour bearish signal
━━━━━━━━━━━━━━━━━━
Technical analysis: ADX(35) Clear trending market | MACD DIF fell below the zero line; trend turned bearish | EMA5 < EMA8 < EMA13, bearish alignment | KDJ is trending weakly, with bears in control (K is 27.4, D is 46.3) | Volume surged (2.9x)
Price change: -3.9300%
━━━━━━━━━━━━━━━━━━
#技术分析 #SKHYNIX #CSOPSKHYNIX2L #ZHONGJI
📌 The above content is for reference only and does not constitute investment advice
📉 $SKHYNIX | 4-hour bearish signal
━━━━━━━━━━━━━━━━━━
Technical analysis: ADX(28) Trend is forming; opportunity to participate | MACD is bearish, trend is weak, momentum is increasing | EMA5 < EMA8 < EMA13, bearish alignment | Volume increased (1.8x)
Price change: -0.2800%
📉 $CSOPSKHYNIX2L | 4-hour bearish signal
━━━━━━━━━━━━━━━━━━
Technical analysis: ADX(29) Trend is forming; opportunity to participate | MACD DIF fell below the zero line; trend turned bearish | EMA5 < EMA8 < EMA13, bearish alignment | Volume increased (1.7x)
Price change: -1.4100%
📉 $ZHONGJI | 4-hour bearish signal
━━━━━━━━━━━━━━━━━━
Technical analysis: ADX(35) Clear trending market | MACD DIF fell below the zero line; trend turned bearish | EMA5 < EMA8 < EMA13, bearish alignment | KDJ is trending weakly, with bears in control (K is 27.4, D is 46.3) | Volume surged (2.9x)
Price change: -3.9300%
━━━━━━━━━━━━━━━━━━
#技术分析 #SKHYNIX #CSOPSKHYNIX2L #ZHONGJI
📌 The above content is for reference only and does not constitute investment advice
15
·
--
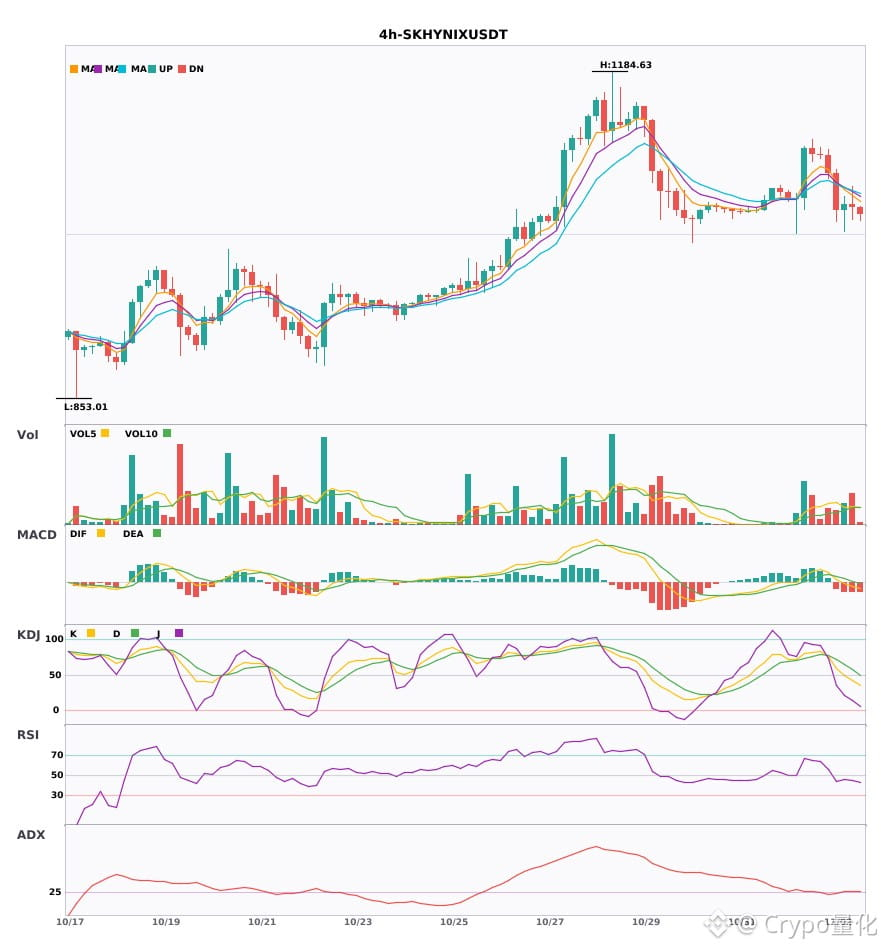
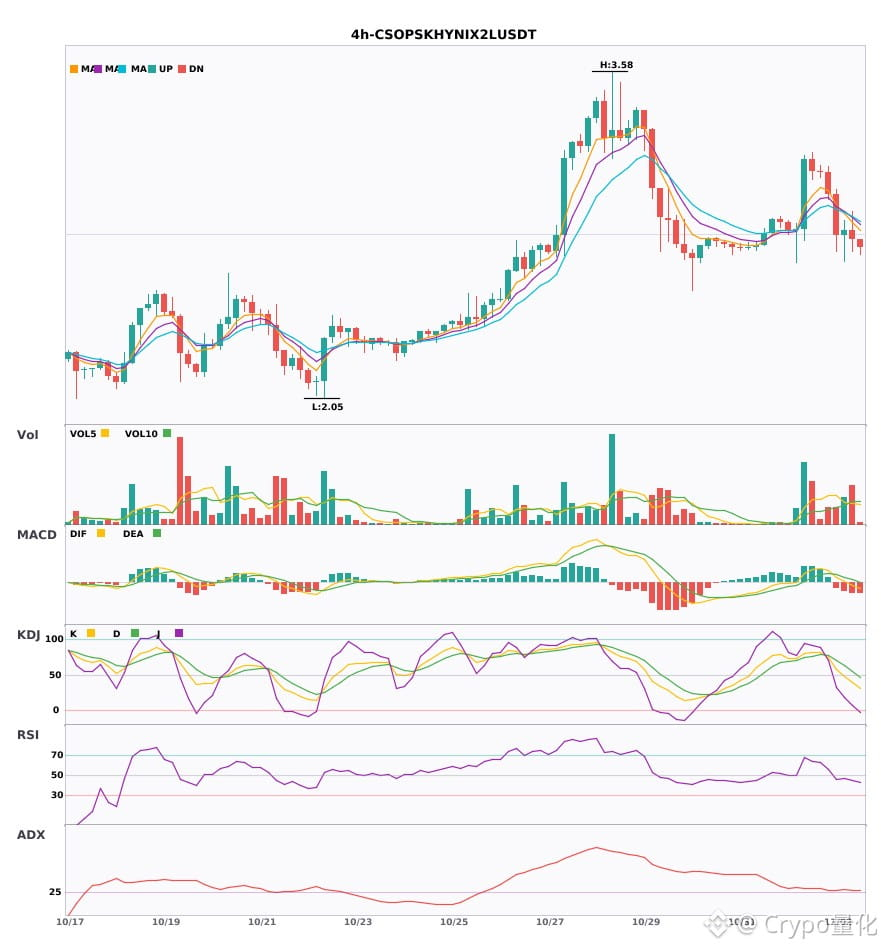
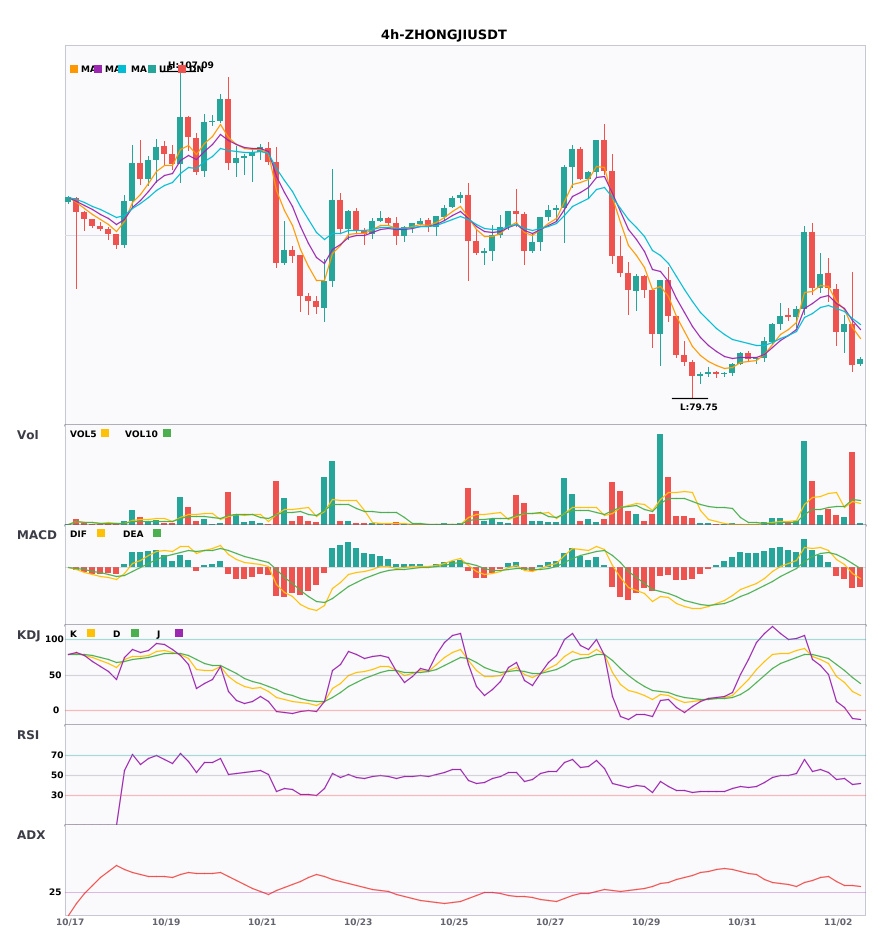
$SKHYNIX / $CSOPSKHYNIX2L / $ZHONGJI 4-hour convergence turns bearish, with bearish signals appearing simultaneously 🔥
════════════════════
🟢 $SKHYNIX 4-hour bearish signal
⚠️Technical analysis: ADX(28) Trend is forming; opportunity to participate | MACD is bearish, the trend is weak, and momentum is strengthening | EMA5 < EMA8 < EMA13, bearish alignment | Volume increased (1.8x)
════════════════════
🟢 $CSOPSKHYNIX2L 4-hour bearish signal
⚠️Technical analysis: ADX(29) Trend is forming; opportunity to participate | MACD DIF fell below zero, signaling a bearish trend reversal | EMA5 < EMA8 < EMA13, bearish alignment | Volume increased (1.7x)
════════════════════
🟢 $ZHONGJI 4-hour bearish signal
⚠️Technical analysis: ADX(35) Clear trending market | MACD DIF fell below zero, signaling a bearish trend reversal | EMA5 < EMA8 < EMA13, bearish alignment | KDJ is trending weakly, with bears in control (K: 27.4, D: 46.3) | Volume surged (2.9x)
════════════════════
🔔 Follow for the latest market movements 🔔
#技术分析 #SKHYNIX #CSOPSKHYNIX2L #ZHONGJI
📌 When trading, pay attention to whether the candlestick pattern meets expectations
$SKHYNIX / $CSOPSKHYNIX2L / $ZHONGJI 4-hour convergence turns bearish, with bearish signals appearing simultaneously 🔥
════════════════════
🟢 $SKHYNIX 4-hour bearish signal
⚠️Technical analysis: ADX(28) Trend is forming; opportunity to participate | MACD is bearish, the trend is weak, and momentum is strengthening | EMA5 < EMA8 < EMA13, bearish alignment | Volume increased (1.8x)
════════════════════
🟢 $CSOPSKHYNIX2L 4-hour bearish signal
⚠️Technical analysis: ADX(29) Trend is forming; opportunity to participate | MACD DIF fell below zero, signaling a bearish trend reversal | EMA5 < EMA8 < EMA13, bearish alignment | Volume increased (1.7x)
════════════════════
🟢 $ZHONGJI 4-hour bearish signal
⚠️Technical analysis: ADX(35) Clear trending market | MACD DIF fell below zero, signaling a bearish trend reversal | EMA5 < EMA8 < EMA13, bearish alignment | KDJ is trending weakly, with bears in control (K: 27.4, D: 46.3) | Volume surged (2.9x)
════════════════════
🔔 Follow for the latest market movements 🔔
#技术分析 #SKHYNIX #CSOPSKHYNIX2L #ZHONGJI
📌 When trading, pay attention to whether the candlestick pattern meets expectations
════════════════════
🟢 $SKHYNIX 4-hour bearish signal
⚠️Technical analysis: ADX(28) Trend is forming; opportunity to participate | MACD is bearish, the trend is weak, and momentum is strengthening | EMA5 < EMA8 < EMA13, bearish alignment | Volume increased (1.8x)
════════════════════
🟢 $CSOPSKHYNIX2L 4-hour bearish signal
⚠️Technical analysis: ADX(29) Trend is forming; opportunity to participate | MACD DIF fell below zero, signaling a bearish trend reversal | EMA5 < EMA8 < EMA13, bearish alignment | Volume increased (1.7x)
════════════════════
🟢 $ZHONGJI 4-hour bearish signal
⚠️Technical analysis: ADX(35) Clear trending market | MACD DIF fell below zero, signaling a bearish trend reversal | EMA5 < EMA8 < EMA13, bearish alignment | KDJ is trending weakly, with bears in control (K: 27.4, D: 46.3) | Volume surged (2.9x)
════════════════════
🔔 Follow for the latest market movements 🔔
#技术分析 #SKHYNIX #CSOPSKHYNIX2L #ZHONGJI
📌 When trading, pay attention to whether the candlestick pattern meets expectations
16
Log in to explore more content
Join global crypto users on Binance Square
⚡️ Get latest and useful information about crypto.
💬 Trusted by the world’s largest crypto exchange.
👍 Discover real insights from verified creators.
Email / Phone number
Trending Topics
1
#HuangExitNvidiaStrategyInFocus
27,977 views
585 Discussing
2
#AnthropicRejectsIPODelayValuationinQuestion
594,998 views
4,920 Discussing
3
#BitMineReports$6.3BNetLossForFiscal2026
3,407 views
77 Discussing
4
#ChipStocksExtendLossesAfterNvidiaCEOChange
10,061 views
286 Discussing
5
#ThailandProposes$148KDailyStablecoinDepositWithdrawalCaps
688 views
17 Discussing
6
#CoreWeaveJumps10%On168%RevenueGrowth
135,445 views
1,522 Discussing
7
#ZcashFallsBelow$1000ForFirstTimeSinceSeptember
68,804 views
252 Discussing
8
#MSCIRemovalMayCurbStrategy’sBitcoinBuying
30,860 views
492 Discussing
9
#TradFiForBeginners
505,493 views
3,548 Discussing
10
#USJoblessClaimsRise
19.1M views
7,681 Discussing