
#cryptojourneyvn
cryptojourneyvn
91 views
2 Discussing
Hot
Latest

📊 #BLESSUSDT – IS THE RECOVERY CONTINUING?
Today, CryptoJourneyVN takes a look at BLESSUSDT across four timeframes: 1D – 4H – 1H – 15M.
🔎 1. 1D timeframe – The bigger picture
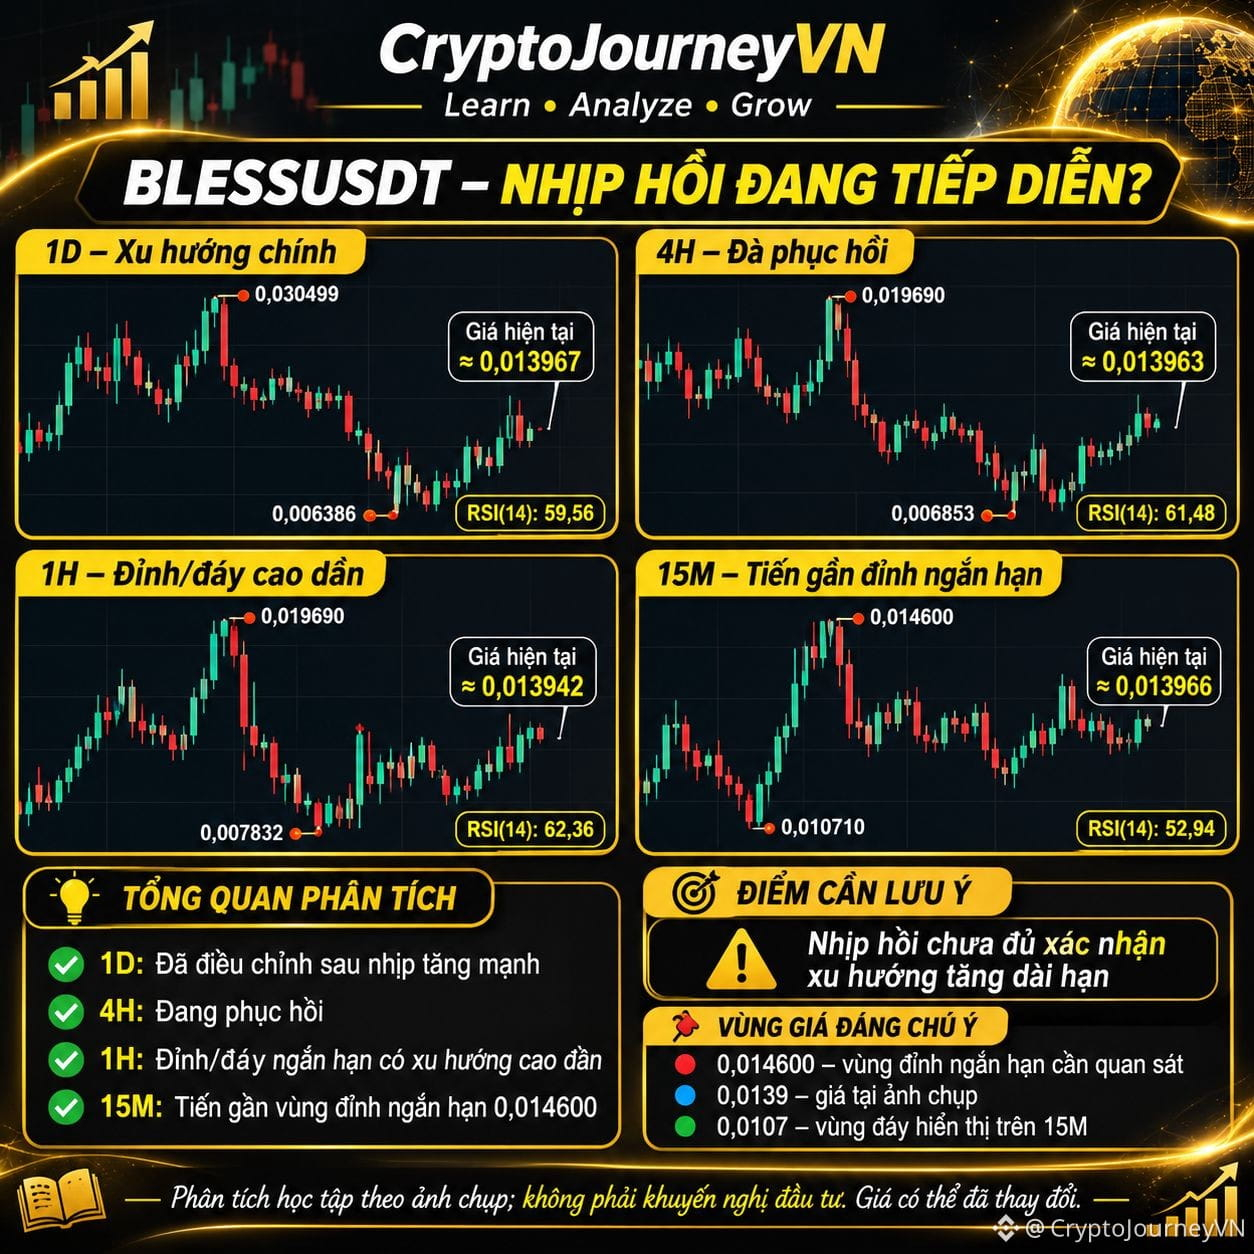
The price saw a strong upward move, followed by a correction, and is now recovering.
RSI(14): 59,56.
🔎 2. 4H timeframe – Recovery momentum
The price is recovering from a previous low.
RSI(14): 61,48.
🔎 3. 1H timeframe – Short-term structure
Recent highs and lows are trending higher. This is a positive sign to keep monitoring.
RSI(14): 62,36.
🔎 4. 15M timeframe – Price area to watch
The price is approaching the 0,014600 area, where a short-term high appeared on the chart.
RSI(14): 52,94.
📍 Key price levels:
- 0,014600: A short-term high to watch.
- 0,013900: The price area at the time of the snapshot.
- 0,010700: The low shown on the 15M timeframe.
💡 CryptoJourneyVN's perspective:
A recovery signal on a lower timeframe does not mean the long-term trend has reversed.
Watch the price reaction at resistance and for confirmation from the market structure.
❓ Do you think #BLESS has enough strength to break through the 0,014600 area?
🌱 Learn • Analyze • Grow
This content is for research and educational purposes only and is not investment advice.
#BLESS #BLESSUSDT #CryptoJourneyVN #PriceAction #CryptoAnalysis
📊 #BLESSUSDT – IS THE RECOVERY CONTINUING?
Today, CryptoJourneyVN takes a look at BLESSUSDT across four timeframes: 1D – 4H – 1H – 15M.
🔎 1. 1D timeframe – The bigger picture
The price saw a strong upward move, followed by a correction, and is now recovering.
RSI(14): 59,56.
🔎 2. 4H timeframe – Recovery momentum
The price is recovering from a previous low.
RSI(14): 61,48.
🔎 3. 1H timeframe – Short-term structure
Recent highs and lows are trending higher. This is a positive sign to keep monitoring.
RSI(14): 62,36.
🔎 4. 15M timeframe – Price area to watch
The price is approaching the 0,014600 area, where a short-term high appeared on the chart.
RSI(14): 52,94.
📍 Key price levels:
- 0,014600: A short-term high to watch.
- 0,013900: The price area at the time of the snapshot.
- 0,010700: The low shown on the 15M timeframe.
💡 CryptoJourneyVN's perspective:
A recovery signal on a lower timeframe does not mean the long-term trend has reversed.
Watch the price reaction at resistance and for confirmation from the market structure.
❓ Do you think #BLESS has enough strength to break through the 0,014600 area?
🌱 Learn • Analyze • Grow
This content is for research and educational purposes only and is not investment advice.
#BLESS #BLESSUSDT #CryptoJourneyVN #PriceAction #CryptoAnalysis
Today, CryptoJourneyVN takes a look at BLESSUSDT across four timeframes: 1D – 4H – 1H – 15M.
🔎 1. 1D timeframe – The bigger picture
The price saw a strong upward move, followed by a correction, and is now recovering.
RSI(14): 59,56.
🔎 2. 4H timeframe – Recovery momentum
The price is recovering from a previous low.
RSI(14): 61,48.
🔎 3. 1H timeframe – Short-term structure
Recent highs and lows are trending higher. This is a positive sign to keep monitoring.
RSI(14): 62,36.
🔎 4. 15M timeframe – Price area to watch
The price is approaching the 0,014600 area, where a short-term high appeared on the chart.
RSI(14): 52,94.
📍 Key price levels:
- 0,014600: A short-term high to watch.
- 0,013900: The price area at the time of the snapshot.
- 0,010700: The low shown on the 15M timeframe.
💡 CryptoJourneyVN's perspective:
A recovery signal on a lower timeframe does not mean the long-term trend has reversed.
Watch the price reaction at resistance and for confirmation from the market structure.
❓ Do you think #BLESS has enough strength to break through the 0,014600 area?
🌱 Learn • Analyze • Grow
This content is for research and educational purposes only and is not investment advice.
#BLESS #BLESSUSDT #CryptoJourneyVN #PriceAction #CryptoAnalysis
338
Log in to explore more content
Join global crypto users on Binance Square
⚡️ Get latest and useful information about crypto.
💬 Trusted by the world’s largest crypto exchange.
👍 Discover real insights from verified creators.
Email / Phone number
Trending Topics
1
#CanBTCReboundAfterFallingBelow60K?
408,703 views
1,764 Discussing
2
#GlobalStocksFaceLongestLosingStreakSince2023
138,776 views
1,235 Discussing
3
#BlackRockIBITPostsRecord$541MSingleDayOutflow
2,552 views
35 Discussing
4
#AnthropicPlungesTowardIPOPriceonDay2
65,962 views
686 Discussing
5
#TwentyOneCapitalAdds172.25BTC
17,923 views
233 Discussing
6
#HKBillWouldExcludeTokenizedDepositsFromVirtualAssets
2,016 views
25 Discussing
7
#BNBDropsBelow540USDTWith8.46%DailyDecline
38,365 views
336 Discussing
8
#HKBillProposesHK$100KFineForUnauthorizedCryptoTitles
1,225 views
19 Discussing
9
#BitMineFaces$10.1BUnrealizedETHLoss
2,315 views
23 Discussing
10
#StrategyReports$35BNetReserves
2,225 views
18 Discussing