
#btceducation
btceducation
79 views
8 Discussing
Hot
Latest

·
--
Article
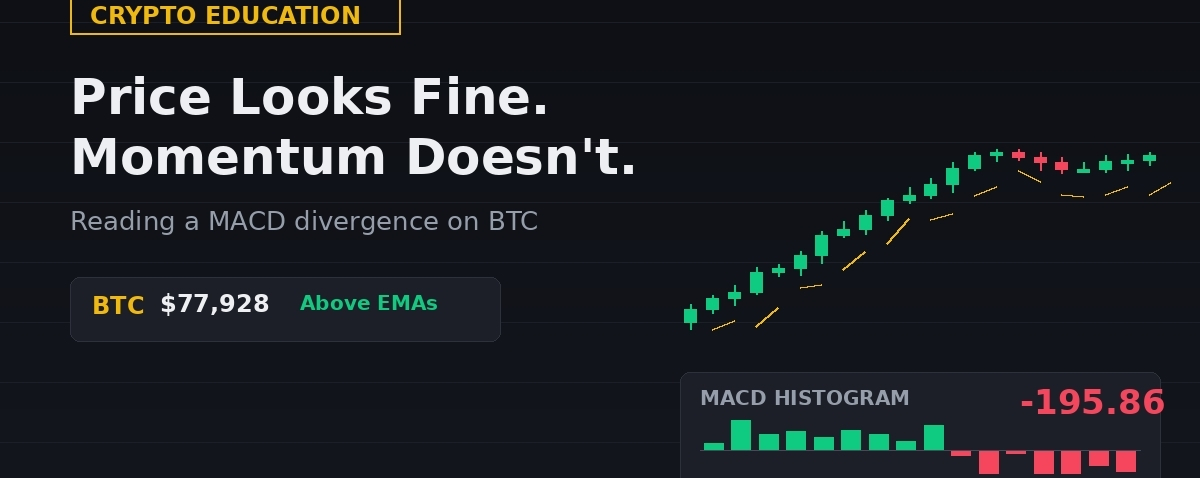
📘 When Price Looks Fine But Momentum Doesn't: Reading a MACD DivergenceBTC is sitting around $77.9K today, still holding above its 20, 50, and 200-day moving averages — technically, that's a clean bullish structure. But look one layer deeper and the MACD histogram just flipped negative. Here's why that gap between "price" and "momentum" matters:
1. Price and momentum are two different questions
Price tells you where the market is. Momentum (MACD) tells you how hard it's still pushing to get there. Right now BTC is above every major moving average — which is bullish on paper — but the MACD turning negative means the buying pressure behind that structure is fading, not accelerating.
2. This is a "stall," not a reversal — yet
A negative MACD doesn't mean price is about to crash. It means the rally that took BTC from the low $60Ks to above $80K in August is losing steam. Bitcoin dominance actually climbed as total market cap slipped, suggesting money is rotating defensively into BTC rather than fleeing crypto altogether — that's consolidation behavior, not panic.
3. Layer on the macro noise
This stall isn't happening in a vacuum — Fed rate-hike odds are sitting near 62-66% for the September meeting, and fresh U.S. strikes on Iran pushed oil above $96, adding inflation-risk noise to an already cautious market. Momentum indicators tend to cool exactly when this many crosscurrents are in play.
The takeaway: Don't just check if price is above your moving averages — check whether momentum agrees. When they disagree, it's usually a signal to expect chop, not to assume trend continuation or reversal.
Not financial advice — just how divergences get read. 📊
Are you watching MACD, or do you have a different momentum indicator you trust more? 👇
#BTC #BTCEducation
📘 When Price Looks Fine But Momentum Doesn't: Reading a MACD Divergence
BTC is sitting around $77.9K today, still holding above its 20, 50, and 200-day moving averages — technically, that's a clean bullish structure. But look one layer deeper and the MACD histogram just flipped negative. Here's why that gap between "price" and "momentum" matters:
1. Price and momentum are two different questions
Price tells you where the market is. Momentum (MACD) tells you how hard it's still pushing to get there. Right now BTC is above every major moving average — which is bullish on paper — but the MACD turning negative means the buying pressure behind that structure is fading, not accelerating.
2. This is a "stall," not a reversal — yet
A negative MACD doesn't mean price is about to crash. It means the rally that took BTC from the low $60Ks to above $80K in August is losing steam. Bitcoin dominance actually climbed as total market cap slipped, suggesting money is rotating defensively into BTC rather than fleeing crypto altogether — that's consolidation behavior, not panic.
3. Layer on the macro noise
This stall isn't happening in a vacuum — Fed rate-hike odds are sitting near 62-66% for the September meeting, and fresh U.S. strikes on Iran pushed oil above $96, adding inflation-risk noise to an already cautious market. Momentum indicators tend to cool exactly when this many crosscurrents are in play.
The takeaway: Don't just check if price is above your moving averages — check whether momentum agrees. When they disagree, it's usually a signal to expect chop, not to assume trend continuation or reversal.
Not financial advice — just how divergences get read. 📊
Are you watching MACD, or do you have a different momentum indicator you trust more? 👇
#BTC #BTCEducation
1. Price and momentum are two different questions
Price tells you where the market is. Momentum (MACD) tells you how hard it's still pushing to get there. Right now BTC is above every major moving average — which is bullish on paper — but the MACD turning negative means the buying pressure behind that structure is fading, not accelerating.
2. This is a "stall," not a reversal — yet
A negative MACD doesn't mean price is about to crash. It means the rally that took BTC from the low $60Ks to above $80K in August is losing steam. Bitcoin dominance actually climbed as total market cap slipped, suggesting money is rotating defensively into BTC rather than fleeing crypto altogether — that's consolidation behavior, not panic.
3. Layer on the macro noise
This stall isn't happening in a vacuum — Fed rate-hike odds are sitting near 62-66% for the September meeting, and fresh U.S. strikes on Iran pushed oil above $96, adding inflation-risk noise to an already cautious market. Momentum indicators tend to cool exactly when this many crosscurrents are in play.
The takeaway: Don't just check if price is above your moving averages — check whether momentum agrees. When they disagree, it's usually a signal to expect chop, not to assume trend continuation or reversal.
Not financial advice — just how divergences get read. 📊
Are you watching MACD, or do you have a different momentum indicator you trust more? 👇
#BTC #BTCEducation
74

Article
Bitcoin: The Digital Gold in Global UncertaintyIn the last few years, Bitcoin (BTC) has faced many challenges. From economic shifts to global conflicts, the world's largest cryptocurrency has shown incredible strength. Today, traders don't just see it as a digital coin; they see it as "Digital Gold."
How War and Geopolitics Affect BTC
When wars or geopolitical tensions start, investors usually get scared. This leads to a "Panic Sell," where the price drops quickly. However, recent events have shown a new trend:
The Initial Drop: BTC often falls 5-10% as people move money to cash.The Safe Haven Recovery: Once the initial shock passes, people buy Bitcoin to protect their wealth from falling local currencies and inflation.The Ceasefire Effect: News of peace or ceasefires usually acts as a "Green Signal" for the market, pushing BTC toward new highs, like we are seeing now near the $80,000 mark.
Current Market Outlook (April 2026)
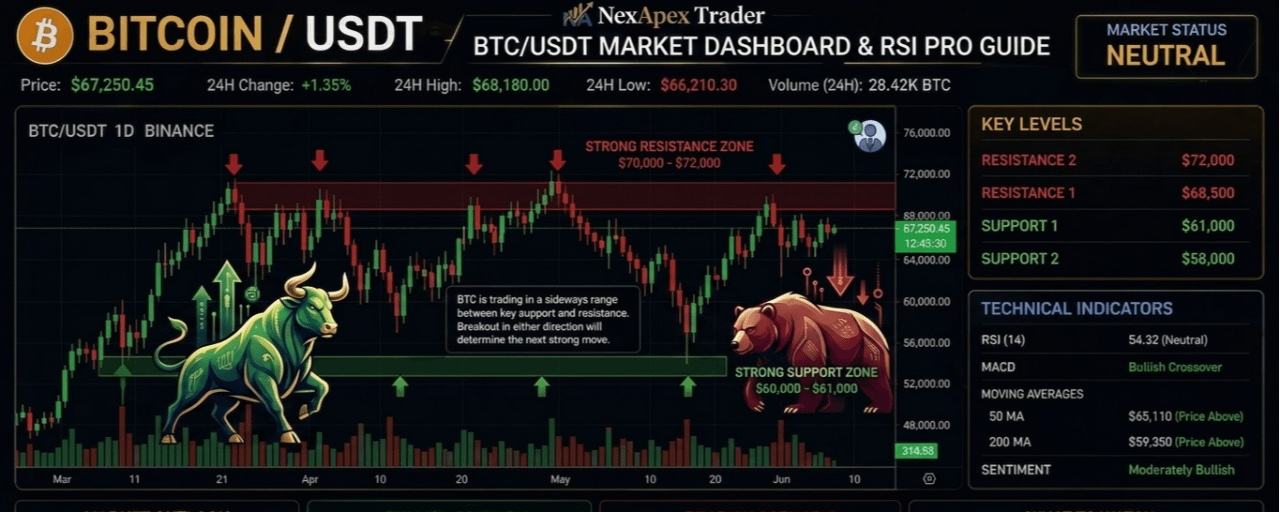
The market is currently in a "Decision Phase." While the tension is high, institutional money (Big Banks and ETFs) is flowing into Bitcoin. This support is keeping the price stable above $75,000.
Pro Tips for Traders
Don't Panic: Emotional selling during war news often leads to losses.Watch the Support: Keep an eye on the $77,000 level. As long as BTC stays above this, the trend is Bullish.Stay Updated: Follow reliable sources like Binance Convert data for real-time price trends.
Conclusion
Bitcoin is proving to be a resilient asset. Whether in times of war or peace, its limited supply and global nature make it a powerful tool for every trader. At NexApex Trader, we believe that understanding these global connections is the key to smart trading.
#CryptoEducation💡🚀 #BTCEducation #NexApexTrader $BTC
Bitcoin: The Digital Gold in Global Uncertainty
In the last few years, Bitcoin (BTC) has faced many challenges. From economic shifts to global conflicts, the world's largest cryptocurrency has shown incredible strength. Today, traders don't just see it as a digital coin; they see it as "Digital Gold."
How War and Geopolitics Affect BTC
When wars or geopolitical tensions start, investors usually get scared. This leads to a "Panic Sell," where the price drops quickly. However, recent events have shown a new trend:
The Initial Drop: BTC often falls 5-10% as people move money to cash.The Safe Haven Recovery: Once the initial shock passes, people buy Bitcoin to protect their wealth from falling local currencies and inflation.The Ceasefire Effect: News of peace or ceasefires usually acts as a "Green Signal" for the market, pushing BTC toward new highs, like we are seeing now near the $80,000 mark.
Current Market Outlook (April 2026)
The market is currently in a "Decision Phase." While the tension is high, institutional money (Big Banks and ETFs) is flowing into Bitcoin. This support is keeping the price stable above $75,000.
Pro Tips for Traders
Don't Panic: Emotional selling during war news often leads to losses.Watch the Support: Keep an eye on the $77,000 level. As long as BTC stays above this, the trend is Bullish.Stay Updated: Follow reliable sources like Binance Convert data for real-time price trends.
Conclusion
Bitcoin is proving to be a resilient asset. Whether in times of war or peace, its limited supply and global nature make it a powerful tool for every trader. At NexApex Trader, we believe that understanding these global connections is the key to smart trading.
#CryptoEducation💡🚀 #BTCEducation #NexApexTrader $BTC
How War and Geopolitics Affect BTC
When wars or geopolitical tensions start, investors usually get scared. This leads to a "Panic Sell," where the price drops quickly. However, recent events have shown a new trend:
The Initial Drop: BTC often falls 5-10% as people move money to cash.The Safe Haven Recovery: Once the initial shock passes, people buy Bitcoin to protect their wealth from falling local currencies and inflation.The Ceasefire Effect: News of peace or ceasefires usually acts as a "Green Signal" for the market, pushing BTC toward new highs, like we are seeing now near the $80,000 mark.
Current Market Outlook (April 2026)
The market is currently in a "Decision Phase." While the tension is high, institutional money (Big Banks and ETFs) is flowing into Bitcoin. This support is keeping the price stable above $75,000.
Pro Tips for Traders
Don't Panic: Emotional selling during war news often leads to losses.Watch the Support: Keep an eye on the $77,000 level. As long as BTC stays above this, the trend is Bullish.Stay Updated: Follow reliable sources like Binance Convert data for real-time price trends.
Conclusion
Bitcoin is proving to be a resilient asset. Whether in times of war or peace, its limited supply and global nature make it a powerful tool for every trader. At NexApex Trader, we believe that understanding these global connections is the key to smart trading.
#CryptoEducation💡🚀 #BTCEducation #NexApexTrader $BTC
73
Log in to explore more content
Join global crypto users on Binance Square
⚡️ Get latest and useful information about crypto.
💬 Trusted by the world’s largest crypto exchange.
👍 Discover real insights from verified creators.
Email / Phone number
Trending Topics
1
#ZECHitsANewAllTimeHigh
3,980 views
92 Discussing
2
#LululemonTumbles20%OnWeakGuidance
7,974 views
269 Discussing
3
#BitcoinETFsBiggestDailyInflowSinceJanuary
8,383 views
342 Discussing
4
#USAugustJobGrowthNearlyTriplesForecast
16,114 views
335 Discussing
5
#USAugustAvgHourlyEarningsRise3.1%
19,857 views
342 Discussing
6
#USAugustNonfarmPayrollsDueToday
22,780 views
386 Discussing
7
#BitcoinEthereumHitMultiMonthHighs
32,069 views
802 Discussing
8
#AdobeSharesFall3%OnCEOTransition
13,786 views
406 Discussing
9
#BTCTops$80K
108,939 views
537 Discussing
10
#USWeeklyInitialJoblessClaimsRiseTo206000
157,743 views
2,418 Discussing