
#bome
bome
81.3M views
45,048 Discussing
Hot
Latest

·
--
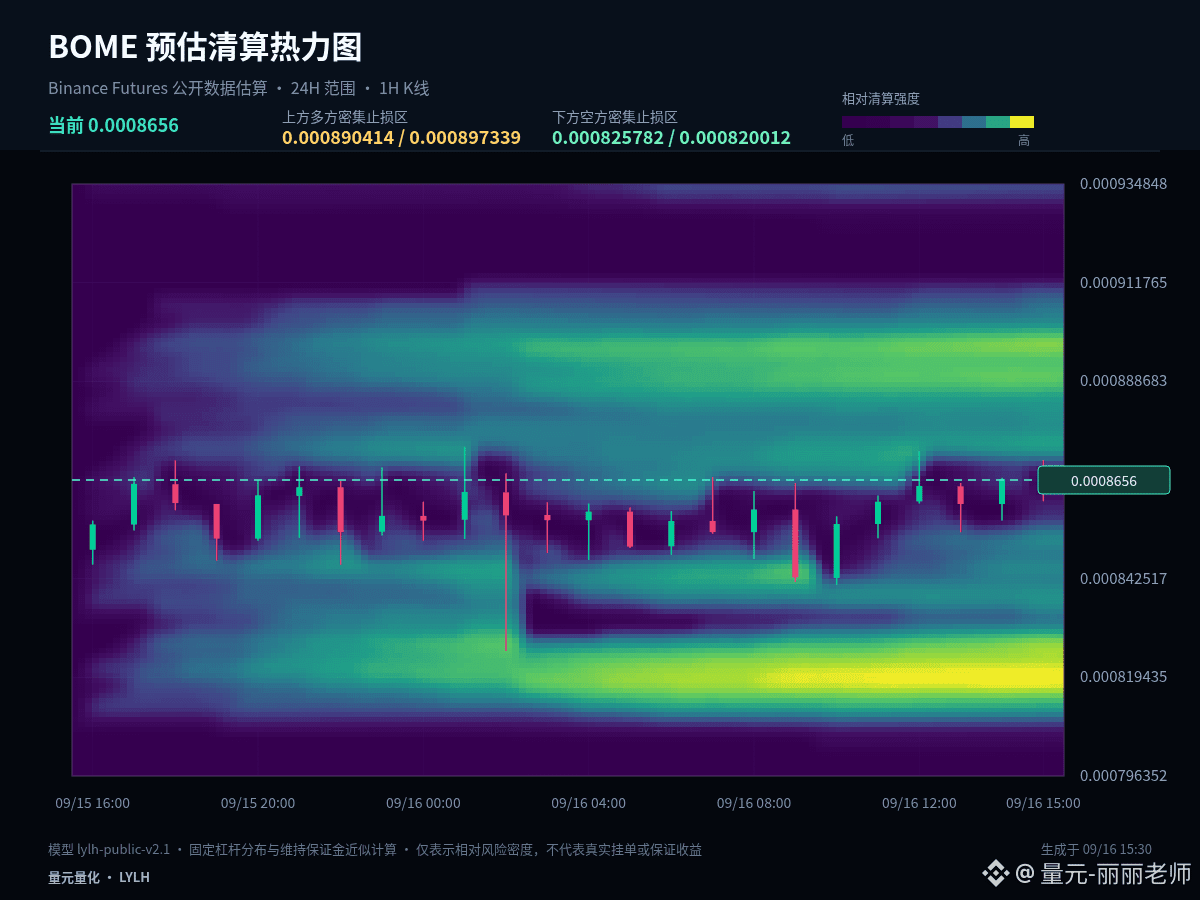
$BOME #BOME It’s currently more like range trading with turnover. There’s no need to explain every 1-hour candlestick as a brand-new trend. Current price: 0.0008669, +0.03% in 1 hour, +1.58% in 24 hours.
The current price is near the upper bound of the last 24-hour range: +0.03% in 1 hour and +1.58% in 24 hours. What matters most at the highs is confirmation of acceptance after a breakout: if price can stay above the upper band, it suggests the market recognizes a higher range; if it only briefly pierces and quickly snaps back, you need to guard against a false breakout.
Upper band: 0.0008739, lower band: 0.0008276, midline: 0.00085075. When near the upper band, watch the quality of the breakout; when near the lower band, watch for follow-through/support. Around the midline, reduce frequent trading, because it’s not far enough from either side—direction and risk/reward are not clear.
The real signals worth acting on are: after a boundary breakout, price is willing to remain in the new range; or after probing toward a boundary, price quickly recovers. Without this kind of confirmation, continue treating it as range movement, and don’t change the overall plan due to brief intraday fluctuations.
For those who already hold positions, the key is to manage based on whether support fails—not to get swept around by every fluctuation. For those with no position, prioritize waiting for a breakout retest or support confirmation. Spot trades can be entered in batches; for futures, shorten the decision chain: decide the stop-loss level first, then determine whether to participate.
Risk control should still come before the conclusion: execute only when conditions appear, and reassess immediately if the price fails. The larger the volatility, the more restrained each position should be. The above is scenario analysis based on current 1-hour and 24-hour data, and it does not constitute any promise of returns.
#ArgentinaCommitsToOECDCryptoReportingBy2029
$BOME #BOME It’s currently more like range trading with turnover. There’s no need to explain every 1-hour candlestick as a brand-new trend. Current price: 0.0008669, +0.03% in 1 hour, +1.58% in 24 hours.
The current price is near the upper bound of the last 24-hour range: +0.03% in 1 hour and +1.58% in 24 hours. What matters most at the highs is confirmation of acceptance after a breakout: if price can stay above the upper band, it suggests the market recognizes a higher range; if it only briefly pierces and quickly snaps back, you need to guard against a false breakout.
Upper band: 0.0008739, lower band: 0.0008276, midline: 0.00085075. When near the upper band, watch the quality of the breakout; when near the lower band, watch for follow-through/support. Around the midline, reduce frequent trading, because it’s not far enough from either side—direction and risk/reward are not clear.
The real signals worth acting on are: after a boundary breakout, price is willing to remain in the new range; or after probing toward a boundary, price quickly recovers. Without this kind of confirmation, continue treating it as range movement, and don’t change the overall plan due to brief intraday fluctuations.
For those who already hold positions, the key is to manage based on whether support fails—not to get swept around by every fluctuation. For those with no position, prioritize waiting for a breakout retest or support confirmation. Spot trades can be entered in batches; for futures, shorten the decision chain: decide the stop-loss level first, then determine whether to participate.
Risk control should still come before the conclusion: execute only when conditions appear, and reassess immediately if the price fails. The larger the volatility, the more restrained each position should be. The above is scenario analysis based on current 1-hour and 24-hour data, and it does not constitute any promise of returns.
#ArgentinaCommitsToOECDCryptoReportingBy2029
The current price is near the upper bound of the last 24-hour range: +0.03% in 1 hour and +1.58% in 24 hours. What matters most at the highs is confirmation of acceptance after a breakout: if price can stay above the upper band, it suggests the market recognizes a higher range; if it only briefly pierces and quickly snaps back, you need to guard against a false breakout.
Upper band: 0.0008739, lower band: 0.0008276, midline: 0.00085075. When near the upper band, watch the quality of the breakout; when near the lower band, watch for follow-through/support. Around the midline, reduce frequent trading, because it’s not far enough from either side—direction and risk/reward are not clear.
The real signals worth acting on are: after a boundary breakout, price is willing to remain in the new range; or after probing toward a boundary, price quickly recovers. Without this kind of confirmation, continue treating it as range movement, and don’t change the overall plan due to brief intraday fluctuations.
For those who already hold positions, the key is to manage based on whether support fails—not to get swept around by every fluctuation. For those with no position, prioritize waiting for a breakout retest or support confirmation. Spot trades can be entered in batches; for futures, shorten the decision chain: decide the stop-loss level first, then determine whether to participate.
Risk control should still come before the conclusion: execute only when conditions appear, and reassess immediately if the price fails. The larger the volatility, the more restrained each position should be. The above is scenario analysis based on current 1-hour and 24-hour data, and it does not constitute any promise of returns.
#ArgentinaCommitsToOECDCryptoReportingBy2029
8
·
--
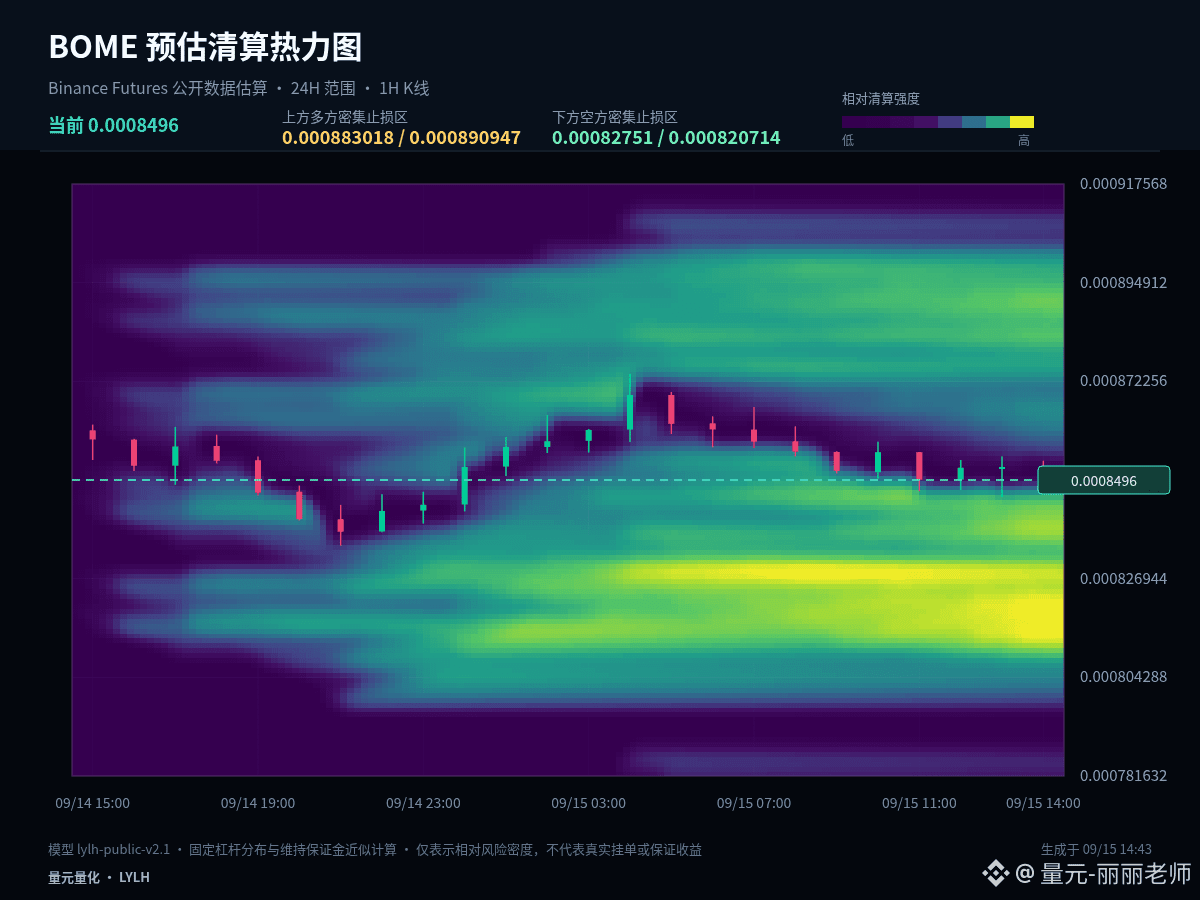
$BOME #BOME It’s currently more like range trading turnover, and there’s no need to interpret every 1-hour candlestick as a brand-new trend. Current price: 0.0008503; 1 hour: -0.43%; 24 hours: -1.65%.
At -0.43% over the past 1 hour and -1.65% over the past 24 hours, the two timeframes have not formed a sufficiently clear directional alignment. In a range market, the tolerance for chasing and selling is lower. It’s better to confirm direction using the upper boundary, confirm support/rejection using the lower boundary, and use the midline only as a strength/weakness dividing line.
Upper range: 0.0008746; lower range: 0.0008354; midline: 0.000855. When price is near the upper boundary, watch for the quality of the breakout. When near the lower boundary, watch for the strength of the pullback/rejection. Around the midline, reduce frequent trading there—because it’s not far enough from either side, neither direction nor the risk-reward ratio is clearly defined.
The signals truly worth acting on are: after breaking a boundary, the price is willing to stay inside the new range; or after dipping toward a boundary, it quickly pulls back. Without such confirmation, continue treating it as consolidation and don’t let brief intraday fluctuations change the overall plan.
For those with existing positions, the key is managing based on whether support has failed—not getting dragged around by every fluctuation. For those with no positions, prioritize waiting for a breakout and retest, or for confirmation of support. Spot can be scaled in batch by batch; for derivatives, shorten the decision chain: first determine the stop-loss level, then decide whether to participate.
Your trading plan must include invalidation conditions. Correct judgment can be realized in stages; if your judgment is wrong, you must also allow yourself to exit. Don’t use adding to positions to cover the fact that the original logic has changed. The market will update, and your view should adjust according to price evidence.
#SouthKoreaCryptoTaxDelayPetitionTops50000
$BOME #BOME It’s currently more like range trading turnover, and there’s no need to interpret every 1-hour candlestick as a brand-new trend. Current price: 0.0008503; 1 hour: -0.43%; 24 hours: -1.65%.
At -0.43% over the past 1 hour and -1.65% over the past 24 hours, the two timeframes have not formed a sufficiently clear directional alignment. In a range market, the tolerance for chasing and selling is lower. It’s better to confirm direction using the upper boundary, confirm support/rejection using the lower boundary, and use the midline only as a strength/weakness dividing line.
Upper range: 0.0008746; lower range: 0.0008354; midline: 0.000855. When price is near the upper boundary, watch for the quality of the breakout. When near the lower boundary, watch for the strength of the pullback/rejection. Around the midline, reduce frequent trading there—because it’s not far enough from either side, neither direction nor the risk-reward ratio is clearly defined.
The signals truly worth acting on are: after breaking a boundary, the price is willing to stay inside the new range; or after dipping toward a boundary, it quickly pulls back. Without such confirmation, continue treating it as consolidation and don’t let brief intraday fluctuations change the overall plan.
For those with existing positions, the key is managing based on whether support has failed—not getting dragged around by every fluctuation. For those with no positions, prioritize waiting for a breakout and retest, or for confirmation of support. Spot can be scaled in batch by batch; for derivatives, shorten the decision chain: first determine the stop-loss level, then decide whether to participate.
Your trading plan must include invalidation conditions. Correct judgment can be realized in stages; if your judgment is wrong, you must also allow yourself to exit. Don’t use adding to positions to cover the fact that the original logic has changed. The market will update, and your view should adjust according to price evidence.
#SouthKoreaCryptoTaxDelayPetitionTops50000
At -0.43% over the past 1 hour and -1.65% over the past 24 hours, the two timeframes have not formed a sufficiently clear directional alignment. In a range market, the tolerance for chasing and selling is lower. It’s better to confirm direction using the upper boundary, confirm support/rejection using the lower boundary, and use the midline only as a strength/weakness dividing line.
Upper range: 0.0008746; lower range: 0.0008354; midline: 0.000855. When price is near the upper boundary, watch for the quality of the breakout. When near the lower boundary, watch for the strength of the pullback/rejection. Around the midline, reduce frequent trading there—because it’s not far enough from either side, neither direction nor the risk-reward ratio is clearly defined.
The signals truly worth acting on are: after breaking a boundary, the price is willing to stay inside the new range; or after dipping toward a boundary, it quickly pulls back. Without such confirmation, continue treating it as consolidation and don’t let brief intraday fluctuations change the overall plan.
For those with existing positions, the key is managing based on whether support has failed—not getting dragged around by every fluctuation. For those with no positions, prioritize waiting for a breakout and retest, or for confirmation of support. Spot can be scaled in batch by batch; for derivatives, shorten the decision chain: first determine the stop-loss level, then decide whether to participate.
Your trading plan must include invalidation conditions. Correct judgment can be realized in stages; if your judgment is wrong, you must also allow yourself to exit. Don’t use adding to positions to cover the fact that the original logic has changed. The market will update, and your view should adjust according to price evidence.
#SouthKoreaCryptoTaxDelayPetitionTops50000
1
19

·
--
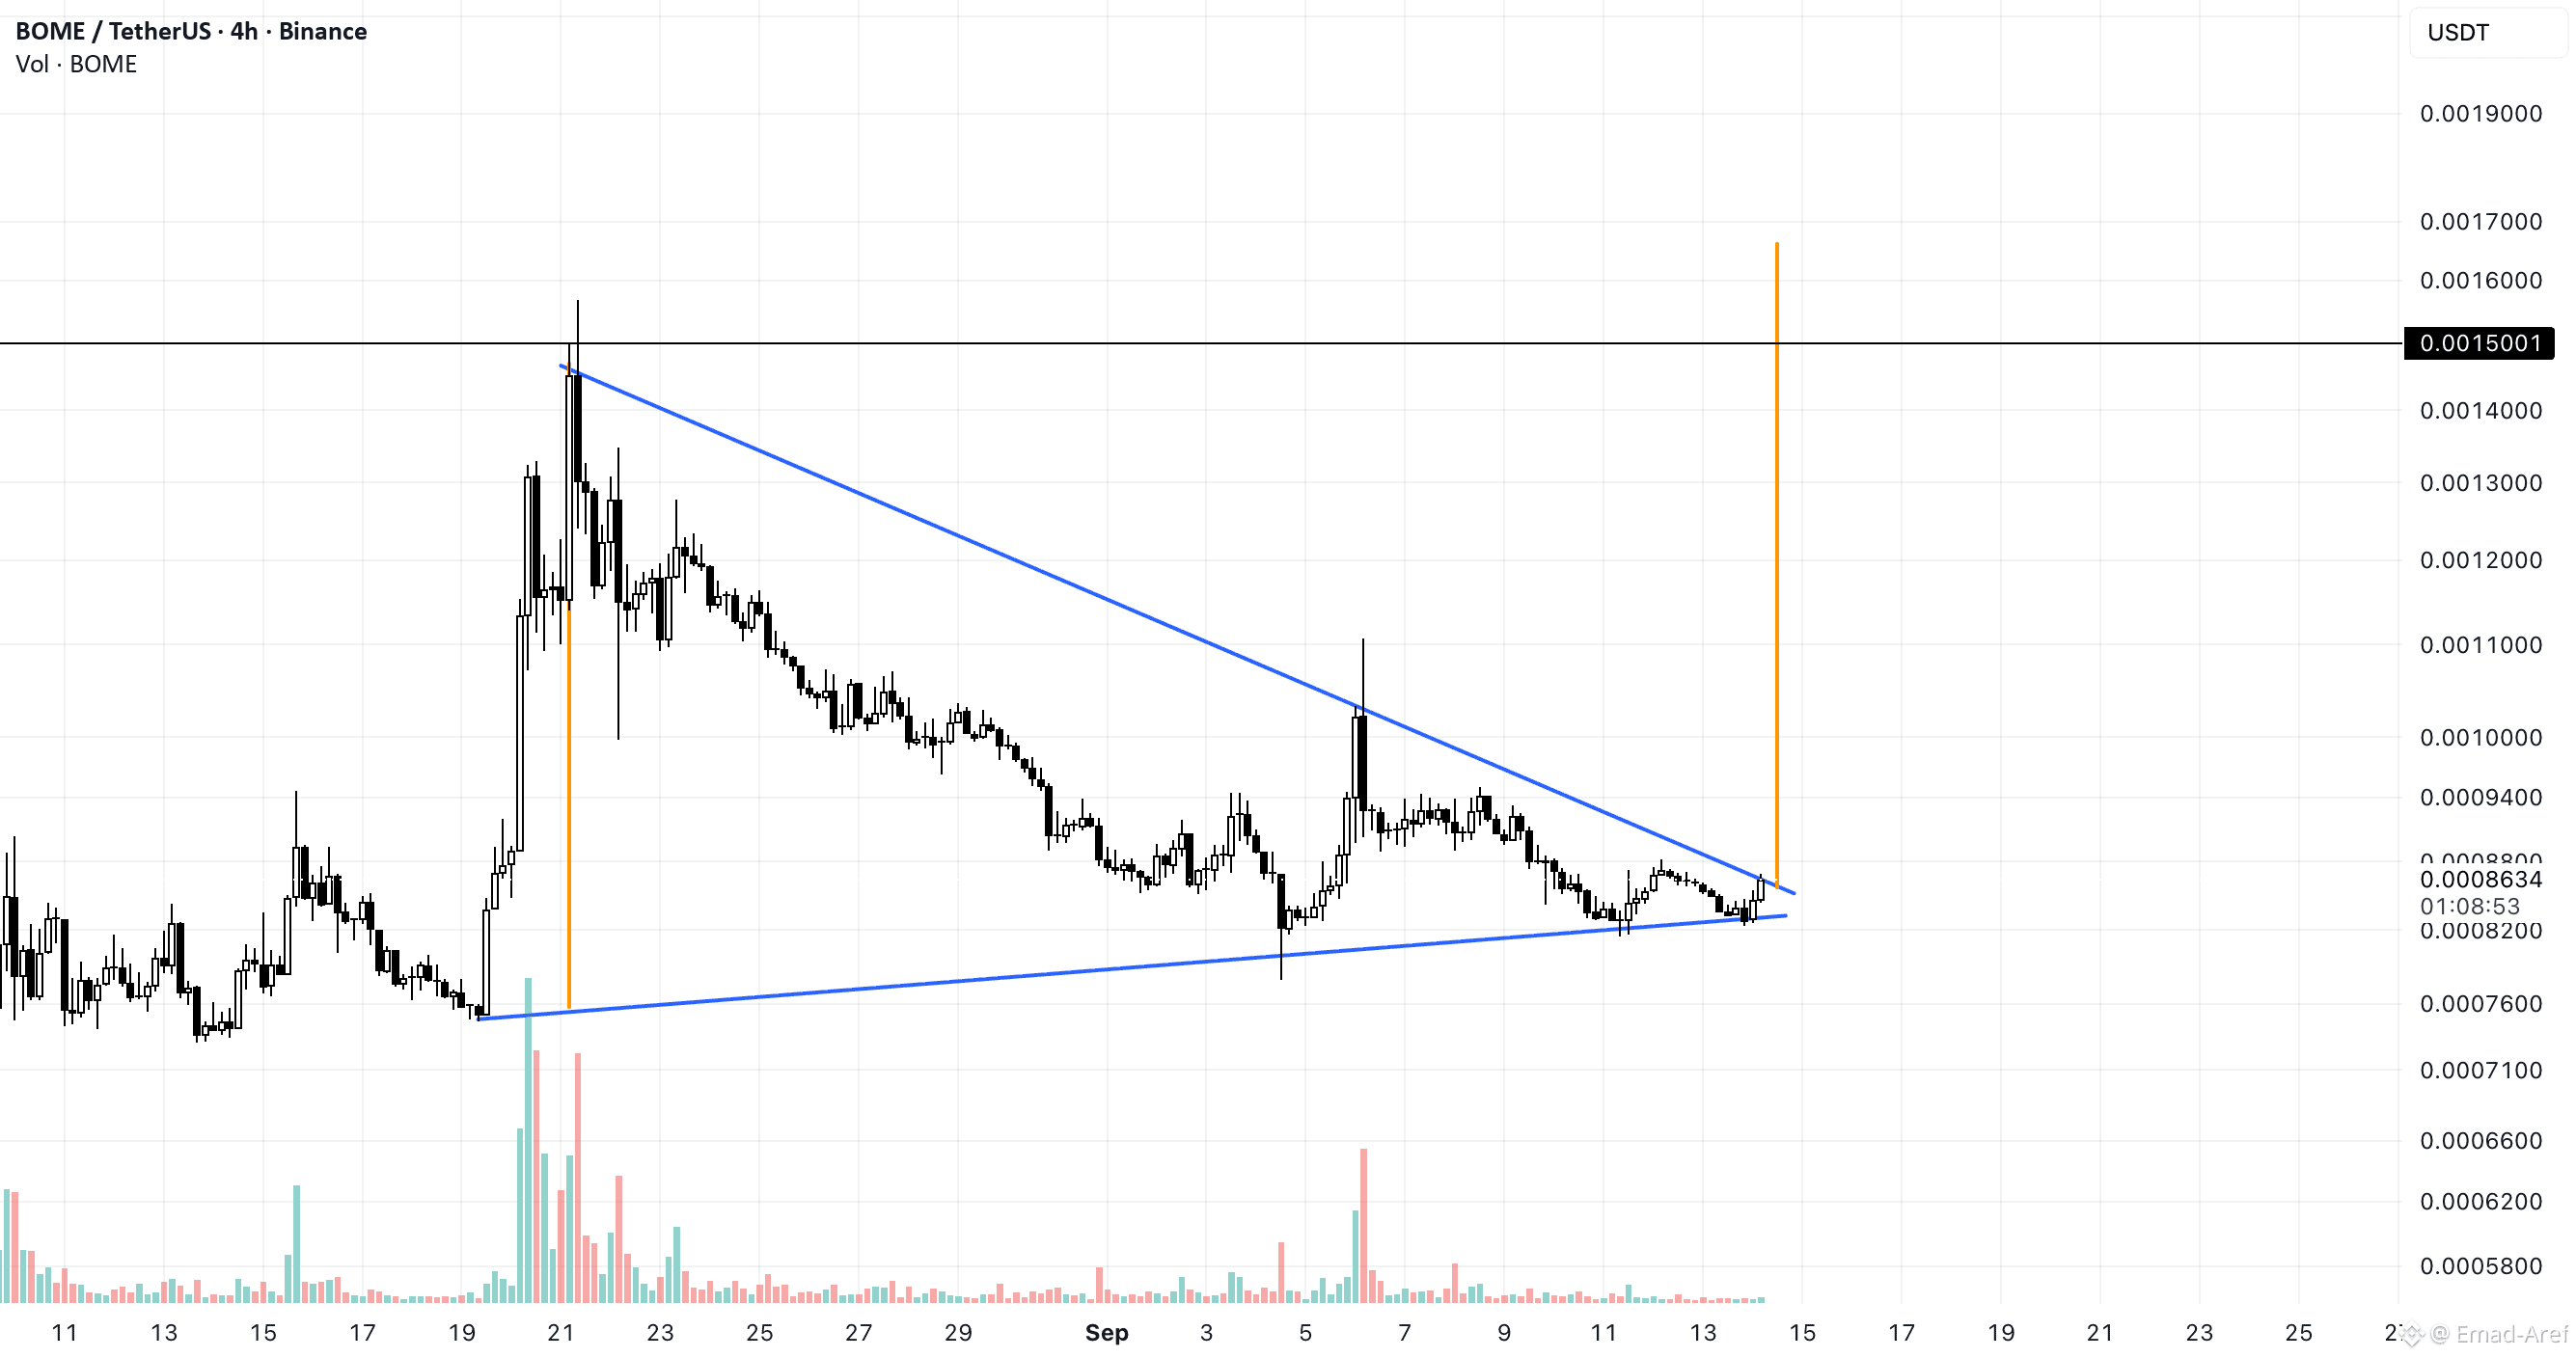
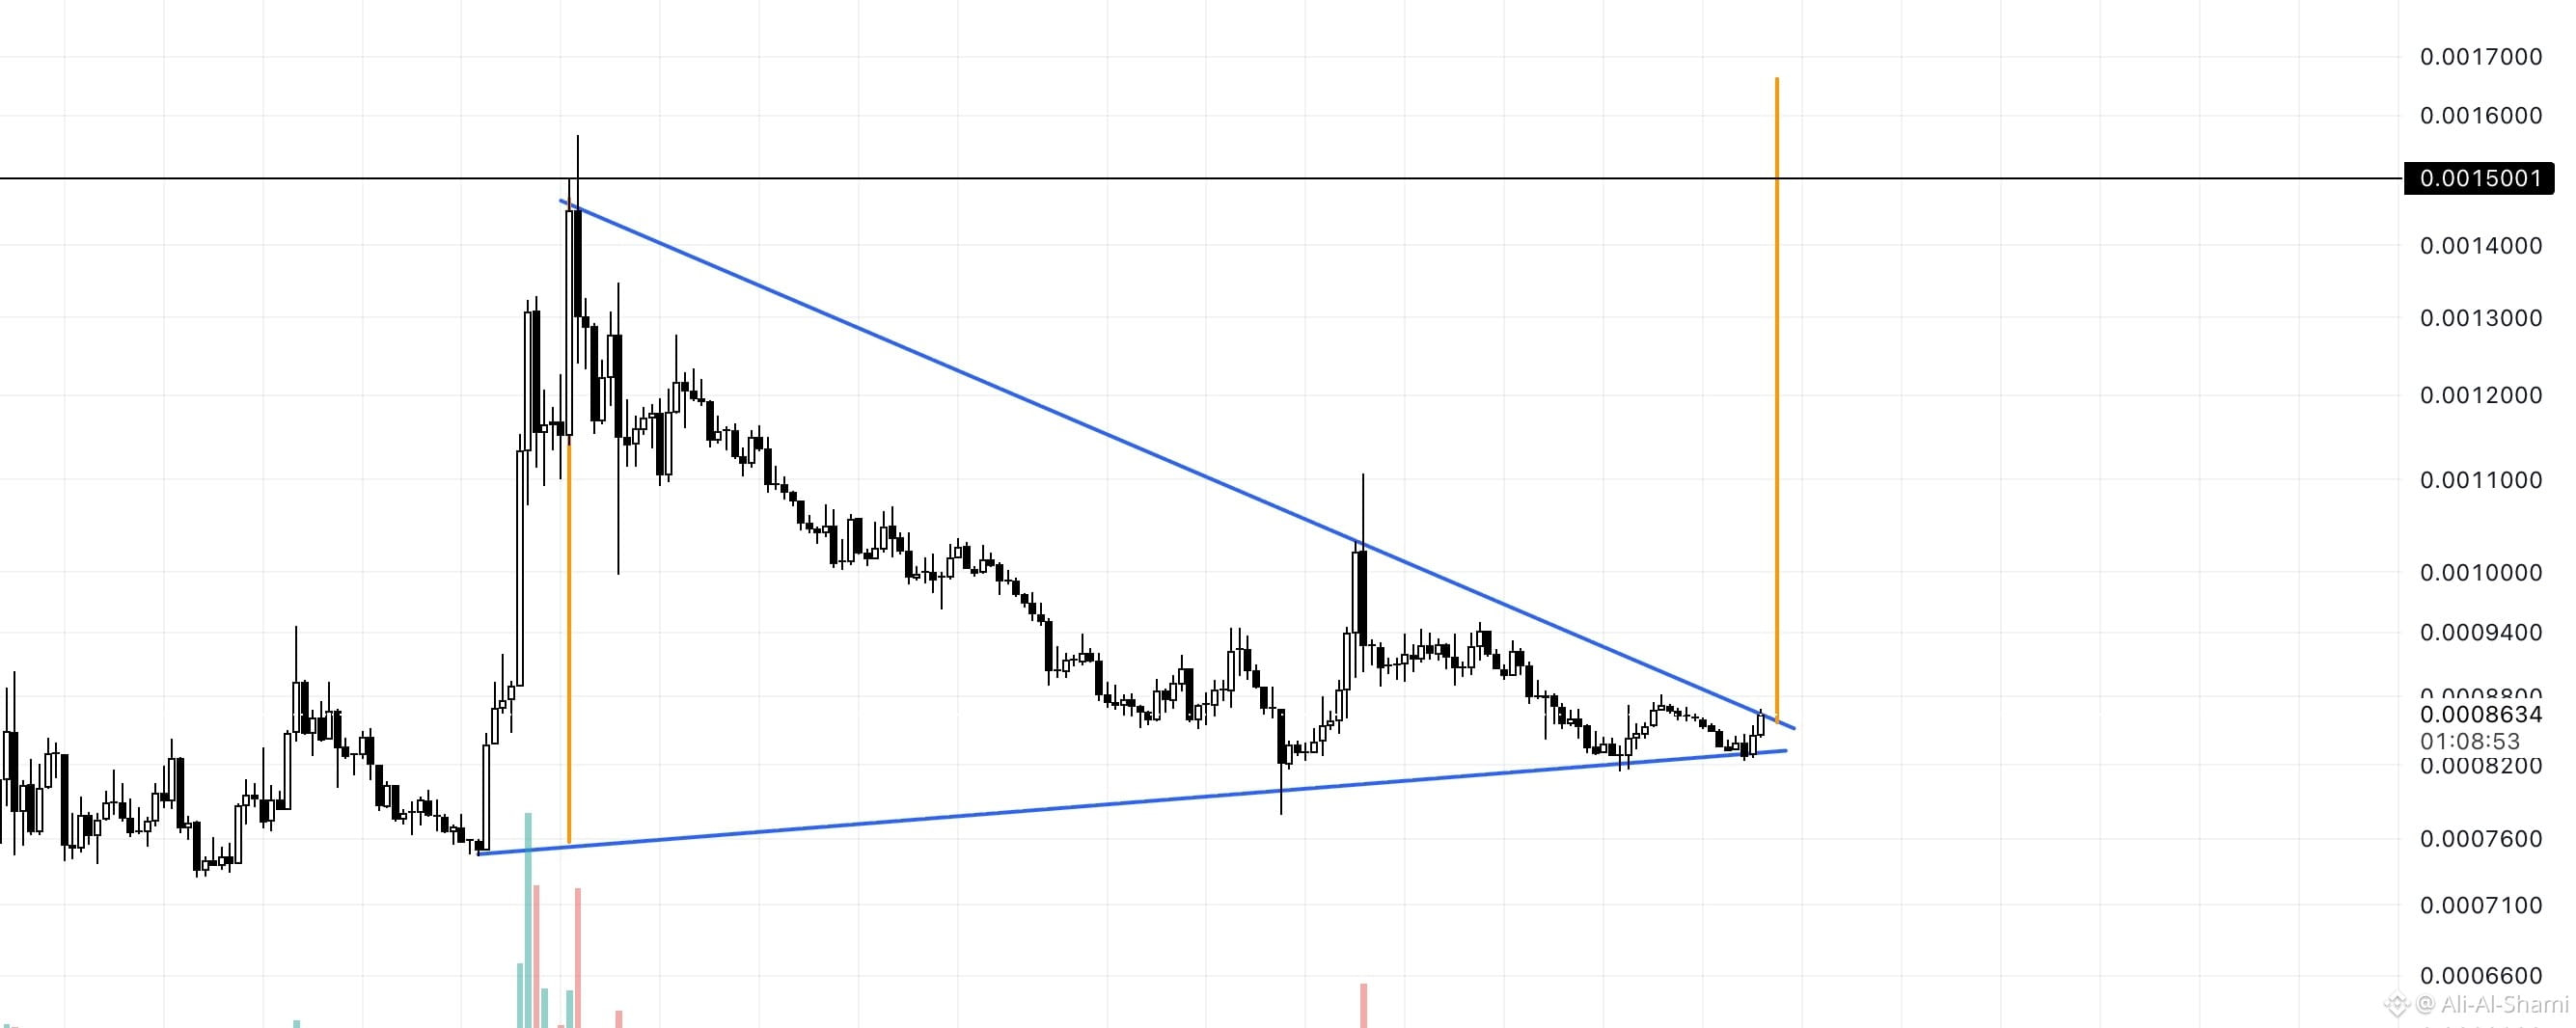
🔥 $BOME | Liquidity is concentrated at the apex of the triangle
Price compressing between $0.00085–$0.00087 indicates the price explosion is near; and a 4-hour candle breaking the upper side will activate targets $0.00150 and $0.00160.
Cancel the bullish setup will be realized immediately by closing below $0.00081 — avoid entering early and wait for confirmation of the breakdown with volume.
{future}(BOMEUSDT)
#BOME #Cryptocurrency #BinanceSquare #Trading
🔥 $BOME | Liquidity is concentrated at the apex of the triangle
Price compressing between $0.00085–$0.00087 indicates the price explosion is near; and a 4-hour candle breaking the upper side will activate targets $0.00150 and $0.00160.
Cancel the bullish setup will be realized immediately by closing below $0.00081 — avoid entering early and wait for confirmation of the breakdown with volume.
#BOME #Cryptocurrency #BinanceSquare #Trading
Price compressing between $0.00085–$0.00087 indicates the price explosion is near; and a 4-hour candle breaking the upper side will activate targets $0.00150 and $0.00160.
Cancel the bullish setup will be realized immediately by closing below $0.00081 — avoid entering early and wait for confirmation of the breakdown with volume.
#BOME #Cryptocurrency #BinanceSquare #Trading
118
·
--
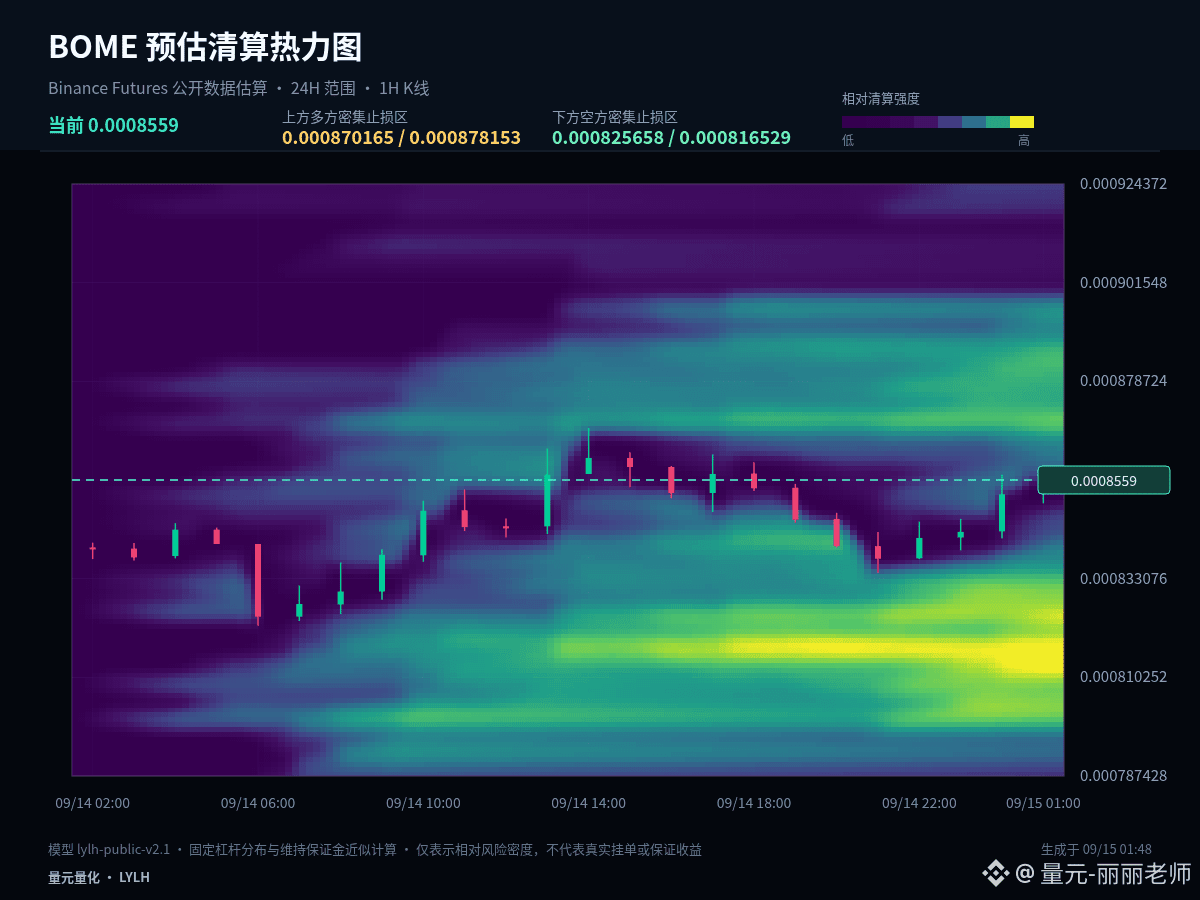
$BOME #BOME Put the in-session conclusion first: hold 0.00084585, and only then is there a condition to continue testing 0.0008685. Current price: 0.0008563, +0.29% in 1 hour, +1.79% in 24 hours.
Currently +0.29% in 1 hour and +1.79% in 24 hours—these two timeframes have not formed sufficiently clear alignment in the same direction. In a range-bound market, the tolerance for chasing and killing is low. It’s more suitable to use confirmation from the upper boundary for direction, and confirmation of support from the lower boundary; the midline is only used as the strength/weakness divider.
For key price levels: 0.00084585 is the current structure’s midline and the first standard to judge whether a pullback is healthy. As long as price can stay steadily above it, the bulls still have the initiative. The next area to watch above is 0.0008685. If price falls back below the midline, focus should shift to the secondary support at 0.0008232.
There are three ways to handle the next path: (1) if price rises effectively and holds above 0.0008685, wait for a pullback that doesn’t break, then reassess for continuation; (2) if price breaks down below 0.0008232, prioritize risk control and wait for new support; (3) if price continues to oscillate around 0.00084585, treat it as range rotation—don’t repeatedly chase direction from the middle.
Position sizing needs to differentiate between spot and futures. Existing spot holdings can be managed in stages around key levels without frequently flipping direction due to every single 1-hour candlestick. If you’re in cash, wait for confirmation first, then scale in more calmly. Futures place more emphasis on entry location and invalidation conditions. When volatility amplifies, actively reduce position size to avoid turning short-term judgment into passive holding.
Simplifying the conclusion doesn’t mean simplifying risk control. In real execution, you still need to wait for price confirmation and leave room for exit in case your judgment is invalidated. The market will ultimately validate your viewpoint with price action. Do you think the most critical right now is the breakout of 0.0008685, or the defense of 0.0008232? Let’s track the outcomes together.
#AnthropicCEOCallsForAISlowdown
$BOME #BOME Put the in-session conclusion first: hold 0.00084585, and only then is there a condition to continue testing 0.0008685. Current price: 0.0008563, +0.29% in 1 hour, +1.79% in 24 hours.
Currently +0.29% in 1 hour and +1.79% in 24 hours—these two timeframes have not formed sufficiently clear alignment in the same direction. In a range-bound market, the tolerance for chasing and killing is low. It’s more suitable to use confirmation from the upper boundary for direction, and confirmation of support from the lower boundary; the midline is only used as the strength/weakness divider.
For key price levels: 0.00084585 is the current structure’s midline and the first standard to judge whether a pullback is healthy. As long as price can stay steadily above it, the bulls still have the initiative. The next area to watch above is 0.0008685. If price falls back below the midline, focus should shift to the secondary support at 0.0008232.
There are three ways to handle the next path: (1) if price rises effectively and holds above 0.0008685, wait for a pullback that doesn’t break, then reassess for continuation; (2) if price breaks down below 0.0008232, prioritize risk control and wait for new support; (3) if price continues to oscillate around 0.00084585, treat it as range rotation—don’t repeatedly chase direction from the middle.
Position sizing needs to differentiate between spot and futures. Existing spot holdings can be managed in stages around key levels without frequently flipping direction due to every single 1-hour candlestick. If you’re in cash, wait for confirmation first, then scale in more calmly. Futures place more emphasis on entry location and invalidation conditions. When volatility amplifies, actively reduce position size to avoid turning short-term judgment into passive holding.
Simplifying the conclusion doesn’t mean simplifying risk control. In real execution, you still need to wait for price confirmation and leave room for exit in case your judgment is invalidated. The market will ultimately validate your viewpoint with price action. Do you think the most critical right now is the breakout of 0.0008685, or the defense of 0.0008232? Let’s track the outcomes together.
#AnthropicCEOCallsForAISlowdown
Currently +0.29% in 1 hour and +1.79% in 24 hours—these two timeframes have not formed sufficiently clear alignment in the same direction. In a range-bound market, the tolerance for chasing and killing is low. It’s more suitable to use confirmation from the upper boundary for direction, and confirmation of support from the lower boundary; the midline is only used as the strength/weakness divider.
For key price levels: 0.00084585 is the current structure’s midline and the first standard to judge whether a pullback is healthy. As long as price can stay steadily above it, the bulls still have the initiative. The next area to watch above is 0.0008685. If price falls back below the midline, focus should shift to the secondary support at 0.0008232.
There are three ways to handle the next path: (1) if price rises effectively and holds above 0.0008685, wait for a pullback that doesn’t break, then reassess for continuation; (2) if price breaks down below 0.0008232, prioritize risk control and wait for new support; (3) if price continues to oscillate around 0.00084585, treat it as range rotation—don’t repeatedly chase direction from the middle.
Position sizing needs to differentiate between spot and futures. Existing spot holdings can be managed in stages around key levels without frequently flipping direction due to every single 1-hour candlestick. If you’re in cash, wait for confirmation first, then scale in more calmly. Futures place more emphasis on entry location and invalidation conditions. When volatility amplifies, actively reduce position size to avoid turning short-term judgment into passive holding.
Simplifying the conclusion doesn’t mean simplifying risk control. In real execution, you still need to wait for price confirmation and leave room for exit in case your judgment is invalidated. The market will ultimately validate your viewpoint with price action. Do you think the most critical right now is the breakout of 0.0008685, or the defense of 0.0008232? Let’s track the outcomes together.
#AnthropicCEOCallsForAISlowdown
24

·
--
Article
BOME/USDT (4h) Approaches a Breakout from a Symmetrical Triangle ✨✨✨✨BOME/USDT is executing a buildup inside a large symmetrical triangle on the 4H chart, as price forms lower highs below a bearish resistance level, while gradually maintaining higher lows along the rising support. The structure’s range has narrowed significantly, and price is now trading very close to the triangle’s apex at around $0.00085–$0.00087.
BOME/USDT (4h) Approaches a Breakout from a Symmetrical Triangle ✨✨✨✨
BOME/USDT is executing a buildup inside a large symmetrical triangle on the 4H chart, as price forms lower highs below a bearish resistance level, while gradually maintaining higher lows along the rising support. The structure’s range has narrowed significantly, and price is now trading very close to the triangle’s apex at around $0.00085–$0.00087.
1
46

·
--
BOME 1 hour: Three Crows + Key Levels—once and for all
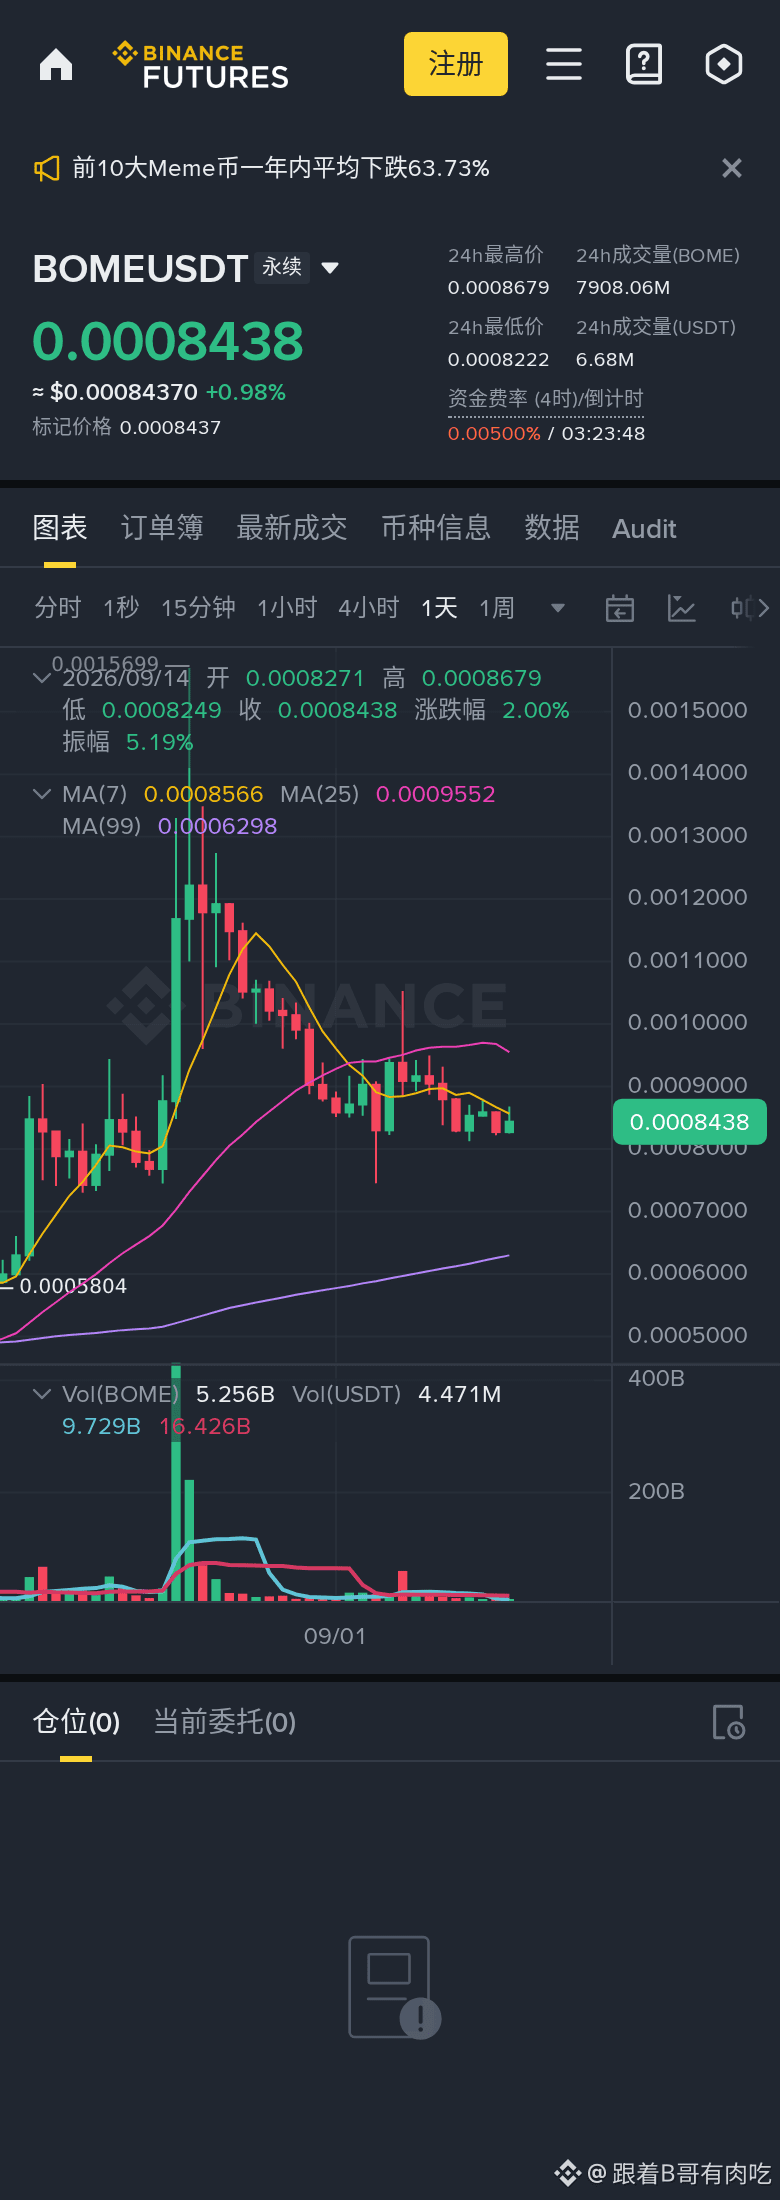
BOME comes to this point. In the 1-hour chart, should you take action? Look at these numbers. The bears are dominant. I only short below the pressure. If it holds, I withdraw. On the 1-hour chart: 0.0008441 (+0.67%); RSI is 63.3; moving averages are in a bearish configuration / bearish alignment; the candles are Three Crows.
Key levels for the 1-hour chart: Support 0.0008232 / Resistance 0.0008817. Entry: 0.0008441; defense level: 0.0008694; target: 0.0008061; R:R 1.5:1; position size 1–2%.
Three Crows is a bearish signal indicating ongoing weakness. Treat any rebound as bearish.
Reminder: Don’t exceed 1–2% position size. If the stop loss is hit, leave—never add to or average down. Levels will move with the market; before acting, review the chart for yourself again.
⚠️ Purely technical sharing, not investment advice. Profit or loss is your own responsibility. Crypto is highly volatile—judge independently and control risk.
#BOME #币安广场 #range trading
BOME 1 hour: Three Crows + Key Levels—once and for all
BOME comes to this point. In the 1-hour chart, should you take action? Look at these numbers. The bears are dominant. I only short below the pressure. If it holds, I withdraw. On the 1-hour chart: 0.0008441 (+0.67%); RSI is 63.3; moving averages are in a bearish configuration / bearish alignment; the candles are Three Crows.
Key levels for the 1-hour chart: Support 0.0008232 / Resistance 0.0008817. Entry: 0.0008441; defense level: 0.0008694; target: 0.0008061; R:R 1.5:1; position size 1–2%.
Three Crows is a bearish signal indicating ongoing weakness. Treat any rebound as bearish.
Reminder: Don’t exceed 1–2% position size. If the stop loss is hit, leave—never add to or average down. Levels will move with the market; before acting, review the chart for yourself again.
⚠️ Purely technical sharing, not investment advice. Profit or loss is your own responsibility. Crypto is highly volatile—judge independently and control risk.
#BOME #币安广场 #range trading
BOME comes to this point. In the 1-hour chart, should you take action? Look at these numbers. The bears are dominant. I only short below the pressure. If it holds, I withdraw. On the 1-hour chart: 0.0008441 (+0.67%); RSI is 63.3; moving averages are in a bearish configuration / bearish alignment; the candles are Three Crows.
Key levels for the 1-hour chart: Support 0.0008232 / Resistance 0.0008817. Entry: 0.0008441; defense level: 0.0008694; target: 0.0008061; R:R 1.5:1; position size 1–2%.
Three Crows is a bearish signal indicating ongoing weakness. Treat any rebound as bearish.
Reminder: Don’t exceed 1–2% position size. If the stop loss is hit, leave—never add to or average down. Levels will move with the market; before acting, review the chart for yourself again.
⚠️ Purely technical sharing, not investment advice. Profit or loss is your own responsibility. Crypto is highly volatile—judge independently and control risk.
#BOME #币安广场 #range trading
94

·
--
$BOME Net buy in the past 30 minutes: 210,000
$AIN Up 45.7% today; volume and price are aligned
💰 BOME 0.0008590 — slightly bullish
🟢 Hold above 0.0008625
Targets: 0.0008835 / 0.0008940 / 0.0009045
Stop loss: 0.0008485
🔴 If it breaks below 0.0008555
Next support: 0.0008345 / 0.0008240
🎯 The main force is chasing longs. The 30-minute volume is 3.1x and the 30-minute net inflow is 208,700 USDT, indicating strong buying pressure. However, there is still a lack of stronger price-momentum signals to confirm whether the main force will keep pushing the price higher.
━━━━━━━━━
💰 AIN 0.10119 — slightly bullish
🟢 Hold above 0.10160
Targets: 0.10406 / 0.10529 / 0.10652
Stop loss: 0.09996
🔴 If it breaks below 0.10078
Next support: 0.09832 / 0.09709
🎯 The main force is using the large-holder long/short ratio of 1.17 to try to go long. The active execution ratio of 0.98 shows a tug-of-war between longs and shorts; wait for confirmation after it holds steady before following.
—
🕒 Data taken from 09-14 13:45 (UTC+8) Binance futures market; you can verify it yourself
Objective data is presented—no investment advice. Be mindful of risk.
#BOME #AIN
$BOME Net buy in the past 30 minutes: 210,000
$AIN Up 45.7% today; volume and price are aligned
💰 BOME 0.0008590 — slightly bullish
🟢 Hold above 0.0008625
Targets: 0.0008835 / 0.0008940 / 0.0009045
Stop loss: 0.0008485
🔴 If it breaks below 0.0008555
Next support: 0.0008345 / 0.0008240
🎯 The main force is chasing longs. The 30-minute volume is 3.1x and the 30-minute net inflow is 208,700 USDT, indicating strong buying pressure. However, there is still a lack of stronger price-momentum signals to confirm whether the main force will keep pushing the price higher.
━━━━━━━━━
💰 AIN 0.10119 — slightly bullish
🟢 Hold above 0.10160
Targets: 0.10406 / 0.10529 / 0.10652
Stop loss: 0.09996
🔴 If it breaks below 0.10078
Next support: 0.09832 / 0.09709
🎯 The main force is using the large-holder long/short ratio of 1.17 to try to go long. The active execution ratio of 0.98 shows a tug-of-war between longs and shorts; wait for confirmation after it holds steady before following.
—
🕒 Data taken from 09-14 13:45 (UTC+8) Binance futures market; you can verify it yourself
Objective data is presented—no investment advice. Be mindful of risk.
#BOME #AIN
$AIN Up 45.7% today; volume and price are aligned
💰 BOME 0.0008590 — slightly bullish
🟢 Hold above 0.0008625
Targets: 0.0008835 / 0.0008940 / 0.0009045
Stop loss: 0.0008485
🔴 If it breaks below 0.0008555
Next support: 0.0008345 / 0.0008240
🎯 The main force is chasing longs. The 30-minute volume is 3.1x and the 30-minute net inflow is 208,700 USDT, indicating strong buying pressure. However, there is still a lack of stronger price-momentum signals to confirm whether the main force will keep pushing the price higher.
━━━━━━━━━
💰 AIN 0.10119 — slightly bullish
🟢 Hold above 0.10160
Targets: 0.10406 / 0.10529 / 0.10652
Stop loss: 0.09996
🔴 If it breaks below 0.10078
Next support: 0.09832 / 0.09709
🎯 The main force is using the large-holder long/short ratio of 1.17 to try to go long. The active execution ratio of 0.98 shows a tug-of-war between longs and shorts; wait for confirmation after it holds steady before following.
—
🕒 Data taken from 09-14 13:45 (UTC+8) Binance futures market; you can verify it yourself
Objective data is presented—no investment advice. Be mindful of risk.
#BOME #AIN
38

·
--
$BOME #BOME only prepares to enter after the momentum picks up; you also need to assess the position first. In the current 1 hour: -1.96%, and in 24 hours: -4.20%. The space that has already been covered cannot be directly treated as the next segment of space to copy.
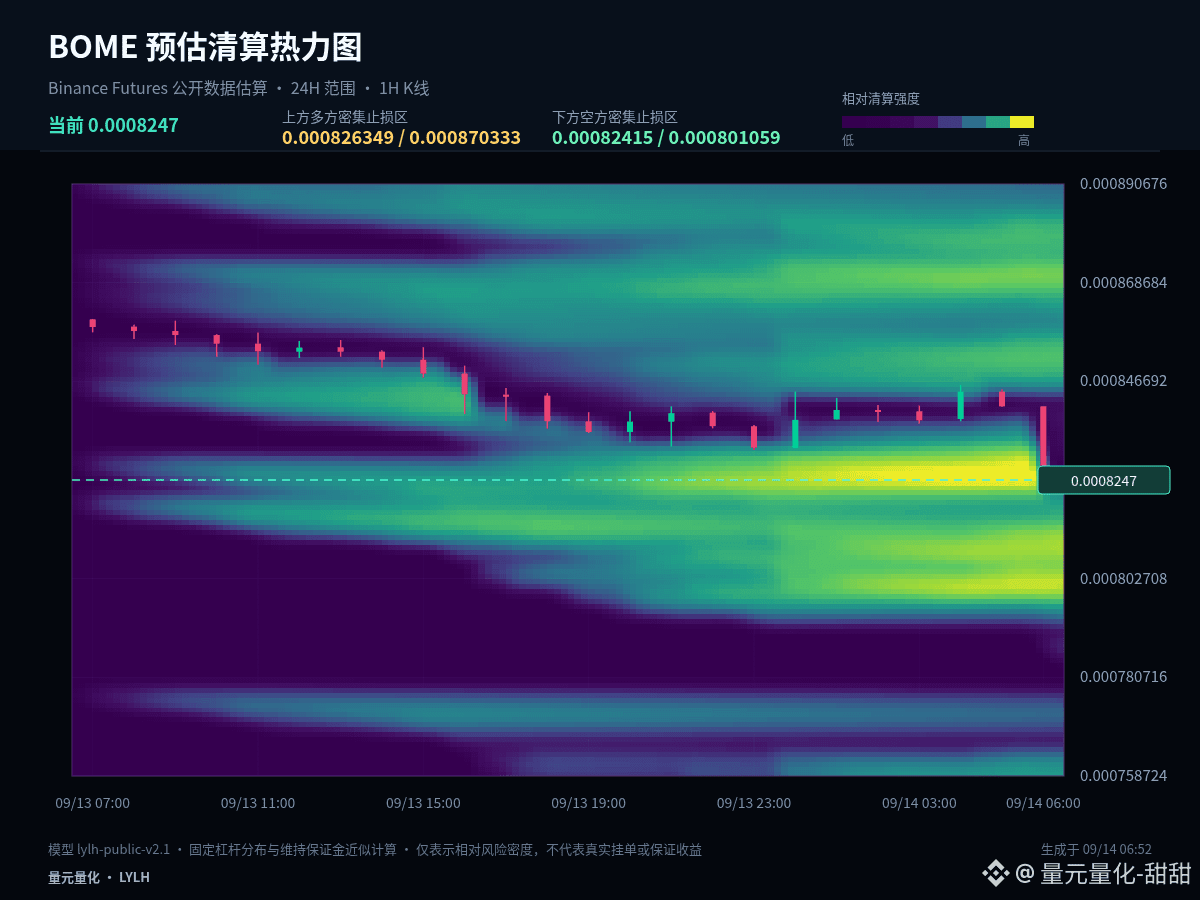
$BOME #BOME is testing the lower edge of the past ~24-hour range. The price may look lower, but the real trading value depends on whether the order flow/holding power can sustain, not just on the idea that it’s cheap.
In a weak phase, it’s easiest to misjudge a single rebound as a reversal. Before 0.00084225 is reclaimed, observe the stabilization/repair; if it breaks again below 0.0008232, it indicates that there is still insufficient effective support underneath.
For execution, set clear conditions: after a break above 0.0008613, you need confirmation—not chase just because of a momentary spike. After dipping to 0.0008232, you need to see whether it can quickly recover—not buy just because it’s falling. If the middle zone doesn’t offer enough favorable odds, waiting itself is also part of the strategy.
For those who already hold positions, the key is managing based on whether support has failed, rather than being carried along by every fluctuation. For those with no position, prioritize waiting for a breakout with a retest or for support confirmation. Spot positions can be built in batches; for contracts, shorten the decision chain—first determine the stop-loss level, then decide whether to participate.
Missing a segment of the行情 (market move) won’t directly cause losses; only chasing at the end of volatility without a plan will force your position to become passive. A trading plan must include invalidation conditions. Even if your judgment is correct, you can take profits in stages; if your judgment is wrong, you must allow yourself to exit. You can’t use adding to positions to cover the fact that the original logic has changed. The market will update, and your view should adjust as price evidence changes.
#AnthropicChoosesNasdaqForPotentialIPO
$BOME #BOME only prepares to enter after the momentum picks up; you also need to assess the position first. In the current 1 hour: -1.96%, and in 24 hours: -4.20%. The space that has already been covered cannot be directly treated as the next segment of space to copy.
$BOME #BOME is testing the lower edge of the past ~24-hour range. The price may look lower, but the real trading value depends on whether the order flow/holding power can sustain, not just on the idea that it’s cheap.
In a weak phase, it’s easiest to misjudge a single rebound as a reversal. Before 0.00084225 is reclaimed, observe the stabilization/repair; if it breaks again below 0.0008232, it indicates that there is still insufficient effective support underneath.
For execution, set clear conditions: after a break above 0.0008613, you need confirmation—not chase just because of a momentary spike. After dipping to 0.0008232, you need to see whether it can quickly recover—not buy just because it’s falling. If the middle zone doesn’t offer enough favorable odds, waiting itself is also part of the strategy.
For those who already hold positions, the key is managing based on whether support has failed, rather than being carried along by every fluctuation. For those with no position, prioritize waiting for a breakout with a retest or for support confirmation. Spot positions can be built in batches; for contracts, shorten the decision chain—first determine the stop-loss level, then decide whether to participate.
Missing a segment of the行情 (market move) won’t directly cause losses; only chasing at the end of volatility without a plan will force your position to become passive. A trading plan must include invalidation conditions. Even if your judgment is correct, you can take profits in stages; if your judgment is wrong, you must allow yourself to exit. You can’t use adding to positions to cover the fact that the original logic has changed. The market will update, and your view should adjust as price evidence changes.
#AnthropicChoosesNasdaqForPotentialIPO
$BOME #BOME is testing the lower edge of the past ~24-hour range. The price may look lower, but the real trading value depends on whether the order flow/holding power can sustain, not just on the idea that it’s cheap.
In a weak phase, it’s easiest to misjudge a single rebound as a reversal. Before 0.00084225 is reclaimed, observe the stabilization/repair; if it breaks again below 0.0008232, it indicates that there is still insufficient effective support underneath.
For execution, set clear conditions: after a break above 0.0008613, you need confirmation—not chase just because of a momentary spike. After dipping to 0.0008232, you need to see whether it can quickly recover—not buy just because it’s falling. If the middle zone doesn’t offer enough favorable odds, waiting itself is also part of the strategy.
For those who already hold positions, the key is managing based on whether support has failed, rather than being carried along by every fluctuation. For those with no position, prioritize waiting for a breakout with a retest or for support confirmation. Spot positions can be built in batches; for contracts, shorten the decision chain—first determine the stop-loss level, then decide whether to participate.
Missing a segment of the行情 (market move) won’t directly cause losses; only chasing at the end of volatility without a plan will force your position to become passive. A trading plan must include invalidation conditions. Even if your judgment is correct, you can take profits in stages; if your judgment is wrong, you must allow yourself to exit. You can’t use adding to positions to cover the fact that the original logic has changed. The market will update, and your view should adjust as price evidence changes.
#AnthropicChoosesNasdaqForPotentialIPO
96
·
--
$BOME #BOME only prepares to enter after the heat rises, and it’s even more necessary to first assess the position. In the current 1 hour +0.06%, 24 hours -2.61%, the space that has already been covered can’t be directly taken as the next segment that can be copied over.
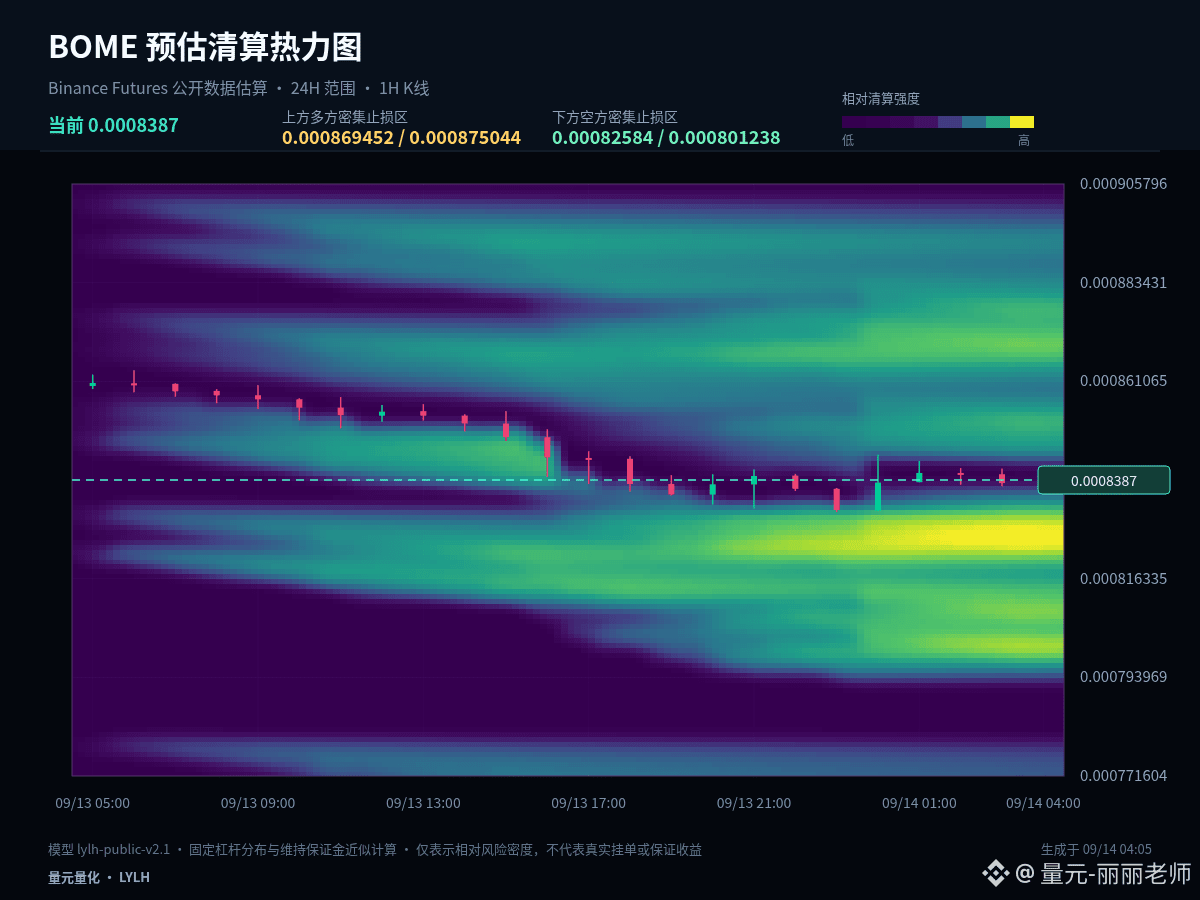
$BOME #BOME is still repeatedly switching hands within the past-24-hours range, and directional advantage is not obvious. The middle area tests patience the most; waiting for boundary signals is usually more effective.
For the bullish side, the more favorable rhythm is to return to around 0.0008487, have selling pressure weaken, and then try again at 0.0008649; if it doesn’t retrace and instead accelerates, the risk-reward ratio of chasing the price will deteriorate.
My scenario analysis isn’t betting on a single direction. A breakout above 0.0008649 and staying there means the upside space has been reopened; breaking below 0.0008325 and failing to rebound indicates the structure weakens further; if price moves between the two, continue observing the closes on either side of 0.0008487.
In terms of position sizing, you need to differentiate between spot and contracts. Existing spot can be managed in segments around key levels without frequently switching direction because of a single 1-hour candlestick; staying flat and waiting for confirmation then scaling in is more comfortable. Contracts place more emphasis on the entry location and invalidation conditions. When volatility increases, actively reduce position size to avoid turning short-term judgments into passive holding.
Missing a portion of the market won’t directly cause losses—the real problem is chasing at the end of volatility without a plan, which forces positions into passivity. The key with contracts isn’t to predict every candlestick; it’s to ensure that entry, trimming, and exit are all backed by rationale. If there’s no confirmation, do less. If a key level fails, redo the plan—control single-trade risk first, then discuss the potential space ahead.
#RevolutConfirmsFakeGovEmailDataBreach
$BOME #BOME only prepares to enter after the heat rises, and it’s even more necessary to first assess the position. In the current 1 hour +0.06%, 24 hours -2.61%, the space that has already been covered can’t be directly taken as the next segment that can be copied over.
$BOME #BOME is still repeatedly switching hands within the past-24-hours range, and directional advantage is not obvious. The middle area tests patience the most; waiting for boundary signals is usually more effective.
For the bullish side, the more favorable rhythm is to return to around 0.0008487, have selling pressure weaken, and then try again at 0.0008649; if it doesn’t retrace and instead accelerates, the risk-reward ratio of chasing the price will deteriorate.
My scenario analysis isn’t betting on a single direction. A breakout above 0.0008649 and staying there means the upside space has been reopened; breaking below 0.0008325 and failing to rebound indicates the structure weakens further; if price moves between the two, continue observing the closes on either side of 0.0008487.
In terms of position sizing, you need to differentiate between spot and contracts. Existing spot can be managed in segments around key levels without frequently switching direction because of a single 1-hour candlestick; staying flat and waiting for confirmation then scaling in is more comfortable. Contracts place more emphasis on the entry location and invalidation conditions. When volatility increases, actively reduce position size to avoid turning short-term judgments into passive holding.
Missing a portion of the market won’t directly cause losses—the real problem is chasing at the end of volatility without a plan, which forces positions into passivity. The key with contracts isn’t to predict every candlestick; it’s to ensure that entry, trimming, and exit are all backed by rationale. If there’s no confirmation, do less. If a key level fails, redo the plan—control single-trade risk first, then discuss the potential space ahead.
#RevolutConfirmsFakeGovEmailDataBreach
$BOME #BOME is still repeatedly switching hands within the past-24-hours range, and directional advantage is not obvious. The middle area tests patience the most; waiting for boundary signals is usually more effective.
For the bullish side, the more favorable rhythm is to return to around 0.0008487, have selling pressure weaken, and then try again at 0.0008649; if it doesn’t retrace and instead accelerates, the risk-reward ratio of chasing the price will deteriorate.
My scenario analysis isn’t betting on a single direction. A breakout above 0.0008649 and staying there means the upside space has been reopened; breaking below 0.0008325 and failing to rebound indicates the structure weakens further; if price moves between the two, continue observing the closes on either side of 0.0008487.
In terms of position sizing, you need to differentiate between spot and contracts. Existing spot can be managed in segments around key levels without frequently switching direction because of a single 1-hour candlestick; staying flat and waiting for confirmation then scaling in is more comfortable. Contracts place more emphasis on the entry location and invalidation conditions. When volatility increases, actively reduce position size to avoid turning short-term judgments into passive holding.
Missing a portion of the market won’t directly cause losses—the real problem is chasing at the end of volatility without a plan, which forces positions into passivity. The key with contracts isn’t to predict every candlestick; it’s to ensure that entry, trimming, and exit are all backed by rationale. If there’s no confirmation, do less. If a key level fails, redo the plan—control single-trade risk first, then discuss the potential space ahead.
#RevolutConfirmsFakeGovEmailDataBreach
133

·
--
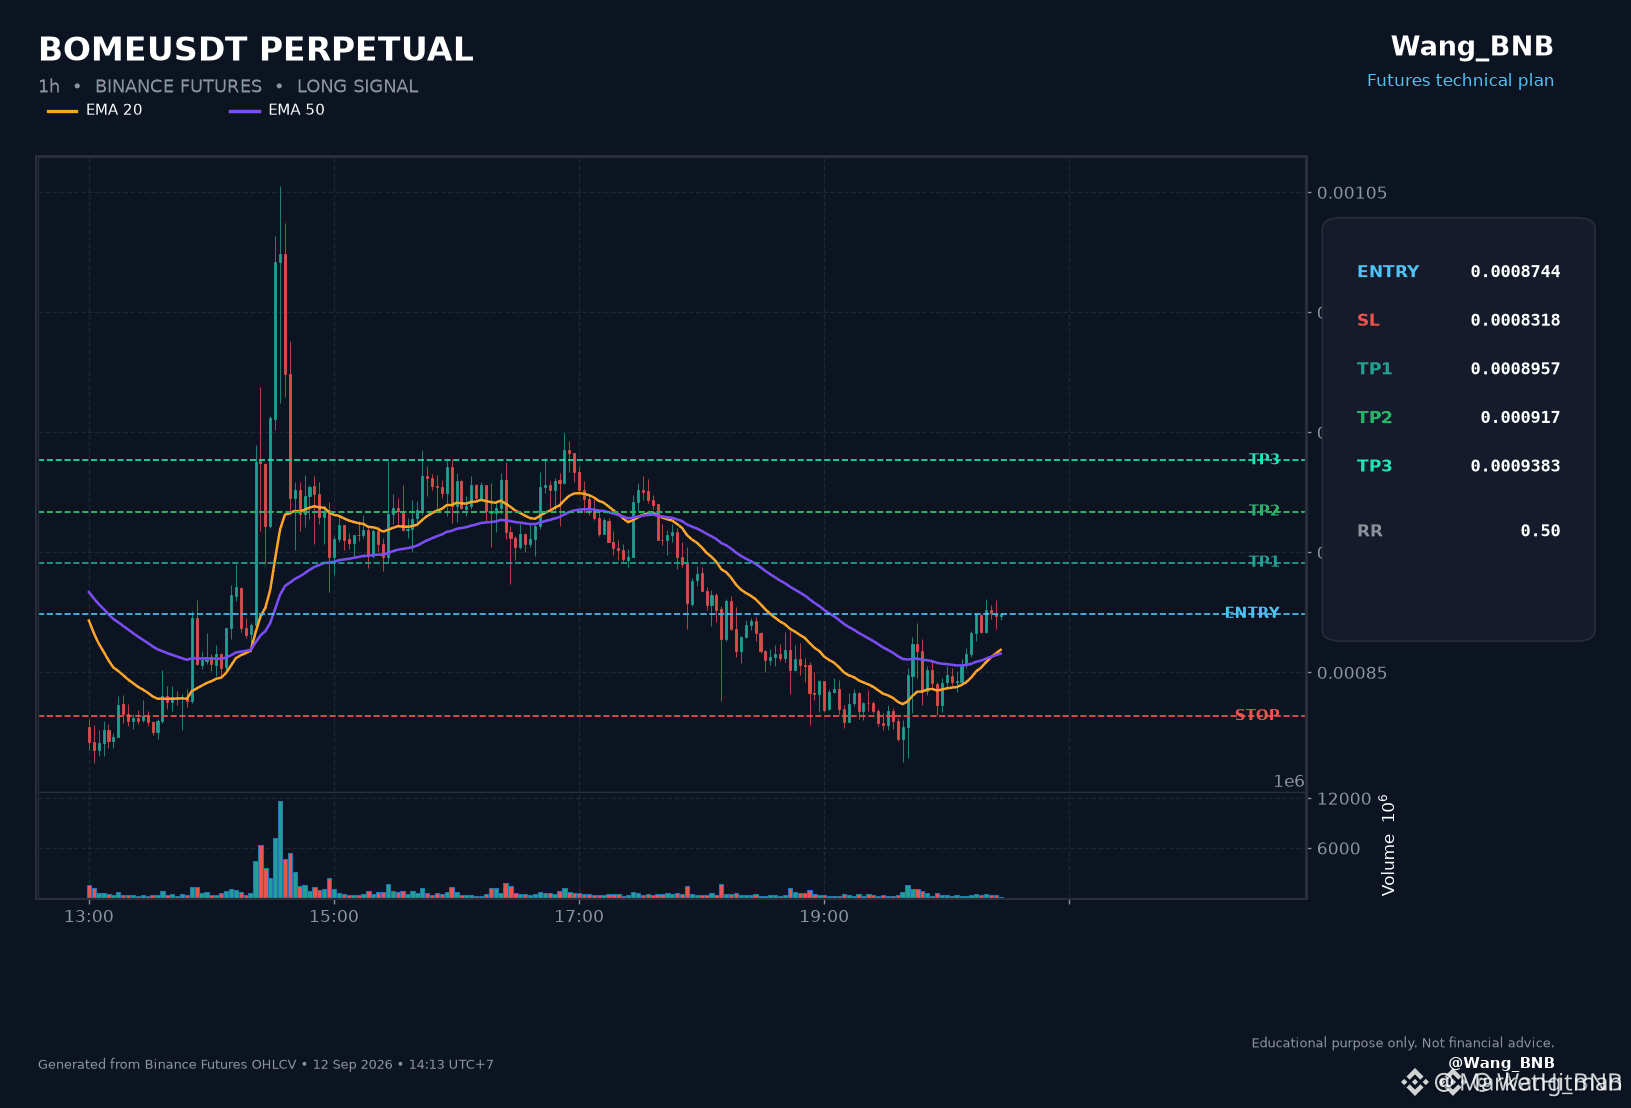
⚡ $BOME CARVING A BULLISH STRUCTURE AGAINST MARKET TREPIDATION WITH INSTITUTIONAL BID UP! 🦈
Entry: 0.0008744 ⚡
Target: 0.0009383 🎯
Stop Loss: 0.0008318 ⚠️
While macro market sentiment remains heavy, $BOME is carving an independent market structure higher. 🔍 Smart money is quietly absorbing sell-side liquidity at the 0.0008744 demand block, establishing a firm structural higher low while broader altcoins struggle.
This deliberate accumulation signals a potential expansion toward upper liquidity pools at 0.0009383. 📊 With risk tightly anchored below 0.0008318, the risk-to-reward dynamic clearly favors disciplined institutional positioning over emotional selling.
💬 Are you anticipating $BOME to complete this structural expansion, or will broader market momentum drag it back into the range? 👇
⚠️ Not financial advice. Always manage your risk. 🛡️
🏷️ #BOME #LongSetup #Crypto #MarketStructure
🎯 🦈
⚡ $BOME CARVING A BULLISH STRUCTURE AGAINST MARKET TREPIDATION WITH INSTITUTIONAL BID UP! 🦈
Entry: 0.0008744 ⚡
Target: 0.0009383 🎯
Stop Loss: 0.0008318 ⚠️
While macro market sentiment remains heavy, $BOME is carving an independent market structure higher. 🔍 Smart money is quietly absorbing sell-side liquidity at the 0.0008744 demand block, establishing a firm structural higher low while broader altcoins struggle.
This deliberate accumulation signals a potential expansion toward upper liquidity pools at 0.0009383. 📊 With risk tightly anchored below 0.0008318, the risk-to-reward dynamic clearly favors disciplined institutional positioning over emotional selling.
💬 Are you anticipating $BOME to complete this structural expansion, or will broader market momentum drag it back into the range? 👇
⚠️ Not financial advice. Always manage your risk. 🛡️
🏷️ #BOME #LongSetup #Crypto #MarketStructure
🎯 🦈
Entry: 0.0008744 ⚡
Target: 0.0009383 🎯
Stop Loss: 0.0008318 ⚠️
While macro market sentiment remains heavy, $BOME is carving an independent market structure higher. 🔍 Smart money is quietly absorbing sell-side liquidity at the 0.0008744 demand block, establishing a firm structural higher low while broader altcoins struggle.
This deliberate accumulation signals a potential expansion toward upper liquidity pools at 0.0009383. 📊 With risk tightly anchored below 0.0008318, the risk-to-reward dynamic clearly favors disciplined institutional positioning over emotional selling.
💬 Are you anticipating $BOME to complete this structural expansion, or will broader market momentum drag it back into the range? 👇
⚠️ Not financial advice. Always manage your risk. 🛡️
🏷️ #BOME #LongSetup #Crypto #MarketStructure
🎯 🦈

46

·
--
🟢 WHILE THE CROWD LEANS BEARISH $BOME SILENTLY CARVES A CONVICTION BREAKOUT! 💥
Entry: 0.0008744 ⚡
Target: 0.0009383 🚀
Stop Loss: 0.0008318 ⚠️
While retail noise screams weakness, smart money is quietly absorbing sell-side pressure on $BOME to establish a higher low structure. 📊 Sellers are burning out rapidly while order flow shifts into active accumulation.
💡 A clean reclaim above this pivot unleashes clear momentum toward the upper expansion targets with well-defined risk below support. 📌 The asymmetry here heavily favors those front-running the sentiment flip. 💬 Are you fading the majority narrative here, or riding this trend higher? 👇
⚠️ Not financial advice. Always manage your risk. 🛡️
🏷️ #BOME #LongSetup #Crypto #Breakout #Altcoins
🔥 💎
🟢 WHILE THE CROWD LEANS BEARISH $BOME SILENTLY CARVES A CONVICTION BREAKOUT! 💥
Entry: 0.0008744 ⚡
Target: 0.0009383 🚀
Stop Loss: 0.0008318 ⚠️
While retail noise screams weakness, smart money is quietly absorbing sell-side pressure on $BOME to establish a higher low structure. 📊 Sellers are burning out rapidly while order flow shifts into active accumulation.
💡 A clean reclaim above this pivot unleashes clear momentum toward the upper expansion targets with well-defined risk below support. 📌 The asymmetry here heavily favors those front-running the sentiment flip. 💬 Are you fading the majority narrative here, or riding this trend higher? 👇
⚠️ Not financial advice. Always manage your risk. 🛡️
🏷️ #BOME #LongSetup #Crypto #Breakout #Altcoins
🔥 💎
Entry: 0.0008744 ⚡
Target: 0.0009383 🚀
Stop Loss: 0.0008318 ⚠️
While retail noise screams weakness, smart money is quietly absorbing sell-side pressure on $BOME to establish a higher low structure. 📊 Sellers are burning out rapidly while order flow shifts into active accumulation.
💡 A clean reclaim above this pivot unleashes clear momentum toward the upper expansion targets with well-defined risk below support. 📌 The asymmetry here heavily favors those front-running the sentiment flip. 💬 Are you fading the majority narrative here, or riding this trend higher? 👇
⚠️ Not financial advice. Always manage your risk. 🛡️
🏷️ #BOME #LongSetup #Crypto #Breakout #Altcoins
🔥 💎
76

·
--
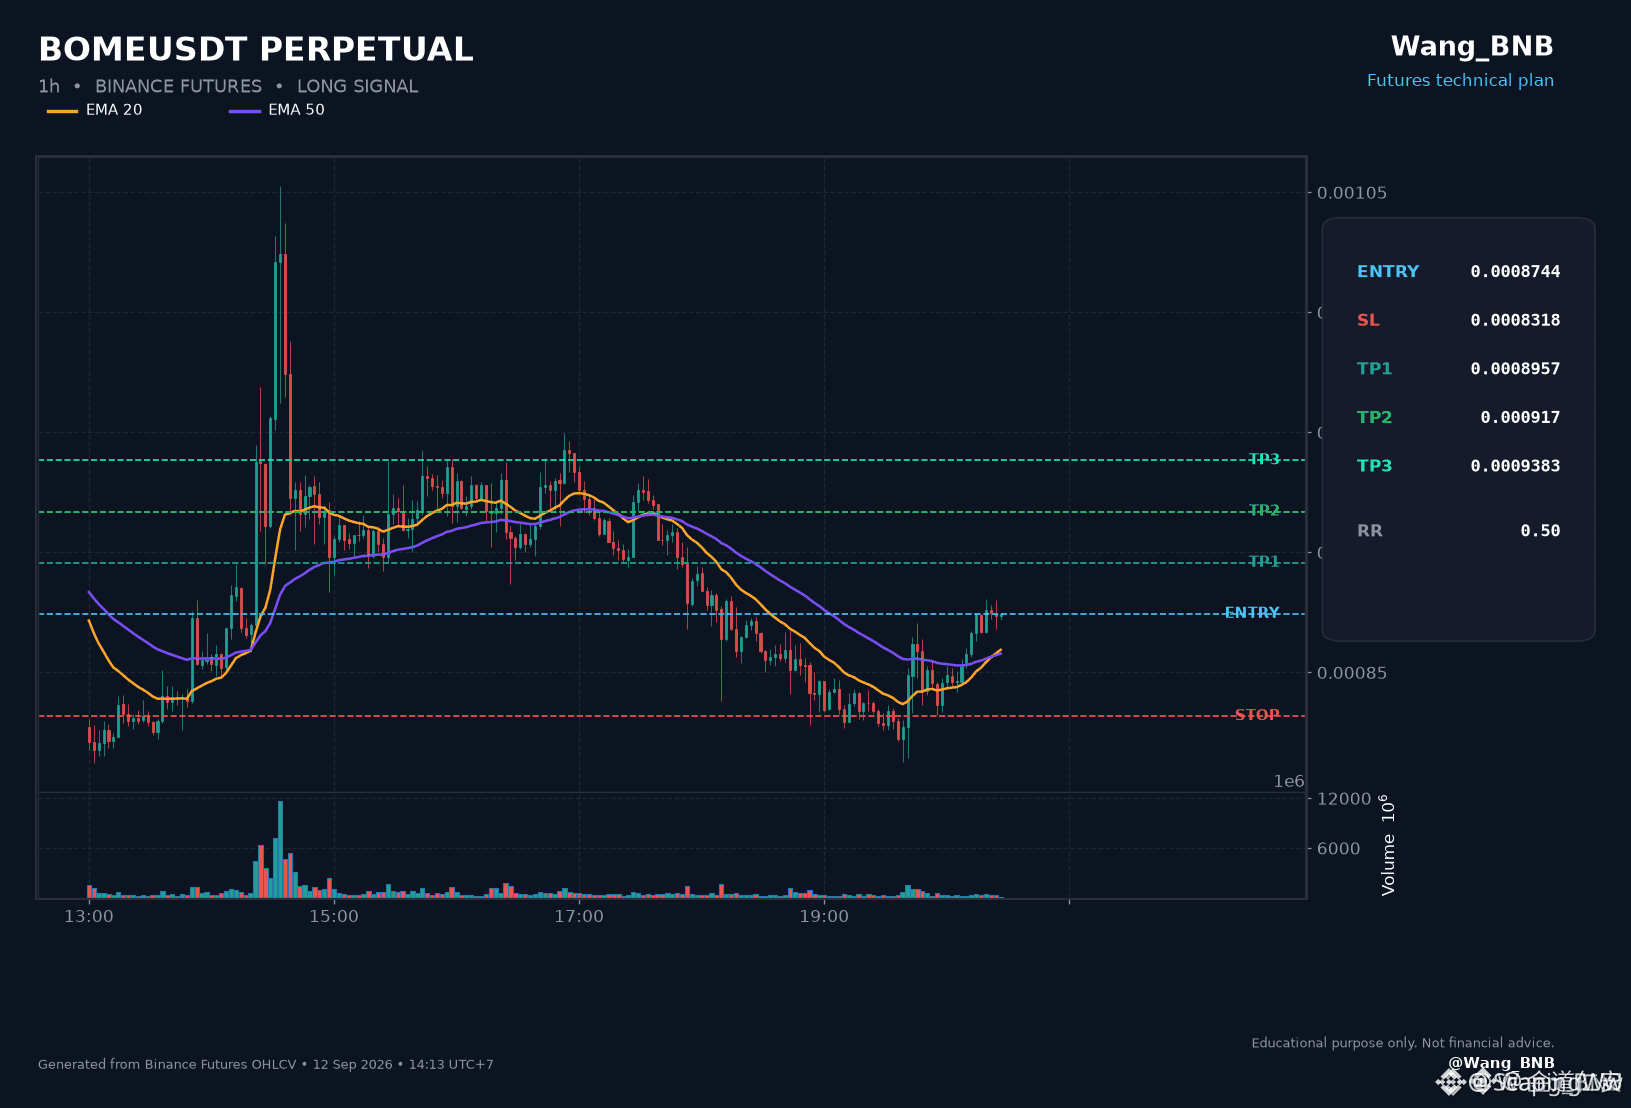
🟢 $BOME CARVES AN INDEPENDENT BULLISH PATH AS SMART MONEY ACCUMULATES SILENTLY! ⚡
Entry: 0.0008744 ⚡
Target: 0.0009383 🚀
Stop Loss: 0.0008318 ⚠️
While the broader market hesitates, $BOME is staging a subtle yet strong trend reversal, stepping up into a clean higher-low sequence. 📊 Order flow shows quiet accumulation off local demand, positioning this setup for a fast expansion toward upper liquidity targets.
💡 Capital is rotating into strong structure right now, and this reclaim offers a sharp risk-to-reward window for disciplined momentum traders. 💬 Are you catching this momentum wave early, or waiting for confirmation above resistance? 👇
⚠️ Not financial advice. Always manage your risk. 🛡️
🏷️ #BOME #LongSetup #Altcoins #Crypto #Breakout
🔥 💎
🟢 $BOME CARVES AN INDEPENDENT BULLISH PATH AS SMART MONEY ACCUMULATES SILENTLY! ⚡
Entry: 0.0008744 ⚡
Target: 0.0009383 🚀
Stop Loss: 0.0008318 ⚠️
While the broader market hesitates, $BOME is staging a subtle yet strong trend reversal, stepping up into a clean higher-low sequence. 📊 Order flow shows quiet accumulation off local demand, positioning this setup for a fast expansion toward upper liquidity targets.
💡 Capital is rotating into strong structure right now, and this reclaim offers a sharp risk-to-reward window for disciplined momentum traders. 💬 Are you catching this momentum wave early, or waiting for confirmation above resistance? 👇
⚠️ Not financial advice. Always manage your risk. 🛡️
🏷️ #BOME #LongSetup #Altcoins #Crypto #Breakout
🔥 💎
Entry: 0.0008744 ⚡
Target: 0.0009383 🚀
Stop Loss: 0.0008318 ⚠️
While the broader market hesitates, $BOME is staging a subtle yet strong trend reversal, stepping up into a clean higher-low sequence. 📊 Order flow shows quiet accumulation off local demand, positioning this setup for a fast expansion toward upper liquidity targets.
💡 Capital is rotating into strong structure right now, and this reclaim offers a sharp risk-to-reward window for disciplined momentum traders. 💬 Are you catching this momentum wave early, or waiting for confirmation above resistance? 👇
⚠️ Not financial advice. Always manage your risk. 🛡️
🏷️ #BOME #LongSetup #Altcoins #Crypto #Breakout
🔥 💎
69
·
--
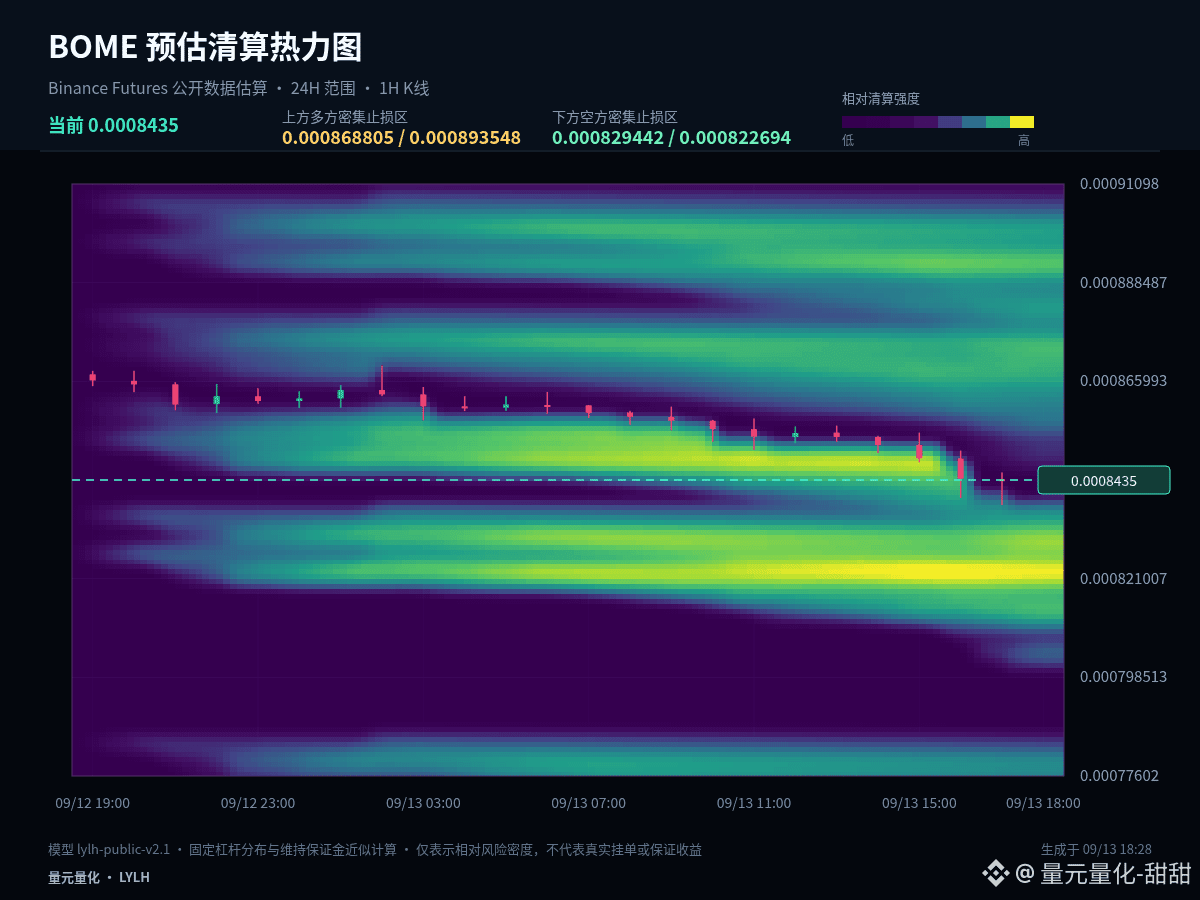
$BOME #BOME If we only keep one observation price for this round, I would choose 0.00085455. Current price is 0.0008445; over 1 hour: +0.02%, over 24 hours: -2.67%. Using the midline gain/loss can help filter out a lot of intraday noise.
Keeping the price above 0.00085455 indicates that any pullback is still controlled by the bulls. The next objective is to test the pressure at 0.0008706. If the price falls back below the midline again, the earlier strength will be discounted, and we should also prevent a further move back to 0.0008385.
Right now it’s +0.02% over 1 hour and -2.67% over 24 hours, and the two timeframes have not formed a clear directional alignment. In a range-bound market, the tolerance for chasing and selling is lower. It’s more suitable to confirm direction with upper-band breaks and confirm support with lower-band holds. The midline should only be used as the line dividing strength and weakness.
For execution, set clear conditions: after breaking above 0.0008706, you need confirmation—not to chase just because you see a sudden spike. After dipping to 0.0008385, check whether it can quickly reclaim the level—not to buy just because it drops. If the middle zone doesn’t offer sufficient reward-to-risk, waiting itself is also part of the strategy.
Position sizing should distinguish between spot and contracts. If you already hold spot, manage in stages around key levels, without flipping your direction every time a single 1-hour candle appears. Staying in cash and waiting for confirmation, then entering in batches, is more composed. Contracts place greater emphasis on entry location and invalidation conditions. When volatility expands, reduce position size proactively to avoid turning a short-term call into passive holding.
Next, I’ll focus mainly on whether 0.00085455 holds or breaks. Would you rather test 0.0008706 first, or go back to 0.0008385 first? Feel free to share your view and reasoning.
#ClarityActFacesProceduralVoteSept15
$BOME #BOME If we only keep one observation price for this round, I would choose 0.00085455. Current price is 0.0008445; over 1 hour: +0.02%, over 24 hours: -2.67%. Using the midline gain/loss can help filter out a lot of intraday noise.
Keeping the price above 0.00085455 indicates that any pullback is still controlled by the bulls. The next objective is to test the pressure at 0.0008706. If the price falls back below the midline again, the earlier strength will be discounted, and we should also prevent a further move back to 0.0008385.
Right now it’s +0.02% over 1 hour and -2.67% over 24 hours, and the two timeframes have not formed a clear directional alignment. In a range-bound market, the tolerance for chasing and selling is lower. It’s more suitable to confirm direction with upper-band breaks and confirm support with lower-band holds. The midline should only be used as the line dividing strength and weakness.
For execution, set clear conditions: after breaking above 0.0008706, you need confirmation—not to chase just because you see a sudden spike. After dipping to 0.0008385, check whether it can quickly reclaim the level—not to buy just because it drops. If the middle zone doesn’t offer sufficient reward-to-risk, waiting itself is also part of the strategy.
Position sizing should distinguish between spot and contracts. If you already hold spot, manage in stages around key levels, without flipping your direction every time a single 1-hour candle appears. Staying in cash and waiting for confirmation, then entering in batches, is more composed. Contracts place greater emphasis on entry location and invalidation conditions. When volatility expands, reduce position size proactively to avoid turning a short-term call into passive holding.
Next, I’ll focus mainly on whether 0.00085455 holds or breaks. Would you rather test 0.0008706 first, or go back to 0.0008385 first? Feel free to share your view and reasoning.
#ClarityActFacesProceduralVoteSept15
Keeping the price above 0.00085455 indicates that any pullback is still controlled by the bulls. The next objective is to test the pressure at 0.0008706. If the price falls back below the midline again, the earlier strength will be discounted, and we should also prevent a further move back to 0.0008385.
Right now it’s +0.02% over 1 hour and -2.67% over 24 hours, and the two timeframes have not formed a clear directional alignment. In a range-bound market, the tolerance for chasing and selling is lower. It’s more suitable to confirm direction with upper-band breaks and confirm support with lower-band holds. The midline should only be used as the line dividing strength and weakness.
For execution, set clear conditions: after breaking above 0.0008706, you need confirmation—not to chase just because you see a sudden spike. After dipping to 0.0008385, check whether it can quickly reclaim the level—not to buy just because it drops. If the middle zone doesn’t offer sufficient reward-to-risk, waiting itself is also part of the strategy.
Position sizing should distinguish between spot and contracts. If you already hold spot, manage in stages around key levels, without flipping your direction every time a single 1-hour candle appears. Staying in cash and waiting for confirmation, then entering in batches, is more composed. Contracts place greater emphasis on entry location and invalidation conditions. When volatility expands, reduce position size proactively to avoid turning a short-term call into passive holding.
Next, I’ll focus mainly on whether 0.00085455 holds or breaks. Would you rather test 0.0008706 first, or go back to 0.0008385 first? Feel free to share your view and reasoning.
#ClarityActFacesProceduralVoteSept15
14

·
--
Bullish
🚀 #BOME To The Moon or To The Crypt? 🐸
Current Price: 0.000845
Let's check the 4H chart cooked by TradingView:
• RSI (14): 42.87 (Not oversold yet, but getting cozy)
• %R (14): -57.16 (Chilling in the middle)
• MA-7: 0.0008366 (We are above it! Bulls waking up?)
• MA-25: 0.0008762 | MA-99: 0.0009164 (Boss levels ahead)
• Volume: 40.826M
🔮 Trend Prediction: A short-term bullish pump is loading! Time to print some green candles. 📈
What to do?
• 🎯 TP 1: 0.000932
• 🔥 TP 2: 0.001017
• 🛡️ SL: 0.000770
⚠️ This is not financial advice! Do your own research.
Create your [Binance Account](https://www.binance.com/register?ref=VINHTOCDO) now to trade:
👉 Referral Code: VINHTOCDO
👉 Link: Binance Registration
#BOME #memecoin #VINHTOCDO #TechnicalAnalysis $BOME #Binance
🚀 #BOME To The Moon or To The Crypt? 🐸
Current Price: 0.000845
Let's check the 4H chart cooked by TradingView:
• RSI (14): 42.87 (Not oversold yet, but getting cozy)
• %R (14): -57.16 (Chilling in the middle)
• MA-7: 0.0008366 (We are above it! Bulls waking up?)
• MA-25: 0.0008762 | MA-99: 0.0009164 (Boss levels ahead)
• Volume: 40.826M
🔮 Trend Prediction: A short-term bullish pump is loading! Time to print some green candles. 📈
What to do?
• 🎯 TP 1: 0.000932
• 🔥 TP 2: 0.001017
• 🛡️ SL: 0.000770
⚠️ This is not financial advice! Do your own research.
Create your Binance Account now to trade:
👉 Referral Code: VINHTOCDO
👉 Link: Binance Registration
#BOME #memecoin #VINHTOCDO #TechnicalAnalysis $BOME #Binance
Current Price: 0.000845
Let's check the 4H chart cooked by TradingView:
• RSI (14): 42.87 (Not oversold yet, but getting cozy)
• %R (14): -57.16 (Chilling in the middle)
• MA-7: 0.0008366 (We are above it! Bulls waking up?)
• MA-25: 0.0008762 | MA-99: 0.0009164 (Boss levels ahead)
• Volume: 40.826M
🔮 Trend Prediction: A short-term bullish pump is loading! Time to print some green candles. 📈
What to do?
• 🎯 TP 1: 0.000932
• 🔥 TP 2: 0.001017
• 🛡️ SL: 0.000770
⚠️ This is not financial advice! Do your own research.
Create your Binance Account now to trade:
👉 Referral Code: VINHTOCDO
👉 Link: Binance Registration
#BOME #memecoin #VINHTOCDO #TechnicalAnalysis $BOME #Binance

4
343

·
--
Bearish
BOME longs are getting flushed around $0.00082.
The downside sweep keeps the lower zone active.
$BOME
{future}(BOMEUSDT)
🔴 LIQUIDITY ZONE HIT 🔴
Long liquidation spotted 🧨
$2.3019K cleared at $0.00082
Downside liquidity swept — watch reaction 👀
🎯 TP Targets:
TP1: ~$0.000812
TP2: ~$0.000804
TP3: ~$0.000795
#BOME
BOME longs are getting flushed around $0.00082.
The downside sweep keeps the lower zone active.
$BOME
🔴 LIQUIDITY ZONE HIT 🔴
Long liquidation spotted 🧨
$2.3019K cleared at $0.00082
Downside liquidity swept — watch reaction 👀
🎯 TP Targets:
TP1: ~$0.000812
TP2: ~$0.000804
TP3: ~$0.000795
#BOME
The downside sweep keeps the lower zone active.
$BOME
🔴 LIQUIDITY ZONE HIT 🔴
Long liquidation spotted 🧨
$2.3019K cleared at $0.00082
Downside liquidity swept — watch reaction 👀
🎯 TP Targets:
TP1: ~$0.000812
TP2: ~$0.000804
TP3: ~$0.000795
#BOME
27
·
--
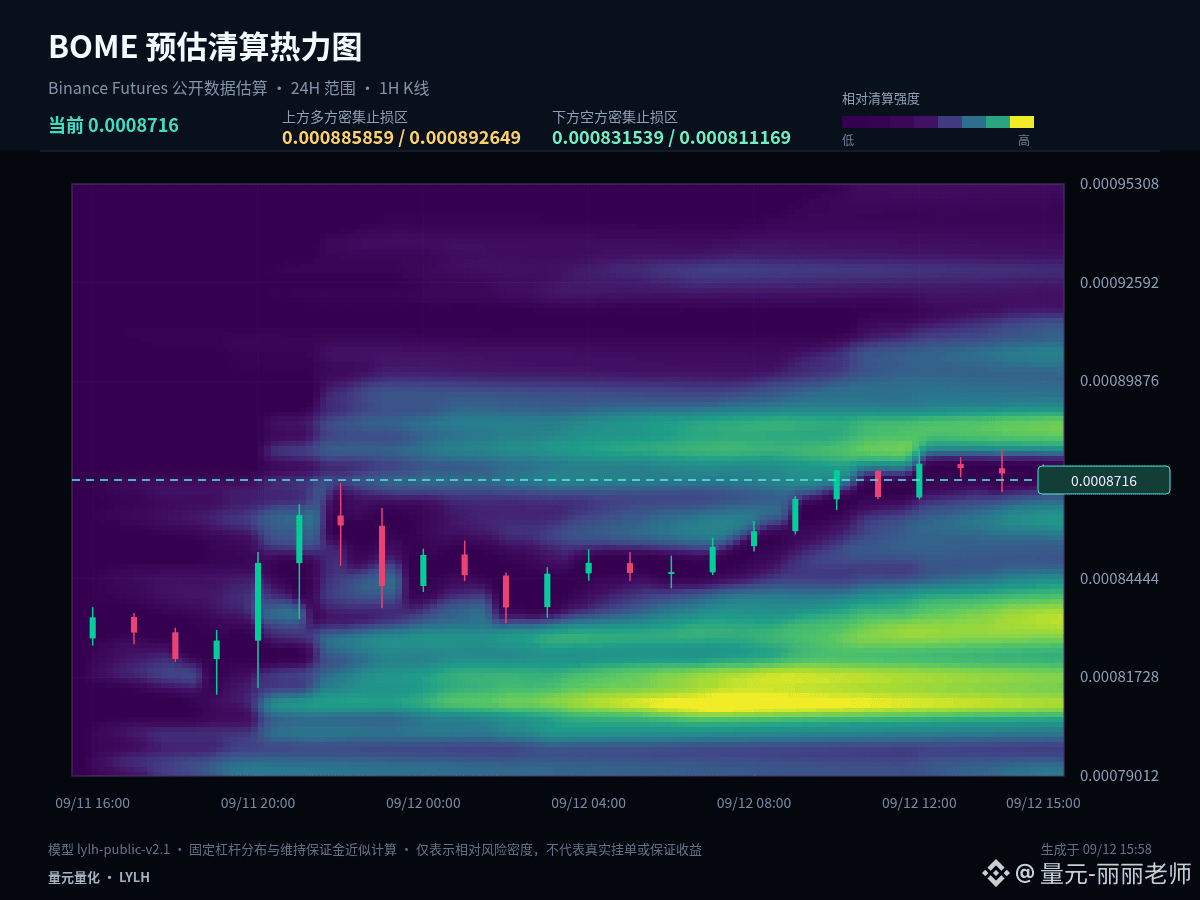
$BOME #BOME Current price 0.0008723; 1 hour -0.17%, 24 hours +5.25%. Rather than trying to decide long or short too early, it’s better to clearly list the possible scenarios and the corresponding actions.
The current price is close to the upper bound of the past 24-hour range: 1 hour -0.17%, 24 hours +5.25%. What matters most at the high end is confirming the market’s acceptance after a breakout. If the price can stay above the upper bound, it suggests the market recognizes a higher range. If it only briefly pierces through and quickly reclaims, you need to watch out for a false breakout.
The first scenario is upward: the price needs to break above 0.0008817 and form a stable close above it; only after a subsequent retest that does not break back down can the confirmation be considered valid. The second scenario is downward: if 0.0008146 is lost and the rebound cannot reclaim it, that indicates insufficient support—so you should prioritize defense rather than rush to add positions.
If the price continues to stay between 0.0008817 and 0.0008146, then 0.00084815 should be used only as a short-term reference for initiative. There is no clear advantage in the middle of the range, so don’t open positions just to feel involved; wait for the market to show direction.
Position sizing needs to distinguish between spot and futures. Existing spot holdings can be managed in stages around key levels without frequently flipping direction based on a single 1-hour candlestick. If you are currently flat, waiting for confirmation and then entering in batches is more composed. Futures place more emphasis on entry location and invalidation conditions. When volatility increases, reduce exposure proactively to avoid turning a short-term judgment into passive holding.
Your trading plan must include invalidation conditions. Even when you judge correctly, you should be able to realize profits in stages; when you judge incorrectly, you must also allow yourself to exit. Don’t use adding positions to mask the fact that the original logic has changed. The market will update, and your viewpoint should adjust with the price evidence.
#BNBTops730USDT
$BOME #BOME Current price 0.0008723; 1 hour -0.17%, 24 hours +5.25%. Rather than trying to decide long or short too early, it’s better to clearly list the possible scenarios and the corresponding actions.
The current price is close to the upper bound of the past 24-hour range: 1 hour -0.17%, 24 hours +5.25%. What matters most at the high end is confirming the market’s acceptance after a breakout. If the price can stay above the upper bound, it suggests the market recognizes a higher range. If it only briefly pierces through and quickly reclaims, you need to watch out for a false breakout.
The first scenario is upward: the price needs to break above 0.0008817 and form a stable close above it; only after a subsequent retest that does not break back down can the confirmation be considered valid. The second scenario is downward: if 0.0008146 is lost and the rebound cannot reclaim it, that indicates insufficient support—so you should prioritize defense rather than rush to add positions.
If the price continues to stay between 0.0008817 and 0.0008146, then 0.00084815 should be used only as a short-term reference for initiative. There is no clear advantage in the middle of the range, so don’t open positions just to feel involved; wait for the market to show direction.
Position sizing needs to distinguish between spot and futures. Existing spot holdings can be managed in stages around key levels without frequently flipping direction based on a single 1-hour candlestick. If you are currently flat, waiting for confirmation and then entering in batches is more composed. Futures place more emphasis on entry location and invalidation conditions. When volatility increases, reduce exposure proactively to avoid turning a short-term judgment into passive holding.
Your trading plan must include invalidation conditions. Even when you judge correctly, you should be able to realize profits in stages; when you judge incorrectly, you must also allow yourself to exit. Don’t use adding positions to mask the fact that the original logic has changed. The market will update, and your viewpoint should adjust with the price evidence.
#BNBTops730USDT
The current price is close to the upper bound of the past 24-hour range: 1 hour -0.17%, 24 hours +5.25%. What matters most at the high end is confirming the market’s acceptance after a breakout. If the price can stay above the upper bound, it suggests the market recognizes a higher range. If it only briefly pierces through and quickly reclaims, you need to watch out for a false breakout.
The first scenario is upward: the price needs to break above 0.0008817 and form a stable close above it; only after a subsequent retest that does not break back down can the confirmation be considered valid. The second scenario is downward: if 0.0008146 is lost and the rebound cannot reclaim it, that indicates insufficient support—so you should prioritize defense rather than rush to add positions.
If the price continues to stay between 0.0008817 and 0.0008146, then 0.00084815 should be used only as a short-term reference for initiative. There is no clear advantage in the middle of the range, so don’t open positions just to feel involved; wait for the market to show direction.
Position sizing needs to distinguish between spot and futures. Existing spot holdings can be managed in stages around key levels without frequently flipping direction based on a single 1-hour candlestick. If you are currently flat, waiting for confirmation and then entering in batches is more composed. Futures place more emphasis on entry location and invalidation conditions. When volatility increases, reduce exposure proactively to avoid turning a short-term judgment into passive holding.
Your trading plan must include invalidation conditions. Even when you judge correctly, you should be able to realize profits in stages; when you judge incorrectly, you must also allow yourself to exit. Don’t use adding positions to mask the fact that the original logic has changed. The market will update, and your viewpoint should adjust with the price evidence.
#BNBTops730USDT
22
·
--
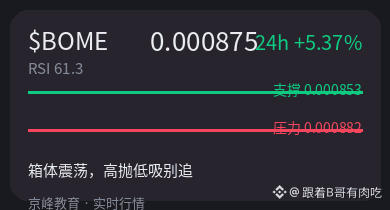
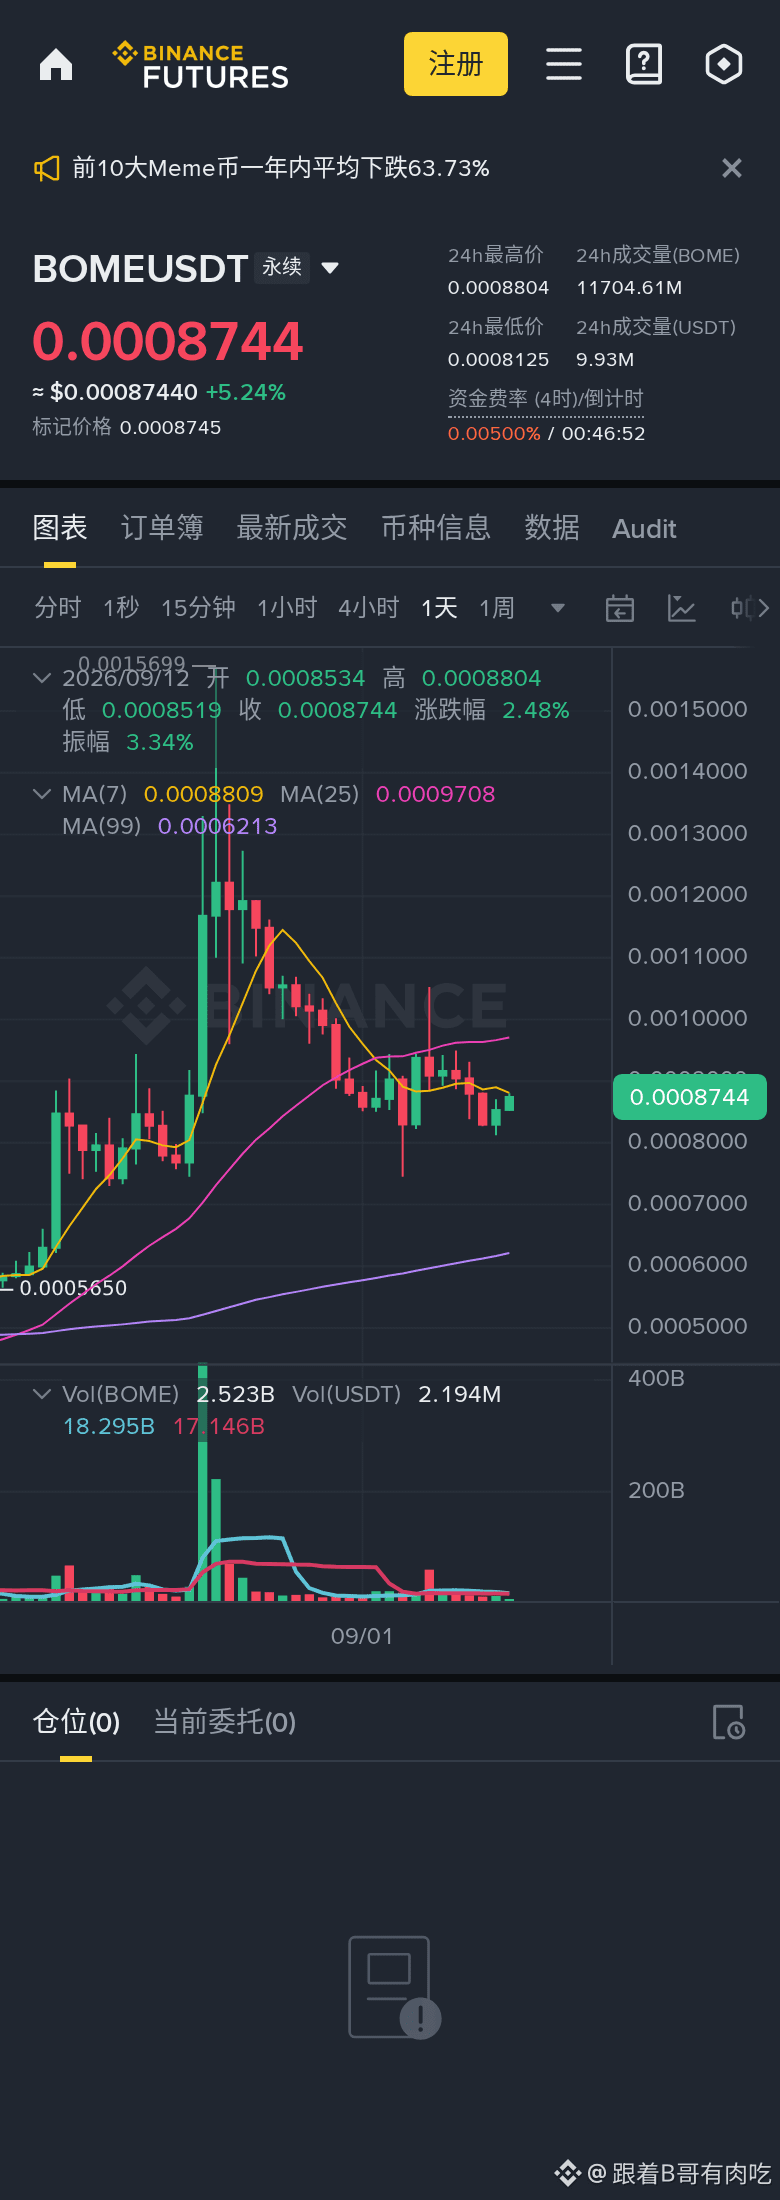
BOME current price 0.000875 · 24h +5.4% · RSI 61.3|Support 0.000853 / Resistance 0.000882, range trading high-sell low-buy|Distance to resistance: 0.8%/Distance to support: 2.5%, sideways oscillation
In the BOME choppy market, the biggest taboo is an itchy hand. I’d rather keep my money idle than move it around randomly.
① BOME shows volume-price divergence; smart money is running, so I’m reducing as well.
② When the funding rate spikes very high (longs pay), I’m actually more cautious about BOME pumping to distribute—I'll reduce first out of respect.
③ Let me tell a real story: when BOME couldn’t rise any further, 0.000882 pressed down hard. I chose to lock in profits first.
BOME is stuck in the 0.000853~0.000882 range, current price 0.000875, RSI 61.3. I won’t bet on a one-way move in this kind of oscillation—I'll go long only when 0.000882 breaks out; if 0.000853 breaks down, I’ll exit directly. I won’t move in between.
Stop-loss isn’t admitting defeat—it’s leaving myself the chips to come back next time. First figure out how much you can afford to lose, then think about how much you can make.
This is the plan. Whether it’s right is decided by the market. Reference it if you want, but don’t blindly follow.
#BOME #币安广场 #sideways consolidation
BOME current price 0.000875 · 24h +5.4% · RSI 61.3|Support 0.000853 / Resistance 0.000882, range trading high-sell low-buy|Distance to resistance: 0.8%/Distance to support: 2.5%, sideways oscillation
In the BOME choppy market, the biggest taboo is an itchy hand. I’d rather keep my money idle than move it around randomly.
① BOME shows volume-price divergence; smart money is running, so I’m reducing as well.
② When the funding rate spikes very high (longs pay), I’m actually more cautious about BOME pumping to distribute—I'll reduce first out of respect.
③ Let me tell a real story: when BOME couldn’t rise any further, 0.000882 pressed down hard. I chose to lock in profits first.
BOME is stuck in the 0.000853~0.000882 range, current price 0.000875, RSI 61.3. I won’t bet on a one-way move in this kind of oscillation—I'll go long only when 0.000882 breaks out; if 0.000853 breaks down, I’ll exit directly. I won’t move in between.
Stop-loss isn’t admitting defeat—it’s leaving myself the chips to come back next time. First figure out how much you can afford to lose, then think about how much you can make.
This is the plan. Whether it’s right is decided by the market. Reference it if you want, but don’t blindly follow.
#BOME #币安广场 #sideways consolidation
In the BOME choppy market, the biggest taboo is an itchy hand. I’d rather keep my money idle than move it around randomly.
① BOME shows volume-price divergence; smart money is running, so I’m reducing as well.
② When the funding rate spikes very high (longs pay), I’m actually more cautious about BOME pumping to distribute—I'll reduce first out of respect.
③ Let me tell a real story: when BOME couldn’t rise any further, 0.000882 pressed down hard. I chose to lock in profits first.
BOME is stuck in the 0.000853~0.000882 range, current price 0.000875, RSI 61.3. I won’t bet on a one-way move in this kind of oscillation—I'll go long only when 0.000882 breaks out; if 0.000853 breaks down, I’ll exit directly. I won’t move in between.
Stop-loss isn’t admitting defeat—it’s leaving myself the chips to come back next time. First figure out how much you can afford to lose, then think about how much you can make.
This is the plan. Whether it’s right is decided by the market. Reference it if you want, but don’t blindly follow.
#BOME #币安广场 #sideways consolidation
62
·
--
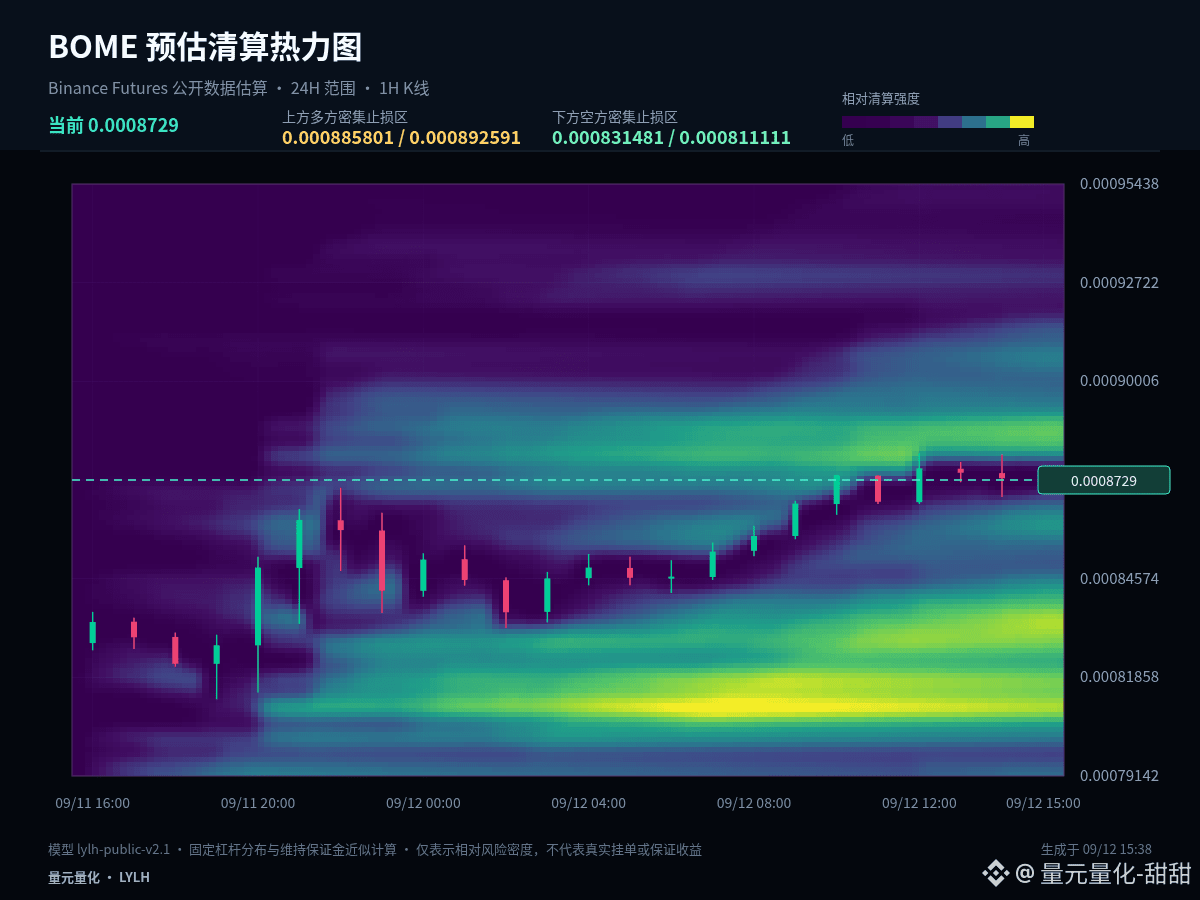
$BOME #BOME has been running for nearly 24 hours, reaching the upper boundary of the range. The most important thing to confirm at this point is whether there will be a valid breakout, or just a spike followed by a pullback.
The current price is close to the upper limit of the past 24 hours’ fluctuation: 1 hour -0.03%, 24 hours +5.17%. The key at the high end is to verify the market’s acceptance after a breakout. If the price can stay above the upper band, it indicates the market acknowledges a higher range. If it only briefly pierces and quickly retreats, you need to guard against a false breakout.
On key price levels, 0.00084815 is the mid-axis that a weak-side recovery must reclaim. If the price can’t stand back above it, any rebound should still be treated as a technical correction. Below, 0.0008146 still has the potential to be tested again. Only after reclaiming the mid-axis do you gain the qualification to further observe 0.0008817.
My scenario analysis isn’t betting on a single direction. A breakout above 0.0008817 with sustained holding would mean the upside space has been reopened. If it breaks below 0.0008146 and fails to rebound, it would indicate the structure weakens further. If it trades between the two, then continue to watch the closing behavior on both sides of 0.00084815.
For those who already have positions, the focus should be on whether support has failed when managing risk—not being dragged around by every fluctuation. For those who are flat, prioritize waiting for a breakout retest or confirmation of support. Spot positions can be built in batches, while for contracts you should shorten the decision chain: first determine the stop-loss level, then decide whether to participate.
The real disagreement in this market comes down to whether it will continue the move or return to the range. Will you wait for confirmation of the breakout, or wait for a support retest? Share the price level you’re watching most closely.
#EtherRalliesAsBearishBetsLiquidate
$BOME #BOME has been running for nearly 24 hours, reaching the upper boundary of the range. The most important thing to confirm at this point is whether there will be a valid breakout, or just a spike followed by a pullback.
The current price is close to the upper limit of the past 24 hours’ fluctuation: 1 hour -0.03%, 24 hours +5.17%. The key at the high end is to verify the market’s acceptance after a breakout. If the price can stay above the upper band, it indicates the market acknowledges a higher range. If it only briefly pierces and quickly retreats, you need to guard against a false breakout.
On key price levels, 0.00084815 is the mid-axis that a weak-side recovery must reclaim. If the price can’t stand back above it, any rebound should still be treated as a technical correction. Below, 0.0008146 still has the potential to be tested again. Only after reclaiming the mid-axis do you gain the qualification to further observe 0.0008817.
My scenario analysis isn’t betting on a single direction. A breakout above 0.0008817 with sustained holding would mean the upside space has been reopened. If it breaks below 0.0008146 and fails to rebound, it would indicate the structure weakens further. If it trades between the two, then continue to watch the closing behavior on both sides of 0.00084815.
For those who already have positions, the focus should be on whether support has failed when managing risk—not being dragged around by every fluctuation. For those who are flat, prioritize waiting for a breakout retest or confirmation of support. Spot positions can be built in batches, while for contracts you should shorten the decision chain: first determine the stop-loss level, then decide whether to participate.
The real disagreement in this market comes down to whether it will continue the move or return to the range. Will you wait for confirmation of the breakout, or wait for a support retest? Share the price level you’re watching most closely.
#EtherRalliesAsBearishBetsLiquidate
The current price is close to the upper limit of the past 24 hours’ fluctuation: 1 hour -0.03%, 24 hours +5.17%. The key at the high end is to verify the market’s acceptance after a breakout. If the price can stay above the upper band, it indicates the market acknowledges a higher range. If it only briefly pierces and quickly retreats, you need to guard against a false breakout.
On key price levels, 0.00084815 is the mid-axis that a weak-side recovery must reclaim. If the price can’t stand back above it, any rebound should still be treated as a technical correction. Below, 0.0008146 still has the potential to be tested again. Only after reclaiming the mid-axis do you gain the qualification to further observe 0.0008817.
My scenario analysis isn’t betting on a single direction. A breakout above 0.0008817 with sustained holding would mean the upside space has been reopened. If it breaks below 0.0008146 and fails to rebound, it would indicate the structure weakens further. If it trades between the two, then continue to watch the closing behavior on both sides of 0.00084815.
For those who already have positions, the focus should be on whether support has failed when managing risk—not being dragged around by every fluctuation. For those who are flat, prioritize waiting for a breakout retest or confirmation of support. Spot positions can be built in batches, while for contracts you should shorten the decision chain: first determine the stop-loss level, then decide whether to participate.
The real disagreement in this market comes down to whether it will continue the move or return to the range. Will you wait for confirmation of the breakout, or wait for a support retest? Share the price level you’re watching most closely.
#EtherRalliesAsBearishBetsLiquidate
4
·
--
$BOME #BOME In a strong market, drawdowns are often more revealing of true underlying support than a rapid surge. Currently, the past 1 hour is +0.60%, and the past 24 hours is +0.43%. We need to determine whether this is normal cooling or a structural weakening.
Currently, the past 1 hour is +0.60% and the past 24 hours is +0.43%. These two timeframes have not formed a sufficiently clear, aligned move in the same direction. In a range-bound market, the tolerance for chasing or selling in panic is low. It’s more suitable to confirm direction using the upper boundary, confirm support using the lower boundary, and use the midline only as the line dividing strength vs. weakness.
The short-term initiative has not been clearly broken yet. 0.0008435 is the primary standard for the quality of the pullback. If it holds and then tests 0.0008724, that indicates a relatively strong consolidation. If it breaks below the midline and stays there, shift the observation focus downward to 0.0008146.
My scenario planning is not betting on just one direction. If price breaks above 0.0008724 and can hold, it means upside space has been reopened. If it breaks below 0.0008146 and fails to rebound, it indicates further structural weakness. If it trades between the two, then continue to watch the closing behavior on both sides of 0.0008435.
Position sizing should distinguish between spot and futures. For existing spot positions, manage in segments around key levels and don’t frequently switch bias due to one hourly candlestick. Going to cash and waiting for confirmation allows for more composed, phased entries. Futures place greater emphasis on entry location and invalidation conditions. When volatility increases, proactively reduce position size to avoid turning short-term judgment into passive holding.
The key for futures is not to predict every single candlestick, but to ensure that entry, trimming, and exiting are all supported by logic. If there’s no confirmation, do less. If a key level fails, redo the plan. First control single-trade risk, then talk about subsequent upside/downside space.
#CPIWatch
$BOME #BOME In a strong market, drawdowns are often more revealing of true underlying support than a rapid surge. Currently, the past 1 hour is +0.60%, and the past 24 hours is +0.43%. We need to determine whether this is normal cooling or a structural weakening.
Currently, the past 1 hour is +0.60% and the past 24 hours is +0.43%. These two timeframes have not formed a sufficiently clear, aligned move in the same direction. In a range-bound market, the tolerance for chasing or selling in panic is low. It’s more suitable to confirm direction using the upper boundary, confirm support using the lower boundary, and use the midline only as the line dividing strength vs. weakness.
The short-term initiative has not been clearly broken yet. 0.0008435 is the primary standard for the quality of the pullback. If it holds and then tests 0.0008724, that indicates a relatively strong consolidation. If it breaks below the midline and stays there, shift the observation focus downward to 0.0008146.
My scenario planning is not betting on just one direction. If price breaks above 0.0008724 and can hold, it means upside space has been reopened. If it breaks below 0.0008146 and fails to rebound, it indicates further structural weakness. If it trades between the two, then continue to watch the closing behavior on both sides of 0.0008435.
Position sizing should distinguish between spot and futures. For existing spot positions, manage in segments around key levels and don’t frequently switch bias due to one hourly candlestick. Going to cash and waiting for confirmation allows for more composed, phased entries. Futures place greater emphasis on entry location and invalidation conditions. When volatility increases, proactively reduce position size to avoid turning short-term judgment into passive holding.
The key for futures is not to predict every single candlestick, but to ensure that entry, trimming, and exiting are all supported by logic. If there’s no confirmation, do less. If a key level fails, redo the plan. First control single-trade risk, then talk about subsequent upside/downside space.
#CPIWatch
Currently, the past 1 hour is +0.60% and the past 24 hours is +0.43%. These two timeframes have not formed a sufficiently clear, aligned move in the same direction. In a range-bound market, the tolerance for chasing or selling in panic is low. It’s more suitable to confirm direction using the upper boundary, confirm support using the lower boundary, and use the midline only as the line dividing strength vs. weakness.
The short-term initiative has not been clearly broken yet. 0.0008435 is the primary standard for the quality of the pullback. If it holds and then tests 0.0008724, that indicates a relatively strong consolidation. If it breaks below the midline and stays there, shift the observation focus downward to 0.0008146.
My scenario planning is not betting on just one direction. If price breaks above 0.0008724 and can hold, it means upside space has been reopened. If it breaks below 0.0008146 and fails to rebound, it indicates further structural weakness. If it trades between the two, then continue to watch the closing behavior on both sides of 0.0008435.
Position sizing should distinguish between spot and futures. For existing spot positions, manage in segments around key levels and don’t frequently switch bias due to one hourly candlestick. Going to cash and waiting for confirmation allows for more composed, phased entries. Futures place greater emphasis on entry location and invalidation conditions. When volatility increases, proactively reduce position size to avoid turning short-term judgment into passive holding.
The key for futures is not to predict every single candlestick, but to ensure that entry, trimming, and exiting are all supported by logic. If there’s no confirmation, do less. If a key level fails, redo the plan. First control single-trade risk, then talk about subsequent upside/downside space.
#CPIWatch

8

Log in to explore more content
Join global crypto users on Binance Square
⚡️ Get latest and useful information about crypto.
💬 Trusted by the world’s largest crypto exchange.
👍 Discover real insights from verified creators.
Email / Phone number
Trending Topics
1
#FedRateWatch
824,453 views
3,915 Discussing
2
#BitcoinFalls4%
2,051 views
137 Discussing
3
#SKHynixInTalksToMakeMemoryChipsInUS
27 views
15 Discussing
4
#OpenAIDiscussesNewFundingAt$1.2TValuation
297 views
22 Discussing
5
#ArgentinaCommitsToOECDCryptoReportingBy2029
6,393 views
205 Discussing
6
#EthereumFallsBelow$2400
3,560 views
78 Discussing
7
#USDTLaunchesOnZamaPrivacyProtocol
2,671 views
115 Discussing
8
#USSenateBlocksClarityAct
25,589 views
357 Discussing
9
#BitcoinSlidesTo$76000
36,464 views
162 Discussing
10
#BitcoinReboundsTo$79K
67,743 views
437 Discussing