
#tra100d
tra100d
20,020 views
170 Discussing
Hot
Latest

·
--
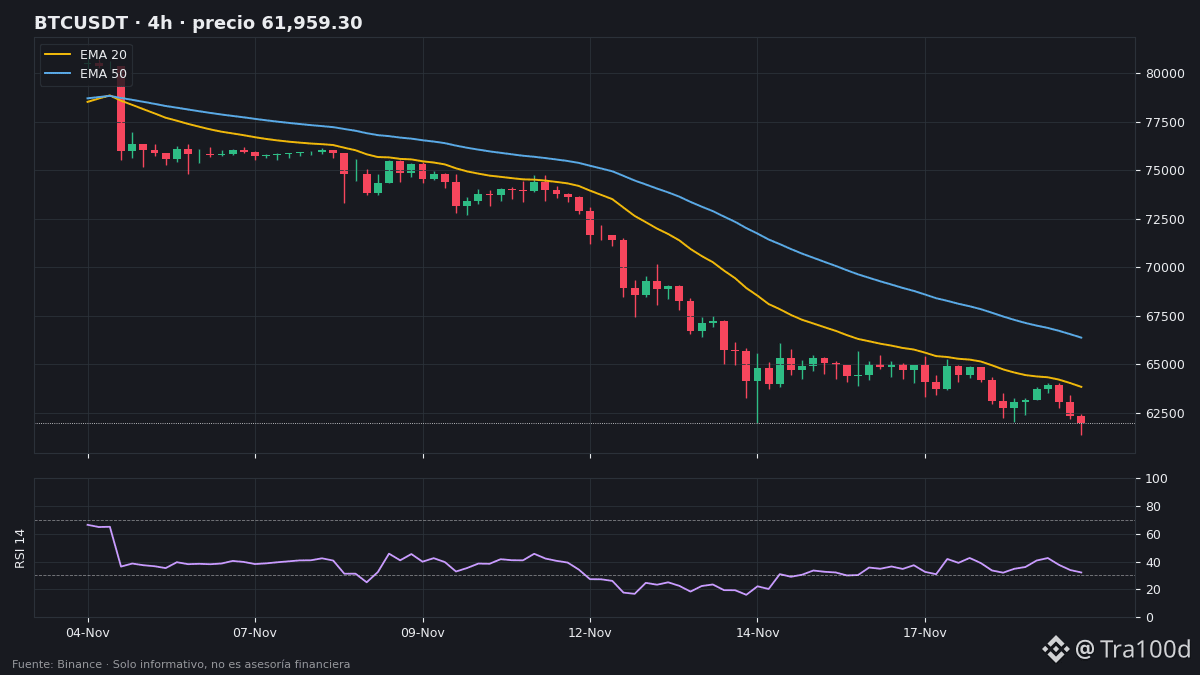
📉 New low on strong volume: $BTC failed to reclaim its 4 h EMA 20, bottomed at 61.375,2 $ and is trading at 62.027,99 $ (−1,43 % in 24 h, 1.248,4 M$ spot) with Fear and Greed at 12 (Extreme Fear).
📊 Context (Binance):
• 4 h: closed at 61.959,3 $ (−1,71 % over 6 candles), below EMA 20 (63.834,3 $) and EMA 50 (66.373,3 $), RSI 32,1 and volume at 1,73x
• 1d: closes at 61.959,3 $ (−9,26 % in 6 days), RSI 20,3 (extreme oversold), volume at 1,46x and far from EMA 200 (74.494,3 $)
• Futures: OI rises to 96.999 BTC (+0,73 %) with funding nearly flat (+0,0020 %)
📏 Key levels:
• Immediate support: 61.375,2 $ (new 20-candle low on 4 h and 1d)
• 4 h resistance: 63.834,3 $ (EMA 20), 65.500,2 $ (20-candle high) and 66.373,3 $ (EMA 50)
• ATR: 1.115 $ on 4 h (1,80 %) and 2.667 $ on 1d (4,30 %)
🟢 Bullish: holding 61.375,2 $ and closing above 63.834,3 $ on 4 h would open the way toward 65.500,2 $ and 66.373,3 $.
🔴 Bearish: losing 61.375,2 $ on elevated volume (>1,5x) and rising OI would extend the downward pressure.
👀 What to watch: whether the 4 h RSI can hold above 30 while defending 61.375 $.
Will $BTC hold the 61.375 $ floor, or will we see another sweep below? 👇
#BTC #Bitcoin #AnalisisTecnico #Cripto #Tra100d
⚠️ For informational and educational purposes only; not financial advice. Cryptocurrencies are volatile: do your own research and trade with caution.
📉 New low on strong volume: $BTC failed to reclaim its 4 h EMA 20, bottomed at 61.375,2 $ and is trading at 62.027,99 $ (−1,43 % in 24 h, 1.248,4 M$ spot) with Fear and Greed at 12 (Extreme Fear).
📊 Context (Binance):
• 4 h: closed at 61.959,3 $ (−1,71 % over 6 candles), below EMA 20 (63.834,3 $) and EMA 50 (66.373,3 $), RSI 32,1 and volume at 1,73x
• 1d: closes at 61.959,3 $ (−9,26 % in 6 days), RSI 20,3 (extreme oversold), volume at 1,46x and far from EMA 200 (74.494,3 $)
• Futures: OI rises to 96.999 BTC (+0,73 %) with funding nearly flat (+0,0020 %)
📏 Key levels:
• Immediate support: 61.375,2 $ (new 20-candle low on 4 h and 1d)
• 4 h resistance: 63.834,3 $ (EMA 20), 65.500,2 $ (20-candle high) and 66.373,3 $ (EMA 50)
• ATR: 1.115 $ on 4 h (1,80 %) and 2.667 $ on 1d (4,30 %)
🟢 Bullish: holding 61.375,2 $ and closing above 63.834,3 $ on 4 h would open the way toward 65.500,2 $ and 66.373,3 $.
🔴 Bearish: losing 61.375,2 $ on elevated volume (>1,5x) and rising OI would extend the downward pressure.
👀 What to watch: whether the 4 h RSI can hold above 30 while defending 61.375 $.
Will $BTC hold the 61.375 $ floor, or will we see another sweep below? 👇
#BTC #Bitcoin #AnalisisTecnico #Cripto #Tra100d
⚠️ For informational and educational purposes only; not financial advice. Cryptocurrencies are volatile: do your own research and trade with caution.
📊 Context (Binance):
• 4 h: closed at 61.959,3 $ (−1,71 % over 6 candles), below EMA 20 (63.834,3 $) and EMA 50 (66.373,3 $), RSI 32,1 and volume at 1,73x
• 1d: closes at 61.959,3 $ (−9,26 % in 6 days), RSI 20,3 (extreme oversold), volume at 1,46x and far from EMA 200 (74.494,3 $)
• Futures: OI rises to 96.999 BTC (+0,73 %) with funding nearly flat (+0,0020 %)
📏 Key levels:
• Immediate support: 61.375,2 $ (new 20-candle low on 4 h and 1d)
• 4 h resistance: 63.834,3 $ (EMA 20), 65.500,2 $ (20-candle high) and 66.373,3 $ (EMA 50)
• ATR: 1.115 $ on 4 h (1,80 %) and 2.667 $ on 1d (4,30 %)
🟢 Bullish: holding 61.375,2 $ and closing above 63.834,3 $ on 4 h would open the way toward 65.500,2 $ and 66.373,3 $.
🔴 Bearish: losing 61.375,2 $ on elevated volume (>1,5x) and rising OI would extend the downward pressure.
👀 What to watch: whether the 4 h RSI can hold above 30 while defending 61.375 $.
Will $BTC hold the 61.375 $ floor, or will we see another sweep below? 👇
#BTC #Bitcoin #AnalisisTecnico #Cripto #Tra100d
⚠️ For informational and educational purposes only; not financial advice. Cryptocurrencies are volatile: do your own research and trade with caution.
34
·
--
🧠 When a coin drops after doubling in price, many look for a bounce, thinking “the shakeout is over.” How can you tell from the data whether the risk has passed?
📘 What falling price + rising Open Interest (OI) after a vertical rally indicates:
• **No leverage flush:** aggressive shorts enter, along with longs trying to call the bottom.
• **ATR spiking:** wide candles sweep stops on both sides.
• **Daily overbought conditions still active:** the 4h chart is cooling off, but the 1d chart is still carrying excess.
📊 Today’s example on Binance:
• After yesterday’s +111% (4h RSI at 89), $MMT is down **−21.71%** today ($0.2012, −16.0% over 6 4h candles). Its 4h RSI fell to 60.7, but OI rose **+9.41%** (107.7 M MMT), its 4h ATR reached **13.30%**, and the daily RSI is still at **77.9**.
• By contrast: $NEAR is up **+1.92%** ($3.395), above its 4h EMA 50, with RSI at **58.5**, OI at **+0.68%**, and 4h ATR at **3.53%**.
❌ Common mistake: buying the first pullback while OI is rising and ATR is > 10%.
📝 In one line: a healthy correction sheds OI and volatility; if OI rises, the storm is still raging.
Do you wait for OI and ATR to fall after a +100% move, or trade the first bounce? 👇
#EducacionCripto #FuturosCripto #MMT #NEAR #Tra100d
⚠️ For informational and educational purposes only; this is not financial advice. Cryptocurrencies are volatile: do your own research and trade with caution.
🧠 When a coin drops after doubling in price, many look for a bounce, thinking “the shakeout is over.” How can you tell from the data whether the risk has passed?
📘 What falling price + rising Open Interest (OI) after a vertical rally indicates:
• **No leverage flush:** aggressive shorts enter, along with longs trying to call the bottom.
• **ATR spiking:** wide candles sweep stops on both sides.
• **Daily overbought conditions still active:** the 4h chart is cooling off, but the 1d chart is still carrying excess.
📊 Today’s example on Binance:
• After yesterday’s +111% (4h RSI at 89), $MMT is down **−21.71%** today ($0.2012, −16.0% over 6 4h candles). Its 4h RSI fell to 60.7, but OI rose **+9.41%** (107.7 M MMT), its 4h ATR reached **13.30%**, and the daily RSI is still at **77.9**.
• By contrast: $NEAR is up **+1.92%** ($3.395), above its 4h EMA 50, with RSI at **58.5**, OI at **+0.68%**, and 4h ATR at **3.53%**.
❌ Common mistake: buying the first pullback while OI is rising and ATR is > 10%.
📝 In one line: a healthy correction sheds OI and volatility; if OI rises, the storm is still raging.
Do you wait for OI and ATR to fall after a +100% move, or trade the first bounce? 👇
#EducacionCripto #FuturosCripto #MMT #NEAR #Tra100d
⚠️ For informational and educational purposes only; this is not financial advice. Cryptocurrencies are volatile: do your own research and trade with caution.
📘 What falling price + rising Open Interest (OI) after a vertical rally indicates:
• **No leverage flush:** aggressive shorts enter, along with longs trying to call the bottom.
• **ATR spiking:** wide candles sweep stops on both sides.
• **Daily overbought conditions still active:** the 4h chart is cooling off, but the 1d chart is still carrying excess.
📊 Today’s example on Binance:
• After yesterday’s +111% (4h RSI at 89), $MMT is down **−21.71%** today ($0.2012, −16.0% over 6 4h candles). Its 4h RSI fell to 60.7, but OI rose **+9.41%** (107.7 M MMT), its 4h ATR reached **13.30%**, and the daily RSI is still at **77.9**.
• By contrast: $NEAR is up **+1.92%** ($3.395), above its 4h EMA 50, with RSI at **58.5**, OI at **+0.68%**, and 4h ATR at **3.53%**.
❌ Common mistake: buying the first pullback while OI is rising and ATR is > 10%.
📝 In one line: a healthy correction sheds OI and volatility; if OI rises, the storm is still raging.
Do you wait for OI and ATR to fall after a +100% move, or trade the first bounce? 👇
#EducacionCripto #FuturosCripto #MMT #NEAR #Tra100d
⚠️ For informational and educational purposes only; this is not financial advice. Cryptocurrencies are volatile: do your own research and trade with caution.
93
·
--
🚨 False breakout on the 4h: the morning bounce faded, and $NEAR, SOL, and XRP have just closed below their 20 EMAs on Binance, with above-average volume and Extreme Fear at 12.
📊 Key levels snapshot (4h close):
• $NEAR falls −2.46% to $3.209 ($83.1M vol.): after touching $3.475, it closes the 4h at $3.206 (−2.88% over 6 candles) and loses its 50 EMA ($3.355) and 20 EMA ($3.292), with RSI at 44.0, volume at 1.15x, OI up +0.54%, and negative funding (−0.0037%).
• $SOL trades at $73.20 (−0.40%, $159.3M) and closes the 4h at $73.11, giving up its 20 EMA ($73.78), with RSI at 44.7, volume at 1.11x, and OI up +1.46%.
• $XRP sits at $0.9613 (−0.58%, $113.6M) and closes the 4h at $0.9599, below its 20 EMA ($0.9730), with RSI at 43.7, volume at 1.05x, and OI down −1.19%.
👀 Key 4h levels: for NEAR, reclaim $3.292 or watch $3.095 and the daily 200 EMA ($3.001); for SOL, reclaim $73.78 or defend $70.19; for XRP, move back above $0.9730 or test $0.9451.
#NEAR #SOL #XRP #Cripto #Tra100d
⚠️ For informational and educational purposes only; this is not financial advice. Cryptocurrencies are volatile: do your own research and trade with caution.
🚨 False breakout on the 4h: the morning bounce faded, and $NEAR , SOL, and XRP have just closed below their 20 EMAs on Binance, with above-average volume and Extreme Fear at 12.
📊 Key levels snapshot (4h close):
• $NEAR falls −2.46% to $3.209 ($83.1M vol.): after touching $3.475, it closes the 4h at $3.206 (−2.88% over 6 candles) and loses its 50 EMA ($3.355) and 20 EMA ($3.292), with RSI at 44.0, volume at 1.15x, OI up +0.54%, and negative funding (−0.0037%).
• $SOL trades at $73.20 (−0.40%, $159.3M) and closes the 4h at $73.11, giving up its 20 EMA ($73.78), with RSI at 44.7, volume at 1.11x, and OI up +1.46%.
• $XRP sits at $0.9613 (−0.58%, $113.6M) and closes the 4h at $0.9599, below its 20 EMA ($0.9730), with RSI at 43.7, volume at 1.05x, and OI down −1.19%.
👀 Key 4h levels: for NEAR, reclaim $3.292 or watch $3.095 and the daily 200 EMA ($3.001); for SOL, reclaim $73.78 or defend $70.19; for XRP, move back above $0.9730 or test $0.9451.
#NEAR #SOL #XRP #Cripto #Tra100d
⚠️ For informational and educational purposes only; this is not financial advice. Cryptocurrencies are volatile: do your own research and trade with caution.
📊 Key levels snapshot (4h close):
• $NEAR falls −2.46% to $3.209 ($83.1M vol.): after touching $3.475, it closes the 4h at $3.206 (−2.88% over 6 candles) and loses its 50 EMA ($3.355) and 20 EMA ($3.292), with RSI at 44.0, volume at 1.15x, OI up +0.54%, and negative funding (−0.0037%).
• $SOL trades at $73.20 (−0.40%, $159.3M) and closes the 4h at $73.11, giving up its 20 EMA ($73.78), with RSI at 44.7, volume at 1.11x, and OI up +1.46%.
• $XRP sits at $0.9613 (−0.58%, $113.6M) and closes the 4h at $0.9599, below its 20 EMA ($0.9730), with RSI at 43.7, volume at 1.05x, and OI down −1.19%.
👀 Key 4h levels: for NEAR, reclaim $3.292 or watch $3.095 and the daily 200 EMA ($3.001); for SOL, reclaim $73.78 or defend $70.19; for XRP, move back above $0.9730 or test $0.9451.
#NEAR #SOL #XRP #Cripto #Tra100d
⚠️ For informational and educational purposes only; this is not financial advice. Cryptocurrencies are volatile: do your own research and trade with caution.
121
·
--
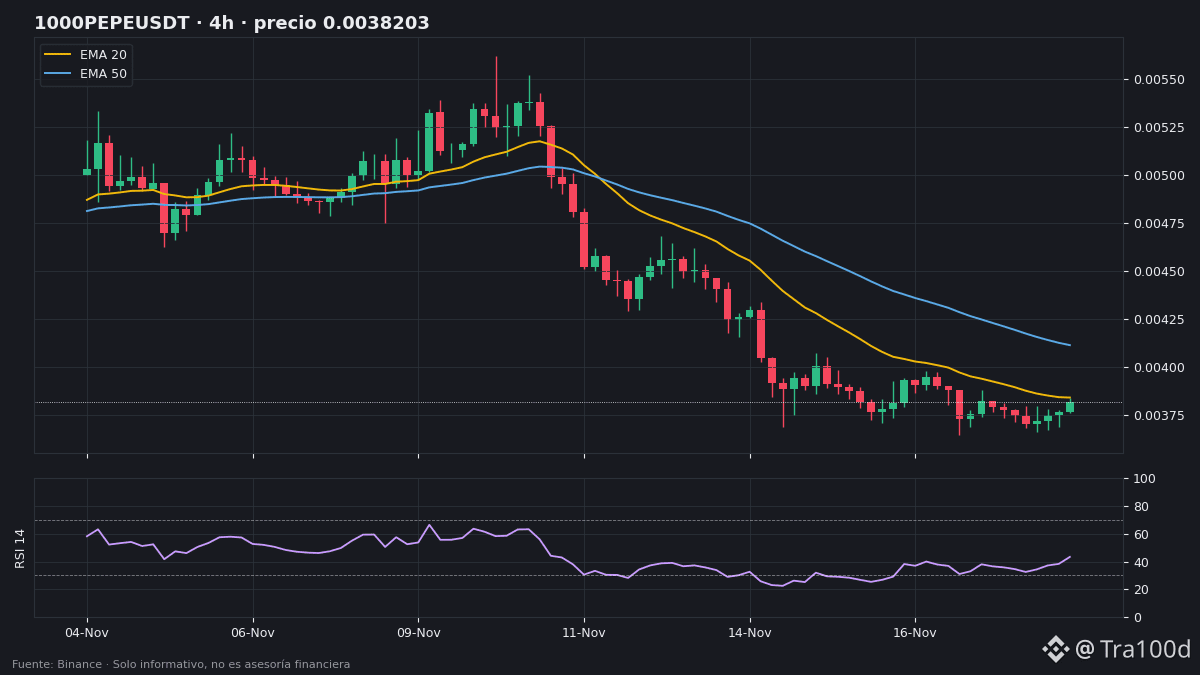
🐸 Meme sector is entirely in the green as BTC slips −0.73%: the 6 major memecoins are advancing on Binance today, with PEPE leading the way at +3.48% over 24 h ($0.00000387, $18.3M in volume).
📊 Meme market snapshot today:
• $PEPE (`1000PEPE`) closed the 4 h candle at $0.003820 (+1.21% across 6 candles), with RSI at 43.3, hugging its 4 h EMA 20 ($0.003841); on the 1d chart it dipped slightly below its EMA 200 ($0.003787), but the mark price ($0.003863) is now back above it, with OI up +4.92% and funding at +0.0100%.
• $DOGE leads meme volume ($21.6M) at $0.05939 (+0.27%): it closes the 4 h candle at $0.05954, just above its EMA 20 ($0.05946), with RSI at 47.4 and OI up +2.24%.
• $WIF is up +0.82% ($0.1349) and above its 4 h EMA 20 ($0.1347); SHIB is up +0.78% with OI up +6.77%, FLOKI +0.23% (OI up +5.59%), and BONK +0.42%, with the only negative funding rate (−0.0054%).
📏 `1000PEPE` levels (4 h): resistance at $0.003841 (EMA 20) and $0.003978; support at $0.003648.
⚡ Risk: PEPE's (11.4%) and BONK's (9.2%) daily ATRs are nearly triple BTC's (4.2%).
Will PEPE consolidate above its daily EMA 200, or do you have more confidence in DOGE above $0.0595? 👇
#PEPE #DOGE #WIF #Memecoin #Tra100d
⚠️ For informational and educational purposes only; this is not financial advice. Cryptocurrencies are volatile: do your own research and trade with caution.
🐸 Meme sector is entirely in the green as BTC slips −0.73%: the 6 major memecoins are advancing on Binance today, with PEPE leading the way at +3.48% over 24 h ($0.00000387, $18.3M in volume).
📊 Meme market snapshot today:
• $PEPE (`1000PEPE`) closed the 4 h candle at $0.003820 (+1.21% across 6 candles), with RSI at 43.3, hugging its 4 h EMA 20 ($0.003841); on the 1d chart it dipped slightly below its EMA 200 ($0.003787), but the mark price ($0.003863) is now back above it, with OI up +4.92% and funding at +0.0100%.
• $DOGE leads meme volume ($21.6M) at $0.05939 (+0.27%): it closes the 4 h candle at $0.05954, just above its EMA 20 ($0.05946), with RSI at 47.4 and OI up +2.24%.
• $WIF is up +0.82% ($0.1349) and above its 4 h EMA 20 ($0.1347); SHIB is up +0.78% with OI up +6.77%, FLOKI +0.23% (OI up +5.59%), and BONK +0.42%, with the only negative funding rate (−0.0054%).
📏 `1000PEPE` levels (4 h): resistance at $0.003841 (EMA 20) and $0.003978; support at $0.003648.
⚡ Risk: PEPE's (11.4%) and BONK's (9.2%) daily ATRs are nearly triple BTC's (4.2%).
Will PEPE consolidate above its daily EMA 200, or do you have more confidence in DOGE above $0.0595? 👇
#PEPE #DOGE #WIF #Memecoin #Tra100d
⚠️ For informational and educational purposes only; this is not financial advice. Cryptocurrencies are volatile: do your own research and trade with caution.
📊 Meme market snapshot today:
• $PEPE (`1000PEPE`) closed the 4 h candle at $0.003820 (+1.21% across 6 candles), with RSI at 43.3, hugging its 4 h EMA 20 ($0.003841); on the 1d chart it dipped slightly below its EMA 200 ($0.003787), but the mark price ($0.003863) is now back above it, with OI up +4.92% and funding at +0.0100%.
• $DOGE leads meme volume ($21.6M) at $0.05939 (+0.27%): it closes the 4 h candle at $0.05954, just above its EMA 20 ($0.05946), with RSI at 47.4 and OI up +2.24%.
• $WIF is up +0.82% ($0.1349) and above its 4 h EMA 20 ($0.1347); SHIB is up +0.78% with OI up +6.77%, FLOKI +0.23% (OI up +5.59%), and BONK +0.42%, with the only negative funding rate (−0.0054%).
📏 `1000PEPE` levels (4 h): resistance at $0.003841 (EMA 20) and $0.003978; support at $0.003648.
⚡ Risk: PEPE's (11.4%) and BONK's (9.2%) daily ATRs are nearly triple BTC's (4.2%).
Will PEPE consolidate above its daily EMA 200, or do you have more confidence in DOGE above $0.0595? 👇
#PEPE #DOGE #WIF #Memecoin #Tra100d
⚠️ For informational and educational purposes only; this is not financial advice. Cryptocurrencies are volatile: do your own research and trade with caution.
128
·
--
📊 The Fear and Greed Index falls from 11 to 10 (Extreme Fear), while the Binance session shows two contrasting sides: a plunge after the euphoria in MMT and strength in altcoins maintaining their long-term trend.
📌 3 key data points from the day:
• $MMT leads the declines, down −21.71% in 24 h to $0.2012 ($32.8 M traded), a −16.0% move over 6 four-hour candles after yesterday’s +111%; its 4-hour ATR climbs to 13.3%, but OI continues to rise +9.41% (107.7 M MMT), with daily RSI still overbought (77.9).
• On the bullish side, $NEAR leads among liquid gainers, up +1.92% to $3.395 ($72.9 M): it closes the 4-hour candle at $3.426, above its 20 EMA ($3.296) and 50 EMA ($3.367), with RSI at 58.5 and volume at 1.16x. It is followed by $ZEC (+1.48% to $949.61, $118.2 M, 4th in volume), TRX (+0.90%), BNB (+0.38%), and DOGE (+0.25%).
• Among the biggest decliners after MMT are XAUT (−1.03% to $3,720.77), BTC (−0.73% to $63,750.51, $1,212.6 M), XRP (−0.65% to $0.9818), and ENA (−0.63% to $0.1110).
🔍 Why it matters: capital is fleeing overheated vertical rebounds and rewarding the few assets holding their structure above the daily 200 EMA.
Rotation into NEAR and ZEC, or would you rather wait for BTC confirmation? 👇
#MMT #NEAR #ZEC #MercadoCripto #Tra100d
⚠️ For informational and educational purposes only; this is not financial advice. Cryptocurrencies are volatile: do your own research and trade with caution.
📊 The Fear and Greed Index falls from 11 to 10 (Extreme Fear), while the Binance session shows two contrasting sides: a plunge after the euphoria in MMT and strength in altcoins maintaining their long-term trend.
📌 3 key data points from the day:
• $MMT leads the declines, down −21.71% in 24 h to $0.2012 ($32.8 M traded), a −16.0% move over 6 four-hour candles after yesterday’s +111%; its 4-hour ATR climbs to 13.3%, but OI continues to rise +9.41% (107.7 M MMT), with daily RSI still overbought (77.9).
• On the bullish side, $NEAR leads among liquid gainers, up +1.92% to $3.395 ($72.9 M): it closes the 4-hour candle at $3.426, above its 20 EMA ($3.296) and 50 EMA ($3.367), with RSI at 58.5 and volume at 1.16x. It is followed by $ZEC (+1.48% to $949.61, $118.2 M, 4th in volume), TRX (+0.90%), BNB (+0.38%), and DOGE (+0.25%).
• Among the biggest decliners after MMT are XAUT (−1.03% to $3,720.77), BTC (−0.73% to $63,750.51, $1,212.6 M), XRP (−0.65% to $0.9818), and ENA (−0.63% to $0.1110).
🔍 Why it matters: capital is fleeing overheated vertical rebounds and rewarding the few assets holding their structure above the daily 200 EMA.
Rotation into NEAR and ZEC, or would you rather wait for BTC confirmation? 👇
#MMT #NEAR #ZEC #MercadoCripto #Tra100d
⚠️ For informational and educational purposes only; this is not financial advice. Cryptocurrencies are volatile: do your own research and trade with caution.
📌 3 key data points from the day:
• $MMT leads the declines, down −21.71% in 24 h to $0.2012 ($32.8 M traded), a −16.0% move over 6 four-hour candles after yesterday’s +111%; its 4-hour ATR climbs to 13.3%, but OI continues to rise +9.41% (107.7 M MMT), with daily RSI still overbought (77.9).
• On the bullish side, $NEAR leads among liquid gainers, up +1.92% to $3.395 ($72.9 M): it closes the 4-hour candle at $3.426, above its 20 EMA ($3.296) and 50 EMA ($3.367), with RSI at 58.5 and volume at 1.16x. It is followed by $ZEC (+1.48% to $949.61, $118.2 M, 4th in volume), TRX (+0.90%), BNB (+0.38%), and DOGE (+0.25%).
• Among the biggest decliners after MMT are XAUT (−1.03% to $3,720.77), BTC (−0.73% to $63,750.51, $1,212.6 M), XRP (−0.65% to $0.9818), and ENA (−0.63% to $0.1110).
🔍 Why it matters: capital is fleeing overheated vertical rebounds and rewarding the few assets holding their structure above the daily 200 EMA.
Rotation into NEAR and ZEC, or would you rather wait for BTC confirmation? 👇
#MMT #NEAR #ZEC #MercadoCripto #Tra100d
⚠️ For informational and educational purposes only; this is not financial advice. Cryptocurrencies are volatile: do your own research and trade with caution.
133
·
--
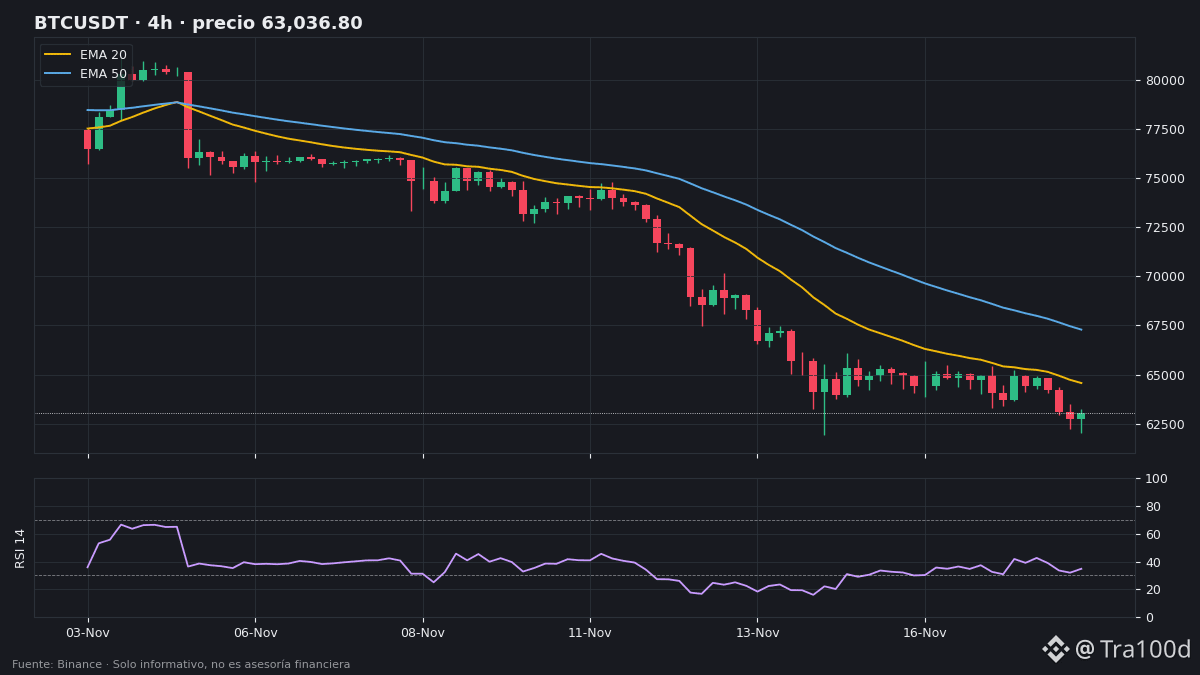
📉 Double bottom or breakdown? $BTC falls to $62,738.01 (−2.59% in 24 h, $1,200.5 M spot volume) as Fear and Greed drops from 11 to 10 (Extreme Fear).
📊 Context (Binance):
• On the 4h chart, it closed at $63,036.8 (−2.90% in 6 candles), below its EMA 20 ($64,574.7), with RSI at 34.8 and volume at its average (0.99x)
• On the 1d chart, it closed at $63,036.8 with RSI at 21.5 (extreme oversold), volume at 1.19x, and down 11.7% in 6 days, below its EMA 200 ($74,447.2)
• In futures, OI is up +4.66% to 96,298 BTC with funding nearly flat (+0.0042%), signaling positions entering amid the sharp decline
📏 Key levels:
• Supports: $62,030.8 (20-candle low on the 4h chart) and $61,956.3 (20-day low)
• 4h resistance: $64,574.7 (EMA 20), $65,679.2 (20-candle high), and $67,290.2 (EMA 50)
• ATR: $1,199 on the 4h chart (1.90%) and $2,665 on the 1d chart (4.23%)
🟢 Bullish: holding $61,956–$62,031 and reclaiming the 4h EMA 20 ($64,574.7) with volume (>1x) would open the way to $65,679.2 and $67,290.2.
🔴 Bearish: a 4h close below $61,956.3 with OI rising would increase the risk of a sweep below the 20-day range.
👀 What to watch: volume and OI if it tests the $62,000 area.
Will $BTC hold $61,956 or give way at the 20-day low? 👇
#BTC #Bitcoin #AnalisisTecnico #Cripto #Tra100d
⚠️ For informational and educational purposes only; this is not financial advice. Cryptocurrencies are volatile: do your own research and trade with caution.
📉 Double bottom or breakdown? $BTC falls to $62,738.01 (−2.59% in 24 h, $1,200.5 M spot volume) as Fear and Greed drops from 11 to 10 (Extreme Fear).
📊 Context (Binance):
• On the 4h chart, it closed at $63,036.8 (−2.90% in 6 candles), below its EMA 20 ($64,574.7), with RSI at 34.8 and volume at its average (0.99x)
• On the 1d chart, it closed at $63,036.8 with RSI at 21.5 (extreme oversold), volume at 1.19x, and down 11.7% in 6 days, below its EMA 200 ($74,447.2)
• In futures, OI is up +4.66% to 96,298 BTC with funding nearly flat (+0.0042%), signaling positions entering amid the sharp decline
📏 Key levels:
• Supports: $62,030.8 (20-candle low on the 4h chart) and $61,956.3 (20-day low)
• 4h resistance: $64,574.7 (EMA 20), $65,679.2 (20-candle high), and $67,290.2 (EMA 50)
• ATR: $1,199 on the 4h chart (1.90%) and $2,665 on the 1d chart (4.23%)
🟢 Bullish: holding $61,956–$62,031 and reclaiming the 4h EMA 20 ($64,574.7) with volume (>1x) would open the way to $65,679.2 and $67,290.2.
🔴 Bearish: a 4h close below $61,956.3 with OI rising would increase the risk of a sweep below the 20-day range.
👀 What to watch: volume and OI if it tests the $62,000 area.
Will $BTC hold $61,956 or give way at the 20-day low? 👇
#BTC #Bitcoin #AnalisisTecnico #Cripto #Tra100d
⚠️ For informational and educational purposes only; this is not financial advice. Cryptocurrencies are volatile: do your own research and trade with caution.
📊 Context (Binance):
• On the 4h chart, it closed at $63,036.8 (−2.90% in 6 candles), below its EMA 20 ($64,574.7), with RSI at 34.8 and volume at its average (0.99x)
• On the 1d chart, it closed at $63,036.8 with RSI at 21.5 (extreme oversold), volume at 1.19x, and down 11.7% in 6 days, below its EMA 200 ($74,447.2)
• In futures, OI is up +4.66% to 96,298 BTC with funding nearly flat (+0.0042%), signaling positions entering amid the sharp decline
📏 Key levels:
• Supports: $62,030.8 (20-candle low on the 4h chart) and $61,956.3 (20-day low)
• 4h resistance: $64,574.7 (EMA 20), $65,679.2 (20-candle high), and $67,290.2 (EMA 50)
• ATR: $1,199 on the 4h chart (1.90%) and $2,665 on the 1d chart (4.23%)
🟢 Bullish: holding $61,956–$62,031 and reclaiming the 4h EMA 20 ($64,574.7) with volume (>1x) would open the way to $65,679.2 and $67,290.2.
🔴 Bearish: a 4h close below $61,956.3 with OI rising would increase the risk of a sweep below the 20-day range.
👀 What to watch: volume and OI if it tests the $62,000 area.
Will $BTC hold $61,956 or give way at the 20-day low? 👇
#BTC #Bitcoin #AnalisisTecnico #Cripto #Tra100d
⚠️ For informational and educational purposes only; this is not financial advice. Cryptocurrencies are volatile: do your own research and trade with caution.
105
·
--
🚨 End-of-day update: with BTC down −2.59% ($62,738) and Fear & Greed dropping from 11 to 10, XRP and SOL lose the cushion of their short-term 4h moving averages, while NEAR is the only one still holding above them.
📊 Binance snapshot (4h):
• $XRP trades at $0.9620 (−1.18% in 24h, $98.3M in volume) and closes the 4h candle at $0.9670 (−1.67% over 6 candles), below its EMA 20 ($0.9742), with RSI at 45.8, OI down 2.06% (258.1M XRP), and negative funding (−0.0060%).
• $SOL gives up −1.49% to $73.35 ($165.7M, 3rd in volume) and closes at $73.60 (−2.06% over 6 candles), just below its EMA 20 ($73.66), with RSI at 47.3, OI down 1.35%, and slightly positive funding (+0.0044%).
• $NEAR closes at $3.301 (−2.71% over 6 candles), but still holds above its 4h EMA 20 ($3.271) and daily EMA 200 ($2.987), with RSI at 51.2 and OI up 0.81%.
👀 Key 4h levels: for XRP, reclaim $0.9742 or watch support at $0.9415; for SOL, reclaim $73.66 en route to $75.74 or watch $69.87; for NEAR, hold $3.271, with $3.364 (EMA 50) as the next target.
#XRP #SOL #NEAR #Cripto #Tra100d
⚠️ For informational and educational purposes only; this is not financial advice. Cryptocurrencies are volatile: do your own research and trade with caution.
🚨 End-of-day update: with BTC down −2.59% ($62,738) and Fear & Greed dropping from 11 to 10, XRP and SOL lose the cushion of their short-term 4h moving averages, while NEAR is the only one still holding above them.
📊 Binance snapshot (4h):
• $XRP trades at $0.9620 (−1.18% in 24h, $98.3M in volume) and closes the 4h candle at $0.9670 (−1.67% over 6 candles), below its EMA 20 ($0.9742), with RSI at 45.8, OI down 2.06% (258.1M XRP), and negative funding (−0.0060%).
• $SOL gives up −1.49% to $73.35 ($165.7M, 3rd in volume) and closes at $73.60 (−2.06% over 6 candles), just below its EMA 20 ($73.66), with RSI at 47.3, OI down 1.35%, and slightly positive funding (+0.0044%).
• $NEAR closes at $3.301 (−2.71% over 6 candles), but still holds above its 4h EMA 20 ($3.271) and daily EMA 200 ($2.987), with RSI at 51.2 and OI up 0.81%.
👀 Key 4h levels: for XRP, reclaim $0.9742 or watch support at $0.9415; for SOL, reclaim $73.66 en route to $75.74 or watch $69.87; for NEAR, hold $3.271, with $3.364 (EMA 50) as the next target.
#XRP #SOL #NEAR #Cripto #Tra100d
⚠️ For informational and educational purposes only; this is not financial advice. Cryptocurrencies are volatile: do your own research and trade with caution.
📊 Binance snapshot (4h):
• $XRP trades at $0.9620 (−1.18% in 24h, $98.3M in volume) and closes the 4h candle at $0.9670 (−1.67% over 6 candles), below its EMA 20 ($0.9742), with RSI at 45.8, OI down 2.06% (258.1M XRP), and negative funding (−0.0060%).
• $SOL gives up −1.49% to $73.35 ($165.7M, 3rd in volume) and closes at $73.60 (−2.06% over 6 candles), just below its EMA 20 ($73.66), with RSI at 47.3, OI down 1.35%, and slightly positive funding (+0.0044%).
• $NEAR closes at $3.301 (−2.71% over 6 candles), but still holds above its 4h EMA 20 ($3.271) and daily EMA 200 ($2.987), with RSI at 51.2 and OI up 0.81%.
👀 Key 4h levels: for XRP, reclaim $0.9742 or watch support at $0.9415; for SOL, reclaim $73.66 en route to $75.74 or watch $69.87; for NEAR, hold $3.271, with $3.364 (EMA 50) as the next target.
#XRP #SOL #NEAR #Cripto #Tra100d
⚠️ For informational and educational purposes only; this is not financial advice. Cryptocurrencies are volatile: do your own research and trade with caution.
121
·
--
🧠 When a coin rises +100% in a day during Extreme Fear, FOMO sets in. How can you tell from the data whether the momentum is still healthy or has entered a high-risk whipsaw zone?
📘 The 3 signs of overheating in futures:
• **4 h RSI > 85:** it has risen so quickly in just a few candles that the risk of a sharp correction multiplies.
• **OI explosion (>100% in 24 h):** late leverage is entering perpetuals rather than spot buying.
• **4 h ATR > 7%:** a single normal 4 h candle swings 7–8% and sweeps tight stops.
📊 Today's example on Binance:
• $MMT is up +111.15% in 24 h ($0.2424 on spot and $0.2533 on 4 h), with a 4 h RSI of **89.4**, daily volume at **55.3x** its average, OI surging **+118.8%** (107.4 M MMT), and a 4 h ATR of **7.56%**.
• Compare it with $NEAR (+3.51% to $3.359): it is above its 4 h EMA 20 ($3.279), with RSI at **54.0**, OI at **+3.7%**, and a 4 h ATR of **3.53%**.
❌ Common mistake: entering with leverage when the 4 h RSI is above 85 and OI has doubled.
📝 In one line: healthy trends build with RSI between 50 and 65 and gradual OI growth—not an RSI of 89.
What RSI limit do you use to avoid chasing a rally? 👇
#EducacionCripto #AnalisisTecnico #MMT #NEAR #Tra100d
⚠️ For informational and educational purposes only; this is not financial advice. Cryptocurrencies are volatile: do your own research and trade with caution.
🧠 When a coin rises +100% in a day during Extreme Fear, FOMO sets in. How can you tell from the data whether the momentum is still healthy or has entered a high-risk whipsaw zone?
📘 The 3 signs of overheating in futures:
• **4 h RSI > 85:** it has risen so quickly in just a few candles that the risk of a sharp correction multiplies.
• **OI explosion (>100% in 24 h):** late leverage is entering perpetuals rather than spot buying.
• **4 h ATR > 7%:** a single normal 4 h candle swings 7–8% and sweeps tight stops.
📊 Today's example on Binance:
• $MMT is up +111.15% in 24 h ($0.2424 on spot and $0.2533 on 4 h), with a 4 h RSI of **89.4**, daily volume at **55.3x** its average, OI surging **+118.8%** (107.4 M MMT), and a 4 h ATR of **7.56%**.
• Compare it with $NEAR (+3.51% to $3.359): it is above its 4 h EMA 20 ($3.279), with RSI at **54.0**, OI at **+3.7%**, and a 4 h ATR of **3.53%**.
❌ Common mistake: entering with leverage when the 4 h RSI is above 85 and OI has doubled.
📝 In one line: healthy trends build with RSI between 50 and 65 and gradual OI growth—not an RSI of 89.
What RSI limit do you use to avoid chasing a rally? 👇
#EducacionCripto #AnalisisTecnico #MMT #NEAR #Tra100d
⚠️ For informational and educational purposes only; this is not financial advice. Cryptocurrencies are volatile: do your own research and trade with caution.
📘 The 3 signs of overheating in futures:
• **4 h RSI > 85:** it has risen so quickly in just a few candles that the risk of a sharp correction multiplies.
• **OI explosion (>100% in 24 h):** late leverage is entering perpetuals rather than spot buying.
• **4 h ATR > 7%:** a single normal 4 h candle swings 7–8% and sweeps tight stops.
📊 Today's example on Binance:
• $MMT is up +111.15% in 24 h ($0.2424 on spot and $0.2533 on 4 h), with a 4 h RSI of **89.4**, daily volume at **55.3x** its average, OI surging **+118.8%** (107.4 M MMT), and a 4 h ATR of **7.56%**.
• Compare it with $NEAR (+3.51% to $3.359): it is above its 4 h EMA 20 ($3.279), with RSI at **54.0**, OI at **+3.7%**, and a 4 h ATR of **3.53%**.
❌ Common mistake: entering with leverage when the 4 h RSI is above 85 and OI has doubled.
📝 In one line: healthy trends build with RSI between 50 and 65 and gradual OI growth—not an RSI of 89.
What RSI limit do you use to avoid chasing a rally? 👇
#EducacionCripto #AnalisisTecnico #MMT #NEAR #Tra100d
⚠️ For informational and educational purposes only; this is not financial advice. Cryptocurrencies are volatile: do your own research and trade with caution.
187
·
--
Article
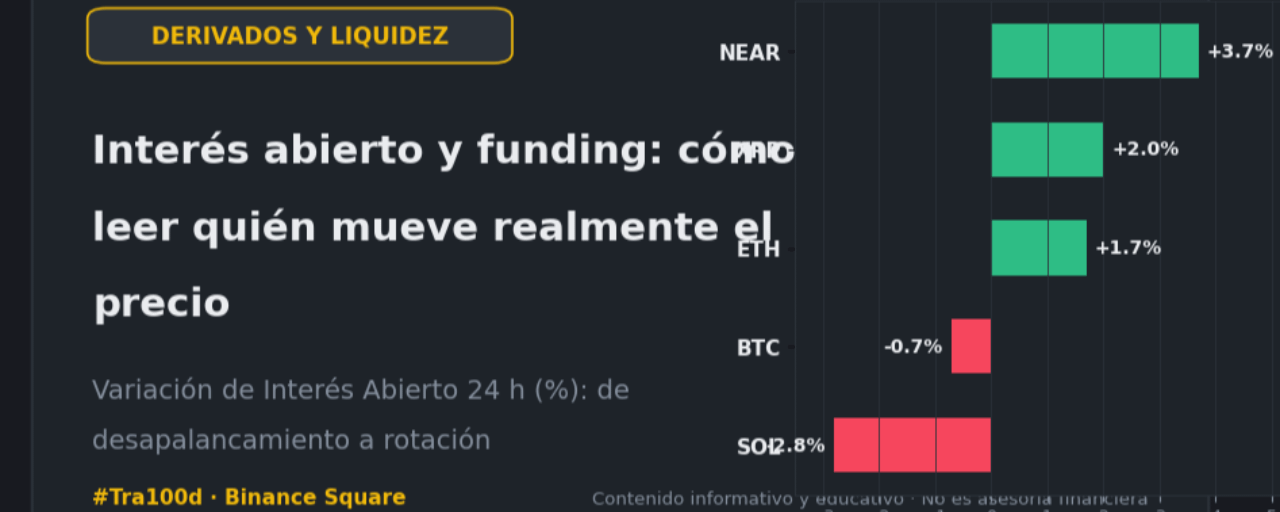
Open interest and funding rate: how to distinguish real buying from short covering or euphoria
Looking only at a cryptocurrency’s percentage gain or loss over 24 hours tells you what happened to the price, but it doesn’t explain **who is funding that move**. In a market dominated by perpetual futures contracts, two identical 3% rises can conceal opposite dynamics: one may be backed by fresh demand and trapped shorts, while the other is simply the closing of positions, with no buying conviction.
To understand what is happening beneath the candlestick chart, simply compare two public derivatives metrics: the change in **Open Interest (OI)** and the **funding rate**.
Looking only at a cryptocurrency’s percentage gain or loss over 24 hours tells you what happened to the price, but it doesn’t explain **who is funding that move**. In a market dominated by perpetual futures contracts, two identical 3% rises can conceal opposite dynamics: one may be backed by fresh demand and trapped shorts, while the other is simply the closing of positions, with no buying conviction.
To understand what is happening beneath the candlestick chart, simply compare two public derivatives metrics: the change in **Open Interest (OI)** and the **funding rate**.
Open interest and funding rate: how to distinguish real buying from short covering or euphoria
Looking only at a cryptocurrency’s percentage gain or loss over 24 hours tells you what happened to the price, but it doesn’t explain **who is funding that move**. In a market dominated by perpetual futures contracts, two identical 3% rises can conceal opposite dynamics: one may be backed by fresh demand and trapped shorts, while the other is simply the closing of positions, with no buying conviction.
To understand what is happening beneath the candlestick chart, simply compare two public derivatives metrics: the change in **Open Interest (OI)** and the **funding rate**.
108
·
--
📊 The Fear and Greed Index drops from 12 to 11 (Extreme Fear), and the market is divided: while BTC and ETH give up ~1.5%, a group of altcoins strongly decouples on Binance.
📌 3 key facts of the day:
• $MMT leads the day's explosion with +111,15 % in 24 h to 0,2424 $ (36,9 M$ in spot volume): over 4 h, it closes at 0,2533 $ (+88,2 % in 6 candles) with RSI in extreme overbought territory (89,4), daily volume at 55,3x its average, and open interest surging +118,8 % (107,4 M MMT).
• Among large caps, $NEAR advances +3,51 % to 3,359 $ (78,4 M$ traded), moving above its 4 h EMA 20 (3,279 $) with RSI at 54,0, +3,7 % OI, and a bullish/ranging daily structure above its EMA 200 (2,982 $), alongside $XRP (+1,39 % to 0,9879 $, 108,4 M$), TRX (+1,14 % to 0,3101 $), and SOL (+0,79 % to 74,37 $, 190,6 M$).
• On the other side, the biggest declines among liquid pairs are led by ASTER (−3,62 % to 0,5513 $, +5,3 % OI), ENA (−3,51 % to 0,1128 $), UNI (−3,22 % to 5,228 $), ETH (−1,54 % to 1.795,25 $), and ZEC (−1,52 % to 935,44 $).
🔍 Why it matters: in Extreme Fear, liquidity doesn't rise across the board; it rotates toward assets holding their 4 h EMA 20.
Do you see NEAR and XRP continuing, or are you waiting for BTC confirmation? 👇
#MMT #NEAR #XRP #MercadoCripto #Tra100d
⚠️ For informational and educational purposes only; this is not financial advice. Cryptocurrencies are volatile: do your own research and trade with caution.
📊 The Fear and Greed Index drops from 12 to 11 (Extreme Fear), and the market is divided: while BTC and ETH give up ~1.5%, a group of altcoins strongly decouples on Binance.
📌 3 key facts of the day:
• $MMT leads the day's explosion with +111,15 % in 24 h to 0,2424 $ (36,9 M$ in spot volume): over 4 h, it closes at 0,2533 $ (+88,2 % in 6 candles) with RSI in extreme overbought territory (89,4), daily volume at 55,3x its average, and open interest surging +118,8 % (107,4 M MMT).
• Among large caps, $NEAR advances +3,51 % to 3,359 $ (78,4 M$ traded), moving above its 4 h EMA 20 (3,279 $) with RSI at 54,0, +3,7 % OI, and a bullish/ranging daily structure above its EMA 200 (2,982 $), alongside $XRP (+1,39 % to 0,9879 $, 108,4 M$), TRX (+1,14 % to 0,3101 $), and SOL (+0,79 % to 74,37 $, 190,6 M$).
• On the other side, the biggest declines among liquid pairs are led by ASTER (−3,62 % to 0,5513 $, +5,3 % OI), ENA (−3,51 % to 0,1128 $), UNI (−3,22 % to 5,228 $), ETH (−1,54 % to 1.795,25 $), and ZEC (−1,52 % to 935,44 $).
🔍 Why it matters: in Extreme Fear, liquidity doesn't rise across the board; it rotates toward assets holding their 4 h EMA 20.
Do you see NEAR and XRP continuing, or are you waiting for BTC confirmation? 👇
#MMT #NEAR #XRP #MercadoCripto #Tra100d
⚠️ For informational and educational purposes only; this is not financial advice. Cryptocurrencies are volatile: do your own research and trade with caution.
📌 3 key facts of the day:
• $MMT leads the day's explosion with +111,15 % in 24 h to 0,2424 $ (36,9 M$ in spot volume): over 4 h, it closes at 0,2533 $ (+88,2 % in 6 candles) with RSI in extreme overbought territory (89,4), daily volume at 55,3x its average, and open interest surging +118,8 % (107,4 M MMT).
• Among large caps, $NEAR advances +3,51 % to 3,359 $ (78,4 M$ traded), moving above its 4 h EMA 20 (3,279 $) with RSI at 54,0, +3,7 % OI, and a bullish/ranging daily structure above its EMA 200 (2,982 $), alongside $XRP (+1,39 % to 0,9879 $, 108,4 M$), TRX (+1,14 % to 0,3101 $), and SOL (+0,79 % to 74,37 $, 190,6 M$).
• On the other side, the biggest declines among liquid pairs are led by ASTER (−3,62 % to 0,5513 $, +5,3 % OI), ENA (−3,51 % to 0,1128 $), UNI (−3,22 % to 5,228 $), ETH (−1,54 % to 1.795,25 $), and ZEC (−1,52 % to 935,44 $).
🔍 Why it matters: in Extreme Fear, liquidity doesn't rise across the board; it rotates toward assets holding their 4 h EMA 20.
Do you see NEAR and XRP continuing, or are you waiting for BTC confirmation? 👇
#MMT #NEAR #XRP #MercadoCripto #Tra100d
⚠️ For informational and educational purposes only; this is not financial advice. Cryptocurrencies are volatile: do your own research and trade with caution.
171
·
--
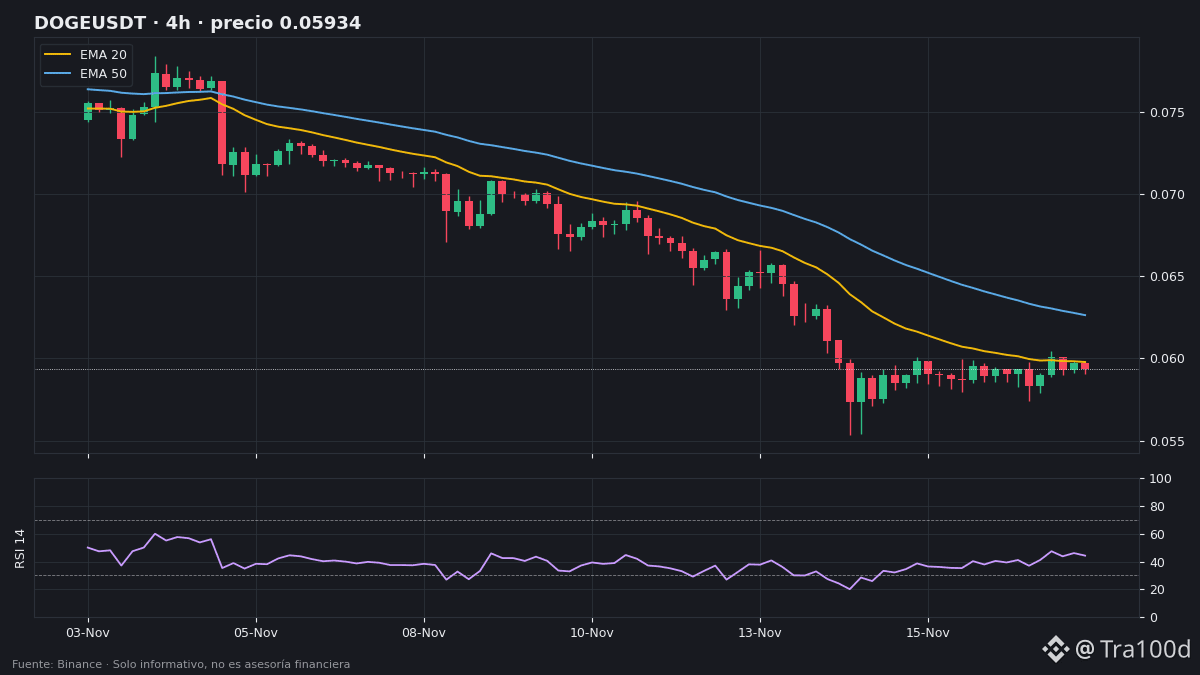
🐕 While the market pulls back, DOGE is the memecoin holding up best on Binance today: trading at $0.05942 (−0.05% in 24h with $19.7M in volume) while PEPE retests its 200-day average.
📊 Meme sector snapshot today:
• $DOGE closed at $0.05934 on the 4h timeframe (−0.02% over 6 candles) with RSI at 44.3, hovering near its 4h EMA 20 ($0.05979); open interest is up +1.30% (2,293M DOGE), with funding at +0.0036% and daily RSI in oversold territory (29.1).
• $PEPE leads meme volume ($19.9M) at $0.00000378 (−1.82%); `1000PEPE` ($0.003747 on 4h and $0.003824 on 1d) is testing its daily EMA 200 ($0.003779)—the only meme with a bullish/range-bound daily structure—with OI down −0.37% and neutral funding (+0.0006%).
• $WIF is down −0.15% to $0.1345 (+1.62% OI, 4h RSI at 42.3), SHIB −0.26% ($0.00000384, funding −0.0055%), BONK −0.42% ($0.00000237, −1.46% OI), and FLOKI −2.09% ($0.00001779, +1.76% OI and 4h volume at 1.11x).
📏 DOGE levels: 4h resistance at $0.05979 (EMA 20) and $0.06045 (20-candle high); support at $0.05711.
⚡ Risk: PEPE's (11.7%) and BONK's (9.2%) daily ATR exceed DOGE's (6.5%) and BTC's (4.1%).
Will PEPE defend its daily EMA 200, or do you see DOGE holding firmer on its way to $0.060? 👇
#DOGE #PEPE #WIF #Memecoin #Tra100d
⚠️ For informational and educational purposes only; this is not financial advice. Cryptocurrencies are volatile: do your own research and trade with caution.
🐕 While the market pulls back, DOGE is the memecoin holding up best on Binance today: trading at $0.05942 (−0.05% in 24h with $19.7M in volume) while PEPE retests its 200-day average.
📊 Meme sector snapshot today:
• $DOGE closed at $0.05934 on the 4h timeframe (−0.02% over 6 candles) with RSI at 44.3, hovering near its 4h EMA 20 ($0.05979); open interest is up +1.30% (2,293M DOGE), with funding at +0.0036% and daily RSI in oversold territory (29.1).
• $PEPE leads meme volume ($19.9M) at $0.00000378 (−1.82%); `1000PEPE` ($0.003747 on 4h and $0.003824 on 1d) is testing its daily EMA 200 ($0.003779)—the only meme with a bullish/range-bound daily structure—with OI down −0.37% and neutral funding (+0.0006%).
• $WIF is down −0.15% to $0.1345 (+1.62% OI, 4h RSI at 42.3), SHIB −0.26% ($0.00000384, funding −0.0055%), BONK −0.42% ($0.00000237, −1.46% OI), and FLOKI −2.09% ($0.00001779, +1.76% OI and 4h volume at 1.11x).
📏 DOGE levels: 4h resistance at $0.05979 (EMA 20) and $0.06045 (20-candle high); support at $0.05711.
⚡ Risk: PEPE's (11.7%) and BONK's (9.2%) daily ATR exceed DOGE's (6.5%) and BTC's (4.1%).
Will PEPE defend its daily EMA 200, or do you see DOGE holding firmer on its way to $0.060? 👇
#DOGE #PEPE #WIF #Memecoin #Tra100d
⚠️ For informational and educational purposes only; this is not financial advice. Cryptocurrencies are volatile: do your own research and trade with caution.
📊 Meme sector snapshot today:
• $DOGE closed at $0.05934 on the 4h timeframe (−0.02% over 6 candles) with RSI at 44.3, hovering near its 4h EMA 20 ($0.05979); open interest is up +1.30% (2,293M DOGE), with funding at +0.0036% and daily RSI in oversold territory (29.1).
• $PEPE leads meme volume ($19.9M) at $0.00000378 (−1.82%); `1000PEPE` ($0.003747 on 4h and $0.003824 on 1d) is testing its daily EMA 200 ($0.003779)—the only meme with a bullish/range-bound daily structure—with OI down −0.37% and neutral funding (+0.0006%).
• $WIF is down −0.15% to $0.1345 (+1.62% OI, 4h RSI at 42.3), SHIB −0.26% ($0.00000384, funding −0.0055%), BONK −0.42% ($0.00000237, −1.46% OI), and FLOKI −2.09% ($0.00001779, +1.76% OI and 4h volume at 1.11x).
📏 DOGE levels: 4h resistance at $0.05979 (EMA 20) and $0.06045 (20-candle high); support at $0.05711.
⚡ Risk: PEPE's (11.7%) and BONK's (9.2%) daily ATR exceed DOGE's (6.5%) and BTC's (4.1%).
Will PEPE defend its daily EMA 200, or do you see DOGE holding firmer on its way to $0.060? 👇
#DOGE #PEPE #WIF #Memecoin #Tra100d
⚠️ For informational and educational purposes only; this is not financial advice. Cryptocurrencies are volatile: do your own research and trade with caution.
143
·
--
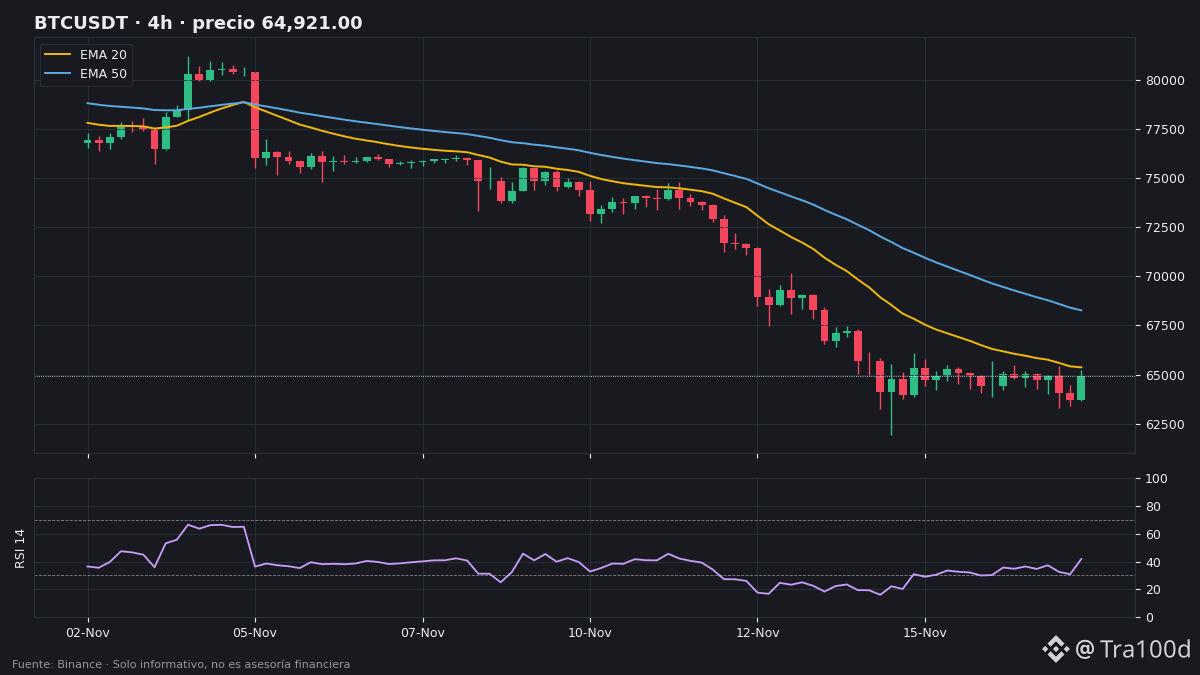
📈 Will it break above its short-term average tonight? $BTC is trading at $64,687.07 (−0.02% in 24h), with $1,793.0M in spot volume, while the Fear and Greed Index sits at 11 (Extreme Fear).
📊 Context (Binance):
• On the 4h chart, the latest candle closed at $64,921.0 (+0.10% over 6 candles), with the RSI recovering to 41.8 and relative volume at 0.75x
• On the 1d chart, the RSI remains oversold (23.9), with relative volume at 1.29x and a −12.2% pullback over 6 days
• In futures, open interest is down −0.6% at 92,007 BTC, and funding remains neutral (+0.0062%), with no excessive leverage
📏 Key levels:
• Support: $61,956.3 (20-candle low on the 4h and 1d charts)
• 4h resistance: $65,373.8 (EMA 20), $66,163.6 (20-candle high), and $68,271.2 (EMA 50)
• ATR: $1,279 on the 4h chart (1.97%) and $2,644 on the 1d chart (4.07%)
🟢 Bullish: A 4h close above the EMA 20 ($65,373.8) on volume (>1x) would open the way to $66,163.6 and $68,271.2.
🔴 Bearish: Rejection below $65,373.8 and a break below $64,000 would send the price back toward support at $61,956.3.
👀 What to watch: Whether buying volume (>1x) comes in as the price approaches the 4h EMA 20 at $65,373.8.
Do you think $BTC will break above $65,374 in the next 4h candles, or will it stay range-bound? 👇
#BTC #Bitcoin #AnalisisTecnico #Cripto #Tra100d
⚠️ For informational and educational purposes only; this is not financial advice. Cryptocurrencies are volatile: do your own research and trade with caution.
📈 Will it break above its short-term average tonight? $BTC is trading at $64,687.07 (−0.02% in 24h), with $1,793.0M in spot volume, while the Fear and Greed Index sits at 11 (Extreme Fear).
📊 Context (Binance):
• On the 4h chart, the latest candle closed at $64,921.0 (+0.10% over 6 candles), with the RSI recovering to 41.8 and relative volume at 0.75x
• On the 1d chart, the RSI remains oversold (23.9), with relative volume at 1.29x and a −12.2% pullback over 6 days
• In futures, open interest is down −0.6% at 92,007 BTC, and funding remains neutral (+0.0062%), with no excessive leverage
📏 Key levels:
• Support: $61,956.3 (20-candle low on the 4h and 1d charts)
• 4h resistance: $65,373.8 (EMA 20), $66,163.6 (20-candle high), and $68,271.2 (EMA 50)
• ATR: $1,279 on the 4h chart (1.97%) and $2,644 on the 1d chart (4.07%)
🟢 Bullish: A 4h close above the EMA 20 ($65,373.8) on volume (>1x) would open the way to $66,163.6 and $68,271.2.
🔴 Bearish: Rejection below $65,373.8 and a break below $64,000 would send the price back toward support at $61,956.3.
👀 What to watch: Whether buying volume (>1x) comes in as the price approaches the 4h EMA 20 at $65,373.8.
Do you think $BTC will break above $65,374 in the next 4h candles, or will it stay range-bound? 👇
#BTC #Bitcoin #AnalisisTecnico #Cripto #Tra100d
⚠️ For informational and educational purposes only; this is not financial advice. Cryptocurrencies are volatile: do your own research and trade with caution.
📊 Context (Binance):
• On the 4h chart, the latest candle closed at $64,921.0 (+0.10% over 6 candles), with the RSI recovering to 41.8 and relative volume at 0.75x
• On the 1d chart, the RSI remains oversold (23.9), with relative volume at 1.29x and a −12.2% pullback over 6 days
• In futures, open interest is down −0.6% at 92,007 BTC, and funding remains neutral (+0.0062%), with no excessive leverage
📏 Key levels:
• Support: $61,956.3 (20-candle low on the 4h and 1d charts)
• 4h resistance: $65,373.8 (EMA 20), $66,163.6 (20-candle high), and $68,271.2 (EMA 50)
• ATR: $1,279 on the 4h chart (1.97%) and $2,644 on the 1d chart (4.07%)
🟢 Bullish: A 4h close above the EMA 20 ($65,373.8) on volume (>1x) would open the way to $66,163.6 and $68,271.2.
🔴 Bearish: Rejection below $65,373.8 and a break below $64,000 would send the price back toward support at $61,956.3.
👀 What to watch: Whether buying volume (>1x) comes in as the price approaches the 4h EMA 20 at $65,373.8.
Do you think $BTC will break above $65,374 in the next 4h candles, or will it stay range-bound? 👇
#BTC #Bitcoin #AnalisisTecnico #Cripto #Tra100d
⚠️ For informational and educational purposes only; this is not financial advice. Cryptocurrencies are volatile: do your own research and trade with caution.
291
·
--
🚨 Strength in major altcoins: $SOL advances +4.41% in 24 h ( $74.83 spot with $236.1M in volume) and closes the latest 4 h candle at $75.15 (+5.08% over 6 candles), consolidating above its 4 h EMA 20 ($73.41) with RSI at 53.7, open interest down 3.3% (8.43M SOL), and slightly negative funding (−0.0006%).
📊 Alongside it, $XRP rises +2.26% to $0.9771 ($97.1M in volume) and closes at $0.9834 on the 4 h chart, already above its EMA 20 ($0.9713), with RSI at 51.3 and OI down 2.0%. Meanwhile, $ETH trades at $1,817.45 (−0.03%, $650.9M traded), with a 4 h close at $1,824.32 and a +2.8% rebound in open interest (2.35M ETH).
👀 Key 4 h levels: for SOL, hold $73.41 (EMA 20) to target $75.74 (20-candle high) and the EMA 50 ($77.45); for XRP, hold $0.9713 on the way to $0.9911 and $1.0154 (EMA 50); for ETH, break above $1,835.27 (EMA 20), with support at $1,710.01.
#SOL #XRP #ETH #Cripto #Tra100d
⚠️ For informational and educational purposes only; this is not financial advice. Cryptocurrencies are volatile: do your own research and trade with caution.
🚨 Strength in major altcoins: $SOL advances +4.41% in 24 h ( $74.83 spot with $236.1M in volume) and closes the latest 4 h candle at $75.15 (+5.08% over 6 candles), consolidating above its 4 h EMA 20 ($73.41) with RSI at 53.7, open interest down 3.3% (8.43M SOL), and slightly negative funding (−0.0006%).
📊 Alongside it, $XRP rises +2.26% to $0.9771 ($97.1M in volume) and closes at $0.9834 on the 4 h chart, already above its EMA 20 ($0.9713), with RSI at 51.3 and OI down 2.0%. Meanwhile, $ETH trades at $1,817.45 (−0.03%, $650.9M traded), with a 4 h close at $1,824.32 and a +2.8% rebound in open interest (2.35M ETH).
👀 Key 4 h levels: for SOL, hold $73.41 (EMA 20) to target $75.74 (20-candle high) and the EMA 50 ($77.45); for XRP, hold $0.9713 on the way to $0.9911 and $1.0154 (EMA 50); for ETH, break above $1,835.27 (EMA 20), with support at $1,710.01.
#SOL #XRP #ETH #Cripto #Tra100d
⚠️ For informational and educational purposes only; this is not financial advice. Cryptocurrencies are volatile: do your own research and trade with caution.
📊 Alongside it, $XRP rises +2.26% to $0.9771 ($97.1M in volume) and closes at $0.9834 on the 4 h chart, already above its EMA 20 ($0.9713), with RSI at 51.3 and OI down 2.0%. Meanwhile, $ETH trades at $1,817.45 (−0.03%, $650.9M traded), with a 4 h close at $1,824.32 and a +2.8% rebound in open interest (2.35M ETH).
👀 Key 4 h levels: for SOL, hold $73.41 (EMA 20) to target $75.74 (20-candle high) and the EMA 50 ($77.45); for XRP, hold $0.9713 on the way to $0.9911 and $1.0154 (EMA 50); for ETH, break above $1,835.27 (EMA 20), with support at $1,710.01.
#SOL #XRP #ETH #Cripto #Tra100d
⚠️ For informational and educational purposes only; this is not financial advice. Cryptocurrencies are volatile: do your own research and trade with caution.
208
·
--
🧠 In the midst of Extreme Fear, not all cryptocurrencies bounce the same way. How can you tell which ones are holding their underlying structure and which are only getting a brief relief bounce? The key is the **daily EMA 200**.
📘 The 2 key readings:
• **Above the daily EMA 200:** the underlying trend remains active; dips toward this average attract buyers and fuel faster bounces.
• **Below the daily EMA 200:** it acts as resistance; each oversold bounce runs into the shorter moving averages first (4-hour EMA 20/50).
📊 Today's examples on Binance:
• $ZEC defended its daily EMA 200 ($867.59), closed at $904.12 on the 1d chart, and is leading today with +8.42% to $949.97 (+7.5% OI).
• $PEPE (`1000PEPE`) held its daily EMA 200 ($0.003780), closed at $0.003904, and is up +2.39% today in a bullish/daily-range structure.
• By contrast, $BTC is trading at $64,880 below its daily EMA 200 ($74,499.7, 1d RSI at 23.6): its bounce (+1.33%) must first break above the 4-hour EMA 20 ($65,759).
❌ Common mistake: looking for a bounce in the asset that fell the most while ignoring those that held their daily EMA 200.
📝 In one line: in an oversold market, assets that respect their daily EMA 200 often lead the reversal.
Do you use the daily EMA 200 as a filter before trading? 👇
#EducacionCripto #AnalisisTecnico #ZEC #PEPE #Tra100d
⚠️ For informational and educational purposes only; this is not financial advice. Cryptocurrencies are volatile: do your own research and trade with caution.
🧠 In the midst of Extreme Fear, not all cryptocurrencies bounce the same way. How can you tell which ones are holding their underlying structure and which are only getting a brief relief bounce? The key is the **daily EMA 200**.
📘 The 2 key readings:
• **Above the daily EMA 200:** the underlying trend remains active; dips toward this average attract buyers and fuel faster bounces.
• **Below the daily EMA 200:** it acts as resistance; each oversold bounce runs into the shorter moving averages first (4-hour EMA 20/50).
📊 Today's examples on Binance:
• $ZEC defended its daily EMA 200 ($867.59), closed at $904.12 on the 1d chart, and is leading today with +8.42% to $949.97 (+7.5% OI).
• $PEPE (`1000PEPE`) held its daily EMA 200 ($0.003780), closed at $0.003904, and is up +2.39% today in a bullish/daily-range structure.
• By contrast, $BTC is trading at $64,880 below its daily EMA 200 ($74,499.7, 1d RSI at 23.6): its bounce (+1.33%) must first break above the 4-hour EMA 20 ($65,759).
❌ Common mistake: looking for a bounce in the asset that fell the most while ignoring those that held their daily EMA 200.
📝 In one line: in an oversold market, assets that respect their daily EMA 200 often lead the reversal.
Do you use the daily EMA 200 as a filter before trading? 👇
#EducacionCripto #AnalisisTecnico #ZEC #PEPE #Tra100d
⚠️ For informational and educational purposes only; this is not financial advice. Cryptocurrencies are volatile: do your own research and trade with caution.
📘 The 2 key readings:
• **Above the daily EMA 200:** the underlying trend remains active; dips toward this average attract buyers and fuel faster bounces.
• **Below the daily EMA 200:** it acts as resistance; each oversold bounce runs into the shorter moving averages first (4-hour EMA 20/50).
📊 Today's examples on Binance:
• $ZEC defended its daily EMA 200 ($867.59), closed at $904.12 on the 1d chart, and is leading today with +8.42% to $949.97 (+7.5% OI).
• $PEPE (`1000PEPE`) held its daily EMA 200 ($0.003780), closed at $0.003904, and is up +2.39% today in a bullish/daily-range structure.
• By contrast, $BTC is trading at $64,880 below its daily EMA 200 ($74,499.7, 1d RSI at 23.6): its bounce (+1.33%) must first break above the 4-hour EMA 20 ($65,759).
❌ Common mistake: looking for a bounce in the asset that fell the most while ignoring those that held their daily EMA 200.
📝 In one line: in an oversold market, assets that respect their daily EMA 200 often lead the reversal.
Do you use the daily EMA 200 as a filter before trading? 👇
#EducacionCripto #AnalisisTecnico #ZEC #PEPE #Tra100d
⚠️ For informational and educational purposes only; this is not financial advice. Cryptocurrencies are volatile: do your own research and trade with caution.
178
·
--
📊 After three days stuck at 10, the Fear and Greed Index rises to 12 (Extreme Fear), and the market responds with an upward turn across Binance’s most liquid pairs.
📌 3 key stats for the day:
• $ZEC leads the gains, up +8.42% to $949.97, with $153.2M in volume (4th most-traded pair): after defending its daily 200 EMA yesterday ($867.59), it moves above its 4-hour 20 EMA ($917.84), comes close to its 20-candle high ($951.89), and adds +7.5% in OI (492,000 ZEC) with positive funding (+0.0100%).
• Among the most liquid, it is followed by $HYPE (+5.88% to $69.51 with $51.9M in volume, above its 4-hour 20 EMA at $68.59 and testing its daily 200 EMA at $69.83, with OI down 5.0%), UNI (+5.17% to $5.353, $32.2M), NEAR (+4.31% to $3.294, $76.5M), and $SOL (+3.41% to $73.19, $206.9M).
• Broad-based gains: even the five liquid assets with the most modest advances today are trading in the green over 24 hours—BNB (+0.99% to $593.10), ETH (+1.20% to $1,816.03), ENA (+1.29% to $0.1177), BTC (+1.33% to $64,880.74), and DOGE (+1.47% to $0.0592).
🔍 Why it matters: today’s rebound is spreading across the entire main board, led by assets that held their daily 200 EMA.
Do you see ZEC and HYPE continuing to rise, or is this just a relief rally amid Extreme Fear? 👇
#ZEC #HYPE #SOL #MercadoCripto #Tra100d
⚠️ For informational and educational purposes only; this is not financial advice. Cryptocurrencies are volatile: do your own research and trade with caution.
📊 After three days stuck at 10, the Fear and Greed Index rises to 12 (Extreme Fear), and the market responds with an upward turn across Binance’s most liquid pairs.
📌 3 key stats for the day:
• $ZEC leads the gains, up +8.42% to $949.97, with $153.2M in volume (4th most-traded pair): after defending its daily 200 EMA yesterday ($867.59), it moves above its 4-hour 20 EMA ($917.84), comes close to its 20-candle high ($951.89), and adds +7.5% in OI (492,000 ZEC) with positive funding (+0.0100%).
• Among the most liquid, it is followed by $HYPE (+5.88% to $69.51 with $51.9M in volume, above its 4-hour 20 EMA at $68.59 and testing its daily 200 EMA at $69.83, with OI down 5.0%), UNI (+5.17% to $5.353, $32.2M), NEAR (+4.31% to $3.294, $76.5M), and $SOL (+3.41% to $73.19, $206.9M).
• Broad-based gains: even the five liquid assets with the most modest advances today are trading in the green over 24 hours—BNB (+0.99% to $593.10), ETH (+1.20% to $1,816.03), ENA (+1.29% to $0.1177), BTC (+1.33% to $64,880.74), and DOGE (+1.47% to $0.0592).
🔍 Why it matters: today’s rebound is spreading across the entire main board, led by assets that held their daily 200 EMA.
Do you see ZEC and HYPE continuing to rise, or is this just a relief rally amid Extreme Fear? 👇
#ZEC #HYPE #SOL #MercadoCripto #Tra100d
⚠️ For informational and educational purposes only; this is not financial advice. Cryptocurrencies are volatile: do your own research and trade with caution.
📌 3 key stats for the day:
• $ZEC leads the gains, up +8.42% to $949.97, with $153.2M in volume (4th most-traded pair): after defending its daily 200 EMA yesterday ($867.59), it moves above its 4-hour 20 EMA ($917.84), comes close to its 20-candle high ($951.89), and adds +7.5% in OI (492,000 ZEC) with positive funding (+0.0100%).
• Among the most liquid, it is followed by $HYPE (+5.88% to $69.51 with $51.9M in volume, above its 4-hour 20 EMA at $68.59 and testing its daily 200 EMA at $69.83, with OI down 5.0%), UNI (+5.17% to $5.353, $32.2M), NEAR (+4.31% to $3.294, $76.5M), and $SOL (+3.41% to $73.19, $206.9M).
• Broad-based gains: even the five liquid assets with the most modest advances today are trading in the green over 24 hours—BNB (+0.99% to $593.10), ETH (+1.20% to $1,816.03), ENA (+1.29% to $0.1177), BTC (+1.33% to $64,880.74), and DOGE (+1.47% to $0.0592).
🔍 Why it matters: today’s rebound is spreading across the entire main board, led by assets that held their daily 200 EMA.
Do you see ZEC and HYPE continuing to rise, or is this just a relief rally amid Extreme Fear? 👇
#ZEC #HYPE #SOL #MercadoCripto #Tra100d
⚠️ For informational and educational purposes only; this is not financial advice. Cryptocurrencies are volatile: do your own research and trade with caution.
118
·
--
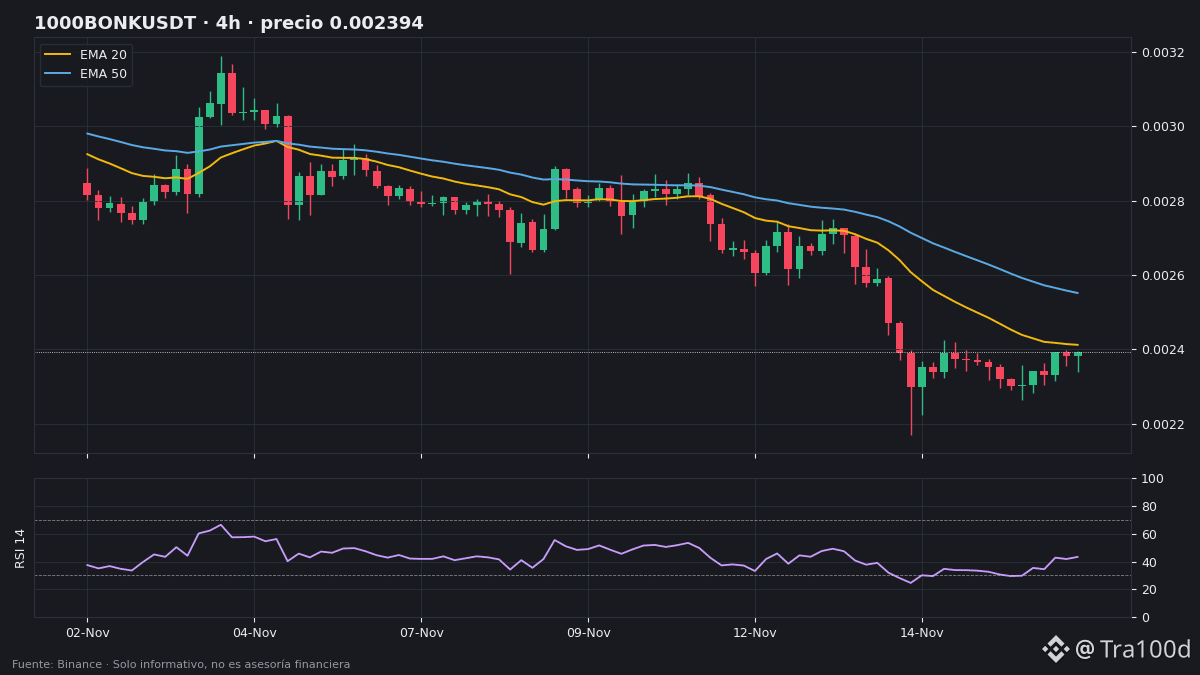
🐕 The meme block wakes up entirely in the green: $BONK leads the rebound with +3.93% in 24 hours, reaching $0.00000238 ($1.44M in volume), while $PEPE confirms the defense of its 200-day average.
📊 Snapshot of the meme sector on Binance today:
• `1000BONK` ($0.002394 in 4h) is up +4.0% over 6 candles and is testing its EMA 20 ($0.002412), with an RSI of 43.4, funding at −0.0058%, and 4.499M in OI (−0.25%).
• PEPE is up +2.39% at $0.00000385 ($26.7M vol.); `1000PEPE` ($0.003904 in 1d) is holding above its daily EMA 200 ($0.003780)—the only meme coin in a daily uptrend—with funding at −0.0034% and OI down 1.0%.
• $DOGE is up +1.58% at $0.05921, leading in volume ($28.4M), with a daily RSI of 25.7, funding at −0.0047%, and OI down 1.6%, heading toward its 4h EMA 20 ($0.06014).
• Others: WIF +2.74% ($0.1348), SHIB +1.05% ($0.00000386, funding −0.0263%), and FLOKI +0.50% ($0.00001817, OI up 3.6%, and 4h volume at 1.57x).
📏 1000BONK levels: 4h resistance at $0.002412 (EMA 20) and $0.002552 (EMA 50); support at $0.002171.
⚡ Risk: PEPE's (11.7%) and BONK's (9.8%) daily ATRs are double BTC's (4.1%) and higher than DOGE's 6.8%.
Do you see BONK breaking its 4h EMA 20, or would you rather bet on $PEPE's daily support? 👇
#BONK #PEPE #DOGE #Memecoin #Tra100d
⚠️ For informational and educational purposes only; this is not financial advice. Cryptocurrencies are volatile: do your research and trade with caution.
🐕 The meme block wakes up entirely in the green: $BONK leads the rebound with +3.93% in 24 hours, reaching $0.00000238 ($1.44M in volume), while $PEPE confirms the defense of its 200-day average.
📊 Snapshot of the meme sector on Binance today:
• `1000BONK` ($0.002394 in 4h) is up +4.0% over 6 candles and is testing its EMA 20 ($0.002412), with an RSI of 43.4, funding at −0.0058%, and 4.499M in OI (−0.25%).
• PEPE is up +2.39% at $0.00000385 ($26.7M vol.); `1000PEPE` ($0.003904 in 1d) is holding above its daily EMA 200 ($0.003780)—the only meme coin in a daily uptrend—with funding at −0.0034% and OI down 1.0%.
• $DOGE is up +1.58% at $0.05921, leading in volume ($28.4M), with a daily RSI of 25.7, funding at −0.0047%, and OI down 1.6%, heading toward its 4h EMA 20 ($0.06014).
• Others: WIF +2.74% ($0.1348), SHIB +1.05% ($0.00000386, funding −0.0263%), and FLOKI +0.50% ($0.00001817, OI up 3.6%, and 4h volume at 1.57x).
📏 1000BONK levels: 4h resistance at $0.002412 (EMA 20) and $0.002552 (EMA 50); support at $0.002171.
⚡ Risk: PEPE's (11.7%) and BONK's (9.8%) daily ATRs are double BTC's (4.1%) and higher than DOGE's 6.8%.
Do you see BONK breaking its 4h EMA 20, or would you rather bet on $PEPE 's daily support? 👇
#BONK #PEPE #DOGE #Memecoin #Tra100d
⚠️ For informational and educational purposes only; this is not financial advice. Cryptocurrencies are volatile: do your research and trade with caution.
📊 Snapshot of the meme sector on Binance today:
• `1000BONK` ($0.002394 in 4h) is up +4.0% over 6 candles and is testing its EMA 20 ($0.002412), with an RSI of 43.4, funding at −0.0058%, and 4.499M in OI (−0.25%).
• PEPE is up +2.39% at $0.00000385 ($26.7M vol.); `1000PEPE` ($0.003904 in 1d) is holding above its daily EMA 200 ($0.003780)—the only meme coin in a daily uptrend—with funding at −0.0034% and OI down 1.0%.
• $DOGE is up +1.58% at $0.05921, leading in volume ($28.4M), with a daily RSI of 25.7, funding at −0.0047%, and OI down 1.6%, heading toward its 4h EMA 20 ($0.06014).
• Others: WIF +2.74% ($0.1348), SHIB +1.05% ($0.00000386, funding −0.0263%), and FLOKI +0.50% ($0.00001817, OI up 3.6%, and 4h volume at 1.57x).
📏 1000BONK levels: 4h resistance at $0.002412 (EMA 20) and $0.002552 (EMA 50); support at $0.002171.
⚡ Risk: PEPE's (11.7%) and BONK's (9.8%) daily ATRs are double BTC's (4.1%) and higher than DOGE's 6.8%.
Do you see BONK breaking its 4h EMA 20, or would you rather bet on $PEPE 's daily support? 👇
#BONK #PEPE #DOGE #Memecoin #Tra100d
⚠️ For informational and educational purposes only; this is not financial advice. Cryptocurrencies are volatile: do your research and trade with caution.
207
·
--
🧠 With the market in Extreme Fear for several days, looking only at price can be misleading. Combining open interest (OI) with the funding rate shows what futures traders are doing:
📘 The 3 key readings:
• **Sharp rise + surging OI + deeply negative funding (*short squeeze*):** shorts get trapped, and their forced buybacks push the price higher.
• **Support + rising OI:** new positions are opening on both sides; expect volatility.
• **Pullback + falling OI:** contracts are closing and leverage is being flushed out, not aggressive new selling.
📊 Example using today's Binance data:
• $RARE rises +85.6% ($0.01609) with +195.7% OI, daily volume of 48.74x, and funding at −1.35%: a classic *short squeeze* (4-hour RSI at 72.6).
• $PEPE (`1000PEPE`) drops −6.7% but gains +8.1% in OI, with negative funding (−0.0025%) while above its daily 200 EMA ($0.003777): a battle at support.
• $BTC falls −2.1% ($64,061) with −2.8% OI (93,723 BTC) and 4-hour volume at 0.59x: cooling off after Sunday.
❌ Common mistake: opening shorts on autopilot when funding is at −1% and OI is tripling.
📝 In one line: price tells you what happened; OI and funding show who is trapped.
Do you check OI and funding before trading? 👇
#EducacionCripto #Futuros #AnalisisTecnico #Cripto #Tra100d
⚠️ For informational and educational purposes only; this is not financial advice. Cryptocurrencies are volatile: do your research and trade with caution.
🧠 With the market in Extreme Fear for several days, looking only at price can be misleading. Combining open interest (OI) with the funding rate shows what futures traders are doing:
📘 The 3 key readings:
• **Sharp rise + surging OI + deeply negative funding (*short squeeze*):** shorts get trapped, and their forced buybacks push the price higher.
• **Support + rising OI:** new positions are opening on both sides; expect volatility.
• **Pullback + falling OI:** contracts are closing and leverage is being flushed out, not aggressive new selling.
📊 Example using today's Binance data:
• $RARE rises +85.6% ($0.01609) with +195.7% OI, daily volume of 48.74x, and funding at −1.35%: a classic *short squeeze* (4-hour RSI at 72.6).
• $PEPE (`1000PEPE`) drops −6.7% but gains +8.1% in OI, with negative funding (−0.0025%) while above its daily 200 EMA ($0.003777): a battle at support.
• $BTC falls −2.1% ($64,061) with −2.8% OI (93,723 BTC) and 4-hour volume at 0.59x: cooling off after Sunday.
❌ Common mistake: opening shorts on autopilot when funding is at −1% and OI is tripling.
📝 In one line: price tells you what happened; OI and funding show who is trapped.
Do you check OI and funding before trading? 👇
#EducacionCripto #Futuros #AnalisisTecnico #Cripto #Tra100d
⚠️ For informational and educational purposes only; this is not financial advice. Cryptocurrencies are volatile: do your research and trade with caution.
📘 The 3 key readings:
• **Sharp rise + surging OI + deeply negative funding (*short squeeze*):** shorts get trapped, and their forced buybacks push the price higher.
• **Support + rising OI:** new positions are opening on both sides; expect volatility.
• **Pullback + falling OI:** contracts are closing and leverage is being flushed out, not aggressive new selling.
📊 Example using today's Binance data:
• $RARE rises +85.6% ($0.01609) with +195.7% OI, daily volume of 48.74x, and funding at −1.35%: a classic *short squeeze* (4-hour RSI at 72.6).
• $PEPE (`1000PEPE`) drops −6.7% but gains +8.1% in OI, with negative funding (−0.0025%) while above its daily 200 EMA ($0.003777): a battle at support.
• $BTC falls −2.1% ($64,061) with −2.8% OI (93,723 BTC) and 4-hour volume at 0.59x: cooling off after Sunday.
❌ Common mistake: opening shorts on autopilot when funding is at −1% and OI is tripling.
📝 In one line: price tells you what happened; OI and funding show who is trapped.
Do you check OI and funding before trading? 👇
#EducacionCripto #Futuros #AnalisisTecnico #Cripto #Tra100d
⚠️ For informational and educational purposes only; this is not financial advice. Cryptocurrencies are volatile: do your research and trade with caution.
107
·
--
📊 The Fear and Greed Index remains at 10 (Extreme Fear) for the third consecutive day, setting up a highly selective Monday open: of all pairs with more than $20M in volume on Binance, only three are trading in positive territory.
📌 3 key takeaways from the day:
• $RARE leads the day's moves, up +85.6% to $0.01609 ($20.7M in volume), bouncing from its 20-candle low of $0.00819 to a high of $0.01646; daily volume reaches 48.74x its average, open interest surges +195.7%, and funding falls to an extreme −1.35% (with the 4-hour RSI at 72.6).
• The only other two liquid assets in the green are tokenized gold $XAUT (+0.86% to $3,859.13 with $22.5M in volume and a daily ATR of just 1.9%) and ASTER (+0.60% to $0.5401 with $58.6M traded).
• Among the assets seeing profit-taking after Sunday's rebound, $ZEC drops −5.0% to $875.27 on $114.6M in volume (the market's fourth most-traded pair) and is nearing its daily 200 EMA ($867.24). Also in the red are HYPE (−3.2% to $66.05), SOL (−2.5% to $70.85), and UNI (−1.9% to $5.087).
🔍 Why it matters: the contrast between the safe-haven demand for XAUT, the isolated rotation into RARE with heavy leverage (+195.7% open interest), and ZEC testing its daily 200 EMA reflects a market where liquidity remains concentrated in isolated catalysts while overall sentiment stays at an extreme low.
Do you see more room for isolated rotations like RARE, or does Fear at 10 mean we should wait for confirmation from the majors? 👇
#RARE #ZEC #MercadoCripto #Cripto #Tra100d
⚠️ For informational and educational purposes only; this is not financial advice. Cryptocurrencies are volatile: do your own research and trade with caution.
📊 The Fear and Greed Index remains at 10 (Extreme Fear) for the third consecutive day, setting up a highly selective Monday open: of all pairs with more than $20M in volume on Binance, only three are trading in positive territory.
📌 3 key takeaways from the day:
• $RARE leads the day's moves, up +85.6% to $0.01609 ($20.7M in volume), bouncing from its 20-candle low of $0.00819 to a high of $0.01646; daily volume reaches 48.74x its average, open interest surges +195.7%, and funding falls to an extreme −1.35% (with the 4-hour RSI at 72.6).
• The only other two liquid assets in the green are tokenized gold $XAUT (+0.86% to $3,859.13 with $22.5M in volume and a daily ATR of just 1.9%) and ASTER (+0.60% to $0.5401 with $58.6M traded).
• Among the assets seeing profit-taking after Sunday's rebound, $ZEC drops −5.0% to $875.27 on $114.6M in volume (the market's fourth most-traded pair) and is nearing its daily 200 EMA ($867.24). Also in the red are HYPE (−3.2% to $66.05), SOL (−2.5% to $70.85), and UNI (−1.9% to $5.087).
🔍 Why it matters: the contrast between the safe-haven demand for XAUT, the isolated rotation into RARE with heavy leverage (+195.7% open interest), and ZEC testing its daily 200 EMA reflects a market where liquidity remains concentrated in isolated catalysts while overall sentiment stays at an extreme low.
Do you see more room for isolated rotations like RARE, or does Fear at 10 mean we should wait for confirmation from the majors? 👇
#RARE #ZEC #MercadoCripto #Cripto #Tra100d
⚠️ For informational and educational purposes only; this is not financial advice. Cryptocurrencies are volatile: do your own research and trade with caution.
📌 3 key takeaways from the day:
• $RARE leads the day's moves, up +85.6% to $0.01609 ($20.7M in volume), bouncing from its 20-candle low of $0.00819 to a high of $0.01646; daily volume reaches 48.74x its average, open interest surges +195.7%, and funding falls to an extreme −1.35% (with the 4-hour RSI at 72.6).
• The only other two liquid assets in the green are tokenized gold $XAUT (+0.86% to $3,859.13 with $22.5M in volume and a daily ATR of just 1.9%) and ASTER (+0.60% to $0.5401 with $58.6M traded).
• Among the assets seeing profit-taking after Sunday's rebound, $ZEC drops −5.0% to $875.27 on $114.6M in volume (the market's fourth most-traded pair) and is nearing its daily 200 EMA ($867.24). Also in the red are HYPE (−3.2% to $66.05), SOL (−2.5% to $70.85), and UNI (−1.9% to $5.087).
🔍 Why it matters: the contrast between the safe-haven demand for XAUT, the isolated rotation into RARE with heavy leverage (+195.7% open interest), and ZEC testing its daily 200 EMA reflects a market where liquidity remains concentrated in isolated catalysts while overall sentiment stays at an extreme low.
Do you see more room for isolated rotations like RARE, or does Fear at 10 mean we should wait for confirmation from the majors? 👇
#RARE #ZEC #MercadoCripto #Cripto #Tra100d
⚠️ For informational and educational purposes only; this is not financial advice. Cryptocurrencies are volatile: do your own research and trade with caution.
113
·
--
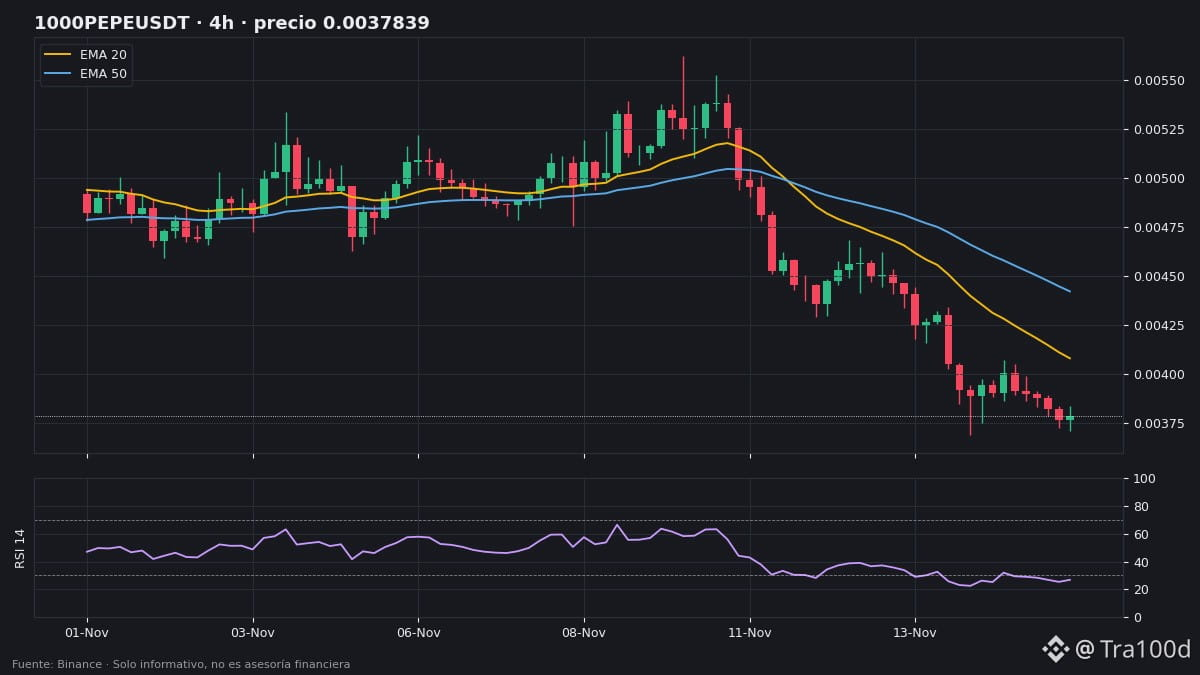
🐸 As the market starts the week cautiously, $PEPE is seeing activity concentrate in futures: it drops −6.7% in spot to $0.00000376 ($30.2M in volume), but open interest in `1000PEPE` rises +8.1% just as the price tests its 200-day moving average.
📊 Meme coin market snapshot on Binance today:
• For `1000PEPE` ($0.003784 over 4 h), the 4-hour RSI enters oversold territory (26.8) near the 20-candle low ($0.00369); at the daily close ($0.003874), it continues to hold above its daily 200 EMA ($0.003777), with negative funding (−0.0025%) and 20.316M open contracts (+8.1%).
• $DOGE is the best-performing memecoin today, down −1.6% to $0.05832 ($36.5M in volume), holding above the $0.05538 low with its daily RSI oversold (26.6), daily volume at 1.70x its average, open interest down −3.2%, and funding at −0.0022%.
• $WIF retreats −2.7% to $0.1312 ($1.20M in volume), with its RSI oversold on both the 4-hour (29.1) and daily (26.1) charts, and open interest down −5.1%.
• The rest of the group falls between 3% and 5%: SHIB −3.3% ($0.00000383, daily RSI at 28.9 and open interest up +1.9%), FLOKI −3.3% ($0.00001804, open interest up +2.1% and funding at −0.0245%), and BONK −5.4% ($0.00000228, 4-hour RSI at 29.5 and funding at −0.0191%).
📏 1000PEPE levels:
• Key support: $0.003777 (daily 200 EMA) and $0.003690 (20-candle low on the 4-hour and daily charts)
• 4-hour resistance: $0.004079 (20 EMA) and $0.004421 (50 EMA)
⚡ Risk: daily volatility (ATR) is 12.2% for PEPE and 10.1% for BONK (compared with 6.9% for DOGE and 4.2% for BTC), so the +8.1% increase in open interest points to sharp swings around the daily 200 EMA.
Do you think it will defend its daily 200 EMA for one more day, or do you prefer the relatively lower volatility of $DOGE? 👇
#PEPE #DOGE #Memecoin #Cripto #Tra100d
⚠️ For informational and educational purposes only; not financial advice. Cryptocurrencies are volatile: do your own research and trade with caution.
🐸 As the market starts the week cautiously, $PEPE is seeing activity concentrate in futures: it drops −6.7% in spot to $0.00000376 ($30.2M in volume), but open interest in `1000PEPE` rises +8.1% just as the price tests its 200-day moving average.
📊 Meme coin market snapshot on Binance today:
• For `1000PEPE` ($0.003784 over 4 h), the 4-hour RSI enters oversold territory (26.8) near the 20-candle low ($0.00369); at the daily close ($0.003874), it continues to hold above its daily 200 EMA ($0.003777), with negative funding (−0.0025%) and 20.316M open contracts (+8.1%).
• $DOGE is the best-performing memecoin today, down −1.6% to $0.05832 ($36.5M in volume), holding above the $0.05538 low with its daily RSI oversold (26.6), daily volume at 1.70x its average, open interest down −3.2%, and funding at −0.0022%.
• $WIF retreats −2.7% to $0.1312 ($1.20M in volume), with its RSI oversold on both the 4-hour (29.1) and daily (26.1) charts, and open interest down −5.1%.
• The rest of the group falls between 3% and 5%: SHIB −3.3% ($0.00000383, daily RSI at 28.9 and open interest up +1.9%), FLOKI −3.3% ($0.00001804, open interest up +2.1% and funding at −0.0245%), and BONK −5.4% ($0.00000228, 4-hour RSI at 29.5 and funding at −0.0191%).
📏 1000PEPE levels:
• Key support: $0.003777 (daily 200 EMA) and $0.003690 (20-candle low on the 4-hour and daily charts)
• 4-hour resistance: $0.004079 (20 EMA) and $0.004421 (50 EMA)
⚡ Risk: daily volatility (ATR) is 12.2% for PEPE and 10.1% for BONK (compared with 6.9% for DOGE and 4.2% for BTC), so the +8.1% increase in open interest points to sharp swings around the daily 200 EMA.
Do you think it will defend its daily 200 EMA for one more day, or do you prefer the relatively lower volatility of $DOGE ? 👇
#PEPE #DOGE #Memecoin #Cripto #Tra100d
⚠️ For informational and educational purposes only; not financial advice. Cryptocurrencies are volatile: do your own research and trade with caution.
📊 Meme coin market snapshot on Binance today:
• For `1000PEPE` ($0.003784 over 4 h), the 4-hour RSI enters oversold territory (26.8) near the 20-candle low ($0.00369); at the daily close ($0.003874), it continues to hold above its daily 200 EMA ($0.003777), with negative funding (−0.0025%) and 20.316M open contracts (+8.1%).
• $DOGE is the best-performing memecoin today, down −1.6% to $0.05832 ($36.5M in volume), holding above the $0.05538 low with its daily RSI oversold (26.6), daily volume at 1.70x its average, open interest down −3.2%, and funding at −0.0022%.
• $WIF retreats −2.7% to $0.1312 ($1.20M in volume), with its RSI oversold on both the 4-hour (29.1) and daily (26.1) charts, and open interest down −5.1%.
• The rest of the group falls between 3% and 5%: SHIB −3.3% ($0.00000383, daily RSI at 28.9 and open interest up +1.9%), FLOKI −3.3% ($0.00001804, open interest up +2.1% and funding at −0.0245%), and BONK −5.4% ($0.00000228, 4-hour RSI at 29.5 and funding at −0.0191%).
📏 1000PEPE levels:
• Key support: $0.003777 (daily 200 EMA) and $0.003690 (20-candle low on the 4-hour and daily charts)
• 4-hour resistance: $0.004079 (20 EMA) and $0.004421 (50 EMA)
⚡ Risk: daily volatility (ATR) is 12.2% for PEPE and 10.1% for BONK (compared with 6.9% for DOGE and 4.2% for BTC), so the +8.1% increase in open interest points to sharp swings around the daily 200 EMA.
Do you think it will defend its daily 200 EMA for one more day, or do you prefer the relatively lower volatility of $DOGE ? 👇
#PEPE #DOGE #Memecoin #Cripto #Tra100d
⚠️ For informational and educational purposes only; not financial advice. Cryptocurrencies are volatile: do your own research and trade with caution.
326
·
--
🧠 After hitting new 20-day lows, the market has left long lower wicks with volume spikes. How can we tell whether this is simply an oversold bounce or a firmer bottom?
📘 What is a high-volume absorption wick?
• When the price breaks below psychological support but closes well above the low on volume far above its average (>2x), it indicates that buy orders entered that zone and were able to absorb forced selling and liquidations.
• However, the first bounce after a capitulation is usually technical: to call it a structural shift on the 4-hour chart, the price needs to reclaim its EMA 20 and form a higher low.
📊 Example using today's real data from Binance:
• $BTC hit a 20-candle low on the 4-hour chart at $61,956.3 and bounced to $65,548, with daily volume at 1.94x its average and a daily RSI of 19.6, but it remains below its 4-hour EMA 20 ($67,841).
• $ETH defended $1,710.01 and recovered to $1,835.45 with daily volume at 2.14x and a daily RSI of 19.2, still below its 4-hour EMA 20 ($1,903.76).
• $SOL bounced from $67.35 to $73.02 with the highest daily volume among the large caps (2.41x) and an extreme daily RSI of 14.6. Its first dynamic resistance is at $76.30 (4-hour EMA 20).
❌ Common mistake: chasing the bounce just below the 4-hour EMA 20, thinking the danger has passed. After an absorption wick, it’s common for the market to retest part of that zone before choosing a direction.
📝 In one line: the volume spike shows you where the decline stalled; reclaiming the EMA 20 confirms who’s in control.
Are you waiting for a second test of support, or for a close above the 4-hour EMA 20 before validating a reversal? 👇
#EducacionCripto #AnalisisTecnico #Volumen #Cripto #Tra100d
⚠️ For informational and educational purposes only; this is not financial advice. Cryptocurrencies are volatile: do your own research and trade with caution.
🧠 After hitting new 20-day lows, the market has left long lower wicks with volume spikes. How can we tell whether this is simply an oversold bounce or a firmer bottom?
📘 What is a high-volume absorption wick?
• When the price breaks below psychological support but closes well above the low on volume far above its average (>2x), it indicates that buy orders entered that zone and were able to absorb forced selling and liquidations.
• However, the first bounce after a capitulation is usually technical: to call it a structural shift on the 4-hour chart, the price needs to reclaim its EMA 20 and form a higher low.
📊 Example using today's real data from Binance:
• $BTC hit a 20-candle low on the 4-hour chart at $61,956.3 and bounced to $65,548, with daily volume at 1.94x its average and a daily RSI of 19.6, but it remains below its 4-hour EMA 20 ($67,841).
• $ETH defended $1,710.01 and recovered to $1,835.45 with daily volume at 2.14x and a daily RSI of 19.2, still below its 4-hour EMA 20 ($1,903.76).
• $SOL bounced from $67.35 to $73.02 with the highest daily volume among the large caps (2.41x) and an extreme daily RSI of 14.6. Its first dynamic resistance is at $76.30 (4-hour EMA 20).
❌ Common mistake: chasing the bounce just below the 4-hour EMA 20, thinking the danger has passed. After an absorption wick, it’s common for the market to retest part of that zone before choosing a direction.
📝 In one line: the volume spike shows you where the decline stalled; reclaiming the EMA 20 confirms who’s in control.
Are you waiting for a second test of support, or for a close above the 4-hour EMA 20 before validating a reversal? 👇
#EducacionCripto #AnalisisTecnico #Volumen #Cripto #Tra100d
⚠️ For informational and educational purposes only; this is not financial advice. Cryptocurrencies are volatile: do your own research and trade with caution.
📘 What is a high-volume absorption wick?
• When the price breaks below psychological support but closes well above the low on volume far above its average (>2x), it indicates that buy orders entered that zone and were able to absorb forced selling and liquidations.
• However, the first bounce after a capitulation is usually technical: to call it a structural shift on the 4-hour chart, the price needs to reclaim its EMA 20 and form a higher low.
📊 Example using today's real data from Binance:
• $BTC hit a 20-candle low on the 4-hour chart at $61,956.3 and bounced to $65,548, with daily volume at 1.94x its average and a daily RSI of 19.6, but it remains below its 4-hour EMA 20 ($67,841).
• $ETH defended $1,710.01 and recovered to $1,835.45 with daily volume at 2.14x and a daily RSI of 19.2, still below its 4-hour EMA 20 ($1,903.76).
• $SOL bounced from $67.35 to $73.02 with the highest daily volume among the large caps (2.41x) and an extreme daily RSI of 14.6. Its first dynamic resistance is at $76.30 (4-hour EMA 20).
❌ Common mistake: chasing the bounce just below the 4-hour EMA 20, thinking the danger has passed. After an absorption wick, it’s common for the market to retest part of that zone before choosing a direction.
📝 In one line: the volume spike shows you where the decline stalled; reclaiming the EMA 20 confirms who’s in control.
Are you waiting for a second test of support, or for a close above the 4-hour EMA 20 before validating a reversal? 👇
#EducacionCripto #AnalisisTecnico #Volumen #Cripto #Tra100d
⚠️ For informational and educational purposes only; this is not financial advice. Cryptocurrencies are volatile: do your own research and trade with caution.
61
Log in to explore more content
Join global crypto users on Binance Square
⚡️ Get latest and useful information about crypto.
💬 Trusted by the world’s largest crypto exchange.
👍 Discover real insights from verified creators.
Email / Phone number
Trending Topics
1
#IsAnthropic’s$1.5TMarketCapJustified?
21,726 views
121 Discussing
2
#13FInstitutionsBitcoinSpotETPHoldingsHitRecord
209 views
10 Discussing
3
#BTCRemainsUnderPressureAfterHawkishFOMCMinutes
291,061 views
2,213 Discussing
4
#NvidiaBoardReportedlySplitOverHuang’sReturn
143,589 views
1,205 Discussing
5
#StrategySTRCPreferredSlips3.65%Below$100Par
10,141 views
92 Discussing
6
#MASToUpgradeSGDTestnetToSGDigitalLedger
31,258 views
316 Discussing
7
#CanGTA6'sLaunchLiftTTWOShares?
107,870 views
865 Discussing
8
#Solana2027RoadmapTargetsDoubleComputeCapacity
13,287 views
167 Discussing
9
#InjectiveTokenizedRealEstateMortgagesTop$1.5B
1,476 views
32 Discussing
10
#TetherMakesStrategicInvestmentInSCRYPT
10,705 views
125 Discussing