
#spyb
spyb
3,763 views
112 Discussing
Hot
Latest

The S&P 500 Equal Weight Index has just delivered its best relative performance in decades—and that statement carries far more weight than it might seem. Over the past two years, the market-cap-weighted S&P nominally held 500 companies, but in reality its risk exposure came down to seven or eight AI giants. The index posted impressive gains, but they were extremely concentrated. Equal weighting strips away that veneer and shows what’s underneath.
① Concentration is the real hidden variable in this rally
The advantage of market-cap weighting is that it surges when the market is moving in its favor. The downside is that it stakes the fate of the entire index on a handful of earnings calls. Equal weighting works in exactly the opposite way: each of the 500 constituents makes up only a fraction of a percent, so no single stock gets to dictate the portfolio’s performance. When the AI trade shifts from “consensus” to “disagreement,” this diversification isn’t cautious—it’s a structural shock absorber. SPYB tracks this approach: it doesn’t bet on who the next winner will be; it bets that no one can keep winning forever.
② Crowding is already showing up in marginal buying
Once everyone buys into the same thesis, the upside shifts to the sell side. When new money is buying the same handful of stocks for the same reasons, any surprise against expectations can trigger a one-way rush for the exits. Meanwhile, diversified broad-market holdings attract passive buying in that environment. This is equal weighting’s least conspicuous but most practical function: it doesn’t generate returns; it absorbs volatility.
③ Prediction markets are repricing policy uncertainty
The latest odds have pushed the probability of a Democratic sweep of Congress to 70%. Midterm elections are essentially a president’s midterm exam. After nearly two years in office, the administration’s record on the economy, inflation, and policy will all come under scrutiny. This isn’t about saying which party would be better for stocks—history has debunked that simplistic narrative many times over. The real shift is that the uncertainty premium is back. When the policy outlook becomes less clear, money naturally moves out of concentrated positions with high valuations and ambitious narratives and into broad-market exposure. These flows often show up in index composition earlier than any earnings report.
④ The cost of equal weighting needs to be made clear upfront
It naturally underperforms in a one-way trending market. That’s how the mechanism works, not a matter of luck. Periodic rebalancing means mechanically selling stocks that have risen more and buying those that have fallen more. In a bull market, that process acts as a drag. More importantly, if the AI trade is only catching its breath before reconcentrating, SPYB’s relative advantage could quickly disappear. On-chain exposure also comes with added frictions from market depth and premiums or discounts; slippage during thinly traded periods shouldn’t be ignored.
My take: Don’t chase equal weighting’s relative strength as a catch-up trade. It’s better viewed as a position in your portfolio that hedges against a single dominant narrative. The key question is whether the AI heavyweights’ pullback is just beginning or is merely a rotation-driven pause. If it’s the former, equal weighting has a basis for sustained outperformance; if it’s the latter, the relative gains of the past few weeks could quickly evaporate. Size the position so that “being wrong won’t hurt too much,” rather than based on “how much you could make if you’re right.” That’s a better way to stay in the game.
#SPYB #Crypto
The S&P 500 Equal Weight Index has just delivered its best relative performance in decades—and that statement carries far more weight than it might seem. Over the past two years, the market-cap-weighted S&P nominally held 500 companies, but in reality its risk exposure came down to seven or eight AI giants. The index posted impressive gains, but they were extremely concentrated. Equal weighting strips away that veneer and shows what’s underneath.
① Concentration is the real hidden variable in this rally
The advantage of market-cap weighting is that it surges when the market is moving in its favor. The downside is that it stakes the fate of the entire index on a handful of earnings calls. Equal weighting works in exactly the opposite way: each of the 500 constituents makes up only a fraction of a percent, so no single stock gets to dictate the portfolio’s performance. When the AI trade shifts from “consensus” to “disagreement,” this diversification isn’t cautious—it’s a structural shock absorber. SPYB tracks this approach: it doesn’t bet on who the next winner will be; it bets that no one can keep winning forever.
② Crowding is already showing up in marginal buying
Once everyone buys into the same thesis, the upside shifts to the sell side. When new money is buying the same handful of stocks for the same reasons, any surprise against expectations can trigger a one-way rush for the exits. Meanwhile, diversified broad-market holdings attract passive buying in that environment. This is equal weighting’s least conspicuous but most practical function: it doesn’t generate returns; it absorbs volatility.
③ Prediction markets are repricing policy uncertainty
The latest odds have pushed the probability of a Democratic sweep of Congress to 70%. Midterm elections are essentially a president’s midterm exam. After nearly two years in office, the administration’s record on the economy, inflation, and policy will all come under scrutiny. This isn’t about saying which party would be better for stocks—history has debunked that simplistic narrative many times over. The real shift is that the uncertainty premium is back. When the policy outlook becomes less clear, money naturally moves out of concentrated positions with high valuations and ambitious narratives and into broad-market exposure. These flows often show up in index composition earlier than any earnings report.
④ The cost of equal weighting needs to be made clear upfront
It naturally underperforms in a one-way trending market. That’s how the mechanism works, not a matter of luck. Periodic rebalancing means mechanically selling stocks that have risen more and buying those that have fallen more. In a bull market, that process acts as a drag. More importantly, if the AI trade is only catching its breath before reconcentrating, SPYB’s relative advantage could quickly disappear. On-chain exposure also comes with added frictions from market depth and premiums or discounts; slippage during thinly traded periods shouldn’t be ignored.
My take: Don’t chase equal weighting’s relative strength as a catch-up trade. It’s better viewed as a position in your portfolio that hedges against a single dominant narrative. The key question is whether the AI heavyweights’ pullback is just beginning or is merely a rotation-driven pause. If it’s the former, equal weighting has a basis for sustained outperformance; if it’s the latter, the relative gains of the past few weeks could quickly evaporate. Size the position so that “being wrong won’t hurt too much,” rather than based on “how much you could make if you’re right.” That’s a better way to stay in the game.
#SPYB #Crypto
① Concentration is the real hidden variable in this rally
The advantage of market-cap weighting is that it surges when the market is moving in its favor. The downside is that it stakes the fate of the entire index on a handful of earnings calls. Equal weighting works in exactly the opposite way: each of the 500 constituents makes up only a fraction of a percent, so no single stock gets to dictate the portfolio’s performance. When the AI trade shifts from “consensus” to “disagreement,” this diversification isn’t cautious—it’s a structural shock absorber. SPYB tracks this approach: it doesn’t bet on who the next winner will be; it bets that no one can keep winning forever.
② Crowding is already showing up in marginal buying
Once everyone buys into the same thesis, the upside shifts to the sell side. When new money is buying the same handful of stocks for the same reasons, any surprise against expectations can trigger a one-way rush for the exits. Meanwhile, diversified broad-market holdings attract passive buying in that environment. This is equal weighting’s least conspicuous but most practical function: it doesn’t generate returns; it absorbs volatility.
③ Prediction markets are repricing policy uncertainty
The latest odds have pushed the probability of a Democratic sweep of Congress to 70%. Midterm elections are essentially a president’s midterm exam. After nearly two years in office, the administration’s record on the economy, inflation, and policy will all come under scrutiny. This isn’t about saying which party would be better for stocks—history has debunked that simplistic narrative many times over. The real shift is that the uncertainty premium is back. When the policy outlook becomes less clear, money naturally moves out of concentrated positions with high valuations and ambitious narratives and into broad-market exposure. These flows often show up in index composition earlier than any earnings report.
④ The cost of equal weighting needs to be made clear upfront
It naturally underperforms in a one-way trending market. That’s how the mechanism works, not a matter of luck. Periodic rebalancing means mechanically selling stocks that have risen more and buying those that have fallen more. In a bull market, that process acts as a drag. More importantly, if the AI trade is only catching its breath before reconcentrating, SPYB’s relative advantage could quickly disappear. On-chain exposure also comes with added frictions from market depth and premiums or discounts; slippage during thinly traded periods shouldn’t be ignored.
My take: Don’t chase equal weighting’s relative strength as a catch-up trade. It’s better viewed as a position in your portfolio that hedges against a single dominant narrative. The key question is whether the AI heavyweights’ pullback is just beginning or is merely a rotation-driven pause. If it’s the former, equal weighting has a basis for sustained outperformance; if it’s the latter, the relative gains of the past few weeks could quickly evaporate. Size the position so that “being wrong won’t hurt too much,” rather than based on “how much you could make if you’re right.” That’s a better way to stay in the game.
#SPYB #Crypto
9

·
--
After spending a long time in crypto, you realize there’s another layer between news and price: capital flows.
I just saw a headline: Hyperliquid’s Intel stock contract climbed to second place in its sector by trading volume. When negative news hits, the panicked sellers exit first; only afterward can you see the real buying support.
$SPYB I’ll keep watching.
#SPYB
After spending a long time in crypto, you realize there’s another layer between news and price: capital flows.
I just saw a headline: Hyperliquid’s Intel stock contract climbed to second place in its sector by trading volume. When negative news hits, the panicked sellers exit first; only afterward can you see the real buying support.
$SPYB I’ll keep watching.
#SPYB
I just saw a headline: Hyperliquid’s Intel stock contract climbed to second place in its sector by trading volume. When negative news hits, the panicked sellers exit first; only afterward can you see the real buying support.
$SPYB I’ll keep watching.
#SPYB
73

Everyone, check this out: Hyperliquid’s Intel stock contract trading volume has risen to second place in the sector
At first glance, this seems somewhat negative, but the impact depends on whether the selling pressure continues. Seeing this made my heart sink, but panicking won’t help—keep an eye on the key levels!
$SPYB , how long do you think this will keep making waves?
#SPYB
Everyone, check this out: Hyperliquid’s Intel stock contract trading volume has risen to second place in the sector
At first glance, this seems somewhat negative, but the impact depends on whether the selling pressure continues. Seeing this made my heart sink, but panicking won’t help—keep an eye on the key levels!
$SPYB , how long do you think this will keep making waves?
#SPYB
At first glance, this seems somewhat negative, but the impact depends on whether the selling pressure continues. Seeing this made my heart sink, but panicking won’t help—keep an eye on the key levels!
$SPYB , how long do you think this will keep making waves?
#SPYB
72

·
--
Just now | Hyperliquid Intel stock contract trading volume rises to second place in the sector
$SPYB 758.41(-0.68%)
The market's reaction to the news matters more than the news itself. Let's see what happens next.
#SPYB
This is not investment advice.
Just now | Hyperliquid Intel stock contract trading volume rises to second place in the sector
$SPYB 758.41(-0.68%)
The market's reaction to the news matters more than the news itself. Let's see what happens next.
#SPYB
This is not investment advice.
$SPYB 758.41(-0.68%)
The market's reaction to the news matters more than the news itself. Let's see what happens next.
#SPYB
This is not investment advice.
78

·
--
Take note! Hyperliquid’s Intel stock contract trading volume has risen to second place in the sector
Why pay attention?
👉 Sentiment is bearish, and volatility may increase
👉 $SPYB 24h -0.69%; the next few days are crucial
👉 Don’t hold on to a losing position before taking action
Vote in the comments: up or down?
#SPYB
Take note! Hyperliquid’s Intel stock contract trading volume has risen to second place in the sector
Why pay attention?
👉 Sentiment is bearish, and volatility may increase
👉 $SPYB 24h -0.69%; the next few days are crucial
👉 Don’t hold on to a losing position before taking action
Vote in the comments: up or down?
#SPYB
Why pay attention?
👉 Sentiment is bearish, and volatility may increase
👉 $SPYB 24h -0.69%; the next few days are crucial
👉 Don’t hold on to a losing position before taking action
Vote in the comments: up or down?
#SPYB
79

·
--
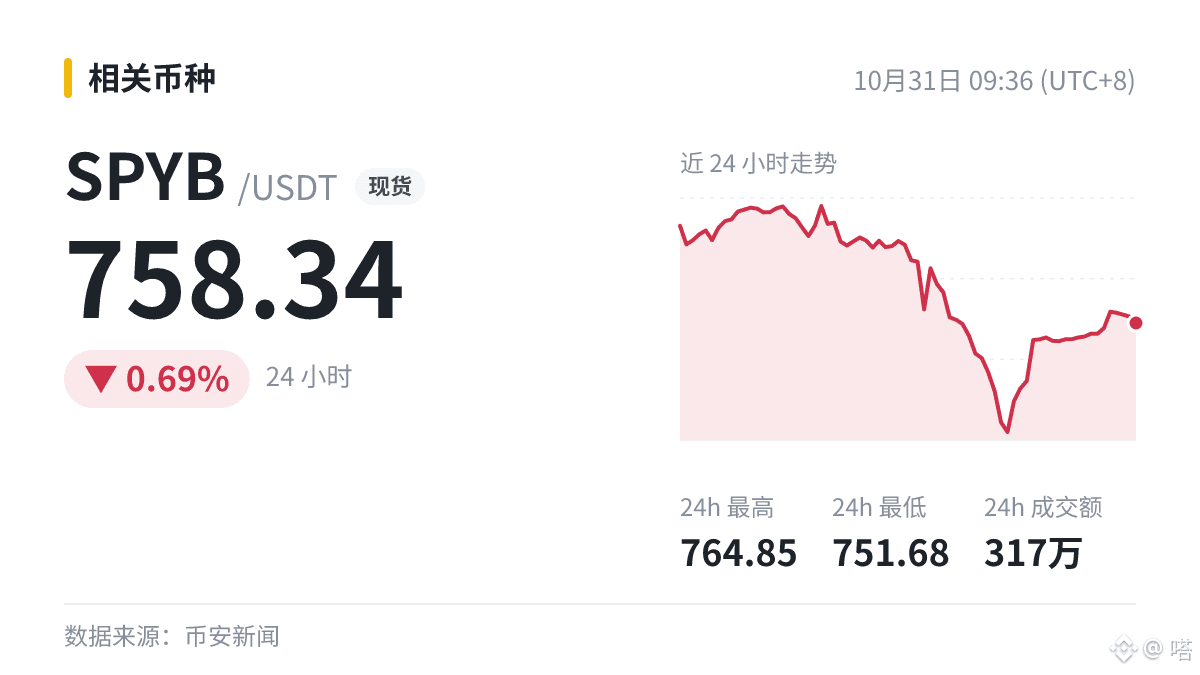
First, look at the data: $SPYB 758.34, 24h -0.69%
Next, the news: Hyperliquid's Intel stock contract trading volume rose to second place in the sector.
The bearish news came suddenly, and the price's initial reaction is often an overreaction. Above all, don't panic. Data has no bias, and hype can be misleading, so look at the data first.
#SPYB
First, look at the data: $SPYB 758.34, 24h -0.69%
Next, the news: Hyperliquid's Intel stock contract trading volume rose to second place in the sector.
The bearish news came suddenly, and the price's initial reaction is often an overreaction. Above all, don't panic. Data has no bias, and hype can be misleading, so look at the data first.
#SPYB
Next, the news: Hyperliquid's Intel stock contract trading volume rose to second place in the sector.
The bearish news came suddenly, and the price's initial reaction is often an overreaction. Above all, don't panic. Data has no bias, and hype can be misleading, so look at the data first.
#SPYB
57

HEAVY SUPPLY WALL THREATENS $SPYB MOMENTUM AS SELLERS PREPARE TO TRAP BULLS! 🚨 🔻
Entry: 766 - 770 ⚡
Target: 758 - 735 🎯
Stop Loss: 776 ⚠️
Price action is plowing directly into a dense brick wall of resistance where historical order flow heavily favors institutional distribution. 📊 Despite the recent upside surge, upside velocity is stalling out as smart money quietly absorbs buying pressure at the range highs.
A clean structural rejection off this supply region opens the trapdoor for a swift corrective wave down toward key liquidity pools. 📌 Waiting for price to confirm seller dominance on lower timeframes turns this potential turn into a high-conviction short setup. 🔍
💬 Are you shorting this resistance cluster or expecting buyers to force a breakout? 👇
⚠️ Not financial advice. Always manage your risk. 🛡️
🏷️ #SPYB #ShortSetup #Bearish #PriceAction #Crypto
🐻 🔻
HEAVY SUPPLY WALL THREATENS $SPYB MOMENTUM AS SELLERS PREPARE TO TRAP BULLS! 🚨 🔻
Entry: 766 - 770 ⚡
Target: 758 - 735 🎯
Stop Loss: 776 ⚠️
Price action is plowing directly into a dense brick wall of resistance where historical order flow heavily favors institutional distribution. 📊 Despite the recent upside surge, upside velocity is stalling out as smart money quietly absorbs buying pressure at the range highs.
A clean structural rejection off this supply region opens the trapdoor for a swift corrective wave down toward key liquidity pools. 📌 Waiting for price to confirm seller dominance on lower timeframes turns this potential turn into a high-conviction short setup. 🔍
💬 Are you shorting this resistance cluster or expecting buyers to force a breakout? 👇
⚠️ Not financial advice. Always manage your risk. 🛡️
🏷️ #SPYB #ShortSetup #Bearish #PriceAction #Crypto
🐻 🔻
Entry: 766 - 770 ⚡
Target: 758 - 735 🎯
Stop Loss: 776 ⚠️
Price action is plowing directly into a dense brick wall of resistance where historical order flow heavily favors institutional distribution. 📊 Despite the recent upside surge, upside velocity is stalling out as smart money quietly absorbs buying pressure at the range highs.
A clean structural rejection off this supply region opens the trapdoor for a swift corrective wave down toward key liquidity pools. 📌 Waiting for price to confirm seller dominance on lower timeframes turns this potential turn into a high-conviction short setup. 🔍
💬 Are you shorting this resistance cluster or expecting buyers to force a breakout? 👇
⚠️ Not financial advice. Always manage your risk. 🛡️
🏷️ #SPYB #ShortSetup #Bearish #PriceAction #Crypto
🐻 🔻
13

·
--
🚨 $SPYB EYES MIDTERM LIQUIDITY SWEEP—EQUITY REBOUND ON THE HORIZON 📈
Entry: 7,100‑7,200 ⚡
Target: 8,000 🚀
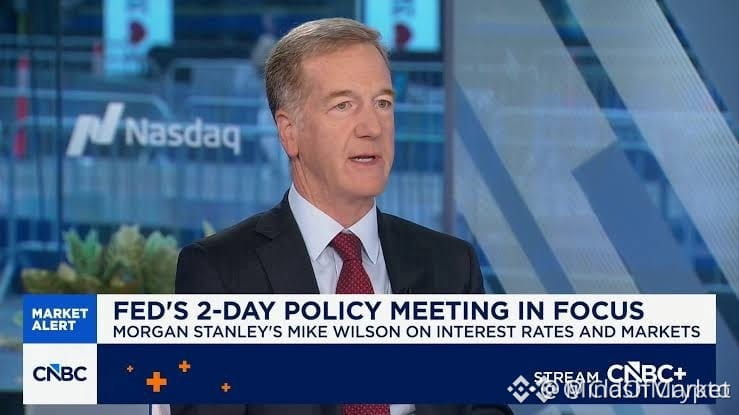
📊 Morgan Stanley flags the post‑election window as a liquidity release point, where smart money could capitalize on the fading midterm uncertainty. 🌊 The AI financing chatter and tightening conditions add a short‑term bearish veil, but a Fed pivot looms as the catalyst to ignite the upside. 💡 Historical data shows a 6‑12 month equity surge after midterms, suggesting the market is primed for a disciplined swing.
🤔 Are you positioning for the liquidity sweep or waiting for the Fed’s signal? 👇
⚠️ Not financial advice. Always manage your risk. 🛡️
🏷️ #SPYB #EquityRebound #MidtermCatalyst #SmartMoney #Liquidity
🔥 💎
🚨 $SPYB EYES MIDTERM LIQUIDITY SWEEP—EQUITY REBOUND ON THE HORIZON 📈
Entry: 7,100‑7,200 ⚡
Target: 8,000 🚀
📊 Morgan Stanley flags the post‑election window as a liquidity release point, where smart money could capitalize on the fading midterm uncertainty. 🌊 The AI financing chatter and tightening conditions add a short‑term bearish veil, but a Fed pivot looms as the catalyst to ignite the upside. 💡 Historical data shows a 6‑12 month equity surge after midterms, suggesting the market is primed for a disciplined swing.
🤔 Are you positioning for the liquidity sweep or waiting for the Fed’s signal? 👇
⚠️ Not financial advice. Always manage your risk. 🛡️
🏷️ #SPYB #EquityRebound #MidtermCatalyst #SmartMoney #Liquidity
🔥 💎
Entry: 7,100‑7,200 ⚡
Target: 8,000 🚀
📊 Morgan Stanley flags the post‑election window as a liquidity release point, where smart money could capitalize on the fading midterm uncertainty. 🌊 The AI financing chatter and tightening conditions add a short‑term bearish veil, but a Fed pivot looms as the catalyst to ignite the upside. 💡 Historical data shows a 6‑12 month equity surge after midterms, suggesting the market is primed for a disciplined swing.
🤔 Are you positioning for the liquidity sweep or waiting for the Fed’s signal? 👇
⚠️ Not financial advice. Always manage your risk. 🛡️
🏷️ #SPYB #EquityRebound #MidtermCatalyst #SmartMoney #Liquidity
🔥 💎
13

🚀 $SPYB POISED FOR POST‑ELECTION REBOUND AS LIQUIDITY SWEEP RETURNS! 🦈
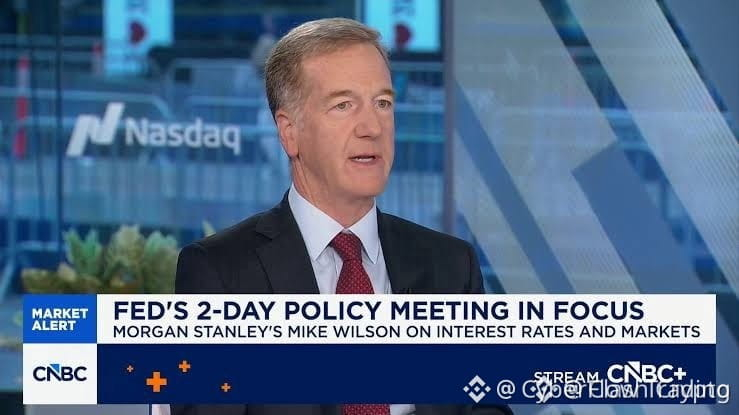
🦈 Smart money is already re‑stacking near the 7,100‑7,200 band, eyeing the Fed‑pivot catalyst that could flip the script. 📊 Volume on the 4‑hour chart is spiking, and the RSI is clawing back from oversold territory, hinting at a hidden bullish divergence. ⚡ With mid‑term elections clearing a historic risk cloud, the next 6‑12 months could see a 6‑12% upside swing, echoing past cycles.
💬 How are you positioning for the post‑election bounce? 👇
⚠️ Not financial advice. Always manage your risk. 🛡️
🏷️ #SPYB #EquitySetup #Rebound #MarketCatalyst #Crypto
🔥 💎
🚀 $SPYB POISED FOR POST‑ELECTION REBOUND AS LIQUIDITY SWEEP RETURNS! 🦈
🦈 Smart money is already re‑stacking near the 7,100‑7,200 band, eyeing the Fed‑pivot catalyst that could flip the script. 📊 Volume on the 4‑hour chart is spiking, and the RSI is clawing back from oversold territory, hinting at a hidden bullish divergence. ⚡ With mid‑term elections clearing a historic risk cloud, the next 6‑12 months could see a 6‑12% upside swing, echoing past cycles.
💬 How are you positioning for the post‑election bounce? 👇
⚠️ Not financial advice. Always manage your risk. 🛡️
🏷️ #SPYB #EquitySetup #Rebound #MarketCatalyst #Crypto
🔥 💎
🦈 Smart money is already re‑stacking near the 7,100‑7,200 band, eyeing the Fed‑pivot catalyst that could flip the script. 📊 Volume on the 4‑hour chart is spiking, and the RSI is clawing back from oversold territory, hinting at a hidden bullish divergence. ⚡ With mid‑term elections clearing a historic risk cloud, the next 6‑12 months could see a 6‑12% upside swing, echoing past cycles.
💬 How are you positioning for the post‑election bounce? 👇
⚠️ Not financial advice. Always manage your risk. 🛡️
🏷️ #SPYB #EquitySetup #Rebound #MarketCatalyst #Crypto
🔥 💎
12

·
--
Bullish
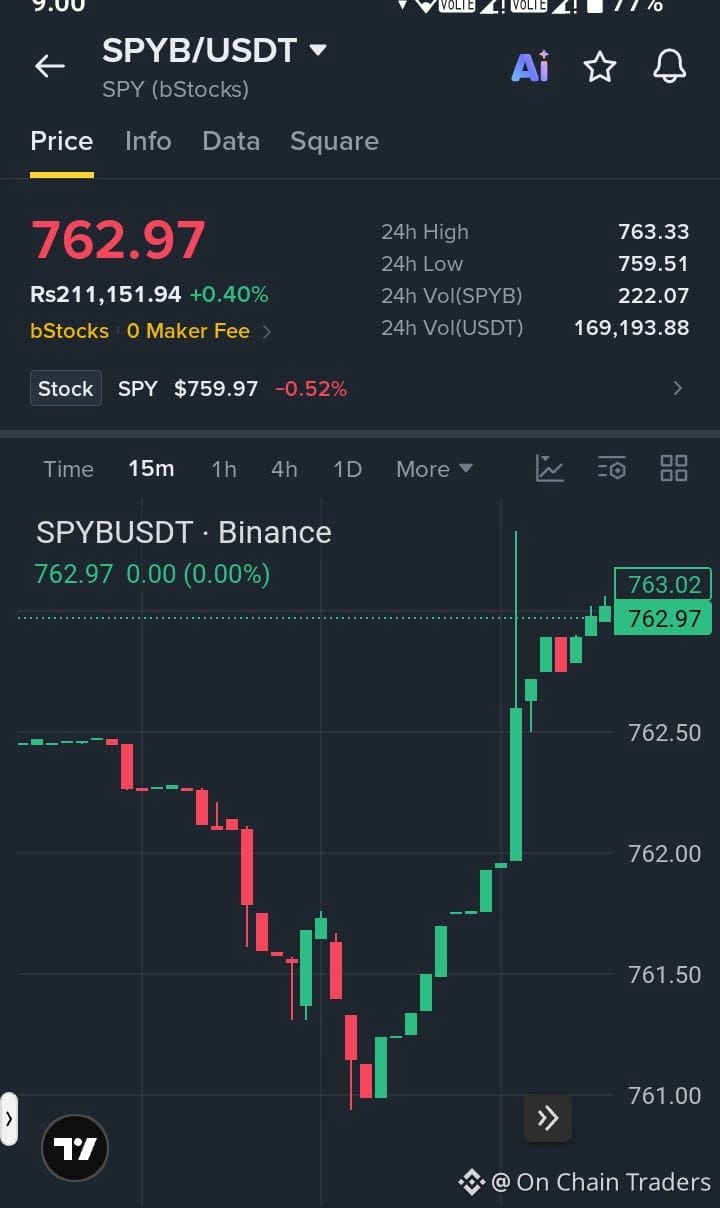
$SPYB is holding strong near $762.97, up 0.40%. Bulls are watching $763.33 for a breakout, while $761.00–$759.50 remains a key support zone. A clean move above resistance could push price toward $765–$768.
Entry: $762–$763
TP1: $765 | TP2: $768 | TP3: $770
SL: $759
#SPYB
{spot}(SPYBUSDT)
$SPYB is holding strong near $762.97, up 0.40%. Bulls are watching $763.33 for a breakout, while $761.00–$759.50 remains a key support zone. A clean move above resistance could push price toward $765–$768.
Entry: $762–$763
TP1: $765 | TP2: $768 | TP3: $770
SL: $759
#SPYB
Entry: $762–$763
TP1: $765 | TP2: $768 | TP3: $770
SL: $759
#SPYB
19

·
--
📉 $SPYB REJECTION AT KEY RESISTANCE SIGNALS AN EXPLOSIVE SHORT OPPORTUNITY AHEAD! 🚨
Entry: 770.00 – 771.00 ⚡
Target: 768.50 / 767.30 / 766.33 🎯
Stop Loss: 774.21 ⚠️
📌 Bears are stepping in heavy as $SPYB slams directly into overhead supply, leaving buying momentum completely exhausted at the highs. 🔍 Order flow reveals aggressive distribution under the surface as institutional liquidity absorbs remaining bids.
⚡ With momentum rolling over, this short structure offers a razor-sharp execution window down toward lower liquidity pockets. 💡 Tight risk parameters keep downside protection clear while aiming for key downside expansion levels. 💬 Are you positioning for the breakdown or waiting for a support test? 👇
⚠️ Not financial advice. Always manage your risk. 🛡️
🏷️ #SPYB #ShortSetup #Trading #Crypto #MarketUpdate
📉 ⚡
📉 $SPYB REJECTION AT KEY RESISTANCE SIGNALS AN EXPLOSIVE SHORT OPPORTUNITY AHEAD! 🚨
Entry: 770.00 – 771.00 ⚡
Target: 768.50 / 767.30 / 766.33 🎯
Stop Loss: 774.21 ⚠️
📌 Bears are stepping in heavy as $SPYB slams directly into overhead supply, leaving buying momentum completely exhausted at the highs. 🔍 Order flow reveals aggressive distribution under the surface as institutional liquidity absorbs remaining bids.
⚡ With momentum rolling over, this short structure offers a razor-sharp execution window down toward lower liquidity pockets. 💡 Tight risk parameters keep downside protection clear while aiming for key downside expansion levels. 💬 Are you positioning for the breakdown or waiting for a support test? 👇
⚠️ Not financial advice. Always manage your risk. 🛡️
🏷️ #SPYB #ShortSetup #Trading #Crypto #MarketUpdate
📉 ⚡
Entry: 770.00 – 771.00 ⚡
Target: 768.50 / 767.30 / 766.33 🎯
Stop Loss: 774.21 ⚠️
📌 Bears are stepping in heavy as $SPYB slams directly into overhead supply, leaving buying momentum completely exhausted at the highs. 🔍 Order flow reveals aggressive distribution under the surface as institutional liquidity absorbs remaining bids.
⚡ With momentum rolling over, this short structure offers a razor-sharp execution window down toward lower liquidity pockets. 💡 Tight risk parameters keep downside protection clear while aiming for key downside expansion levels. 💬 Are you positioning for the breakdown or waiting for a support test? 👇
⚠️ Not financial advice. Always manage your risk. 🛡️
🏷️ #SPYB #ShortSetup #Trading #Crypto #MarketUpdate
📉 ⚡
15
🚨 $SPYB REJECTION INTENSIFIES AS SELLERS DRAG PRICE TOWARD SUPPORT! 🐻
Entry: 770.00 - 771.50 ⚡
Target: 764.50 💥
Stop Loss: 773.00 ⚠️
The supply wall at $772–$774 held firm, completely snuffing out buyer momentum and flipping control back to the bears. 📉 Heavy sell volume is mounting fast as price probes the critical $770 level.
🔍 If this support snaps, expect a swift liquidity sweep straight down to lower targets. This high-conviction setup offers clean risk-reward for traders hunting downside momentum. 💬 Are you shorting the break of $770 or waiting for a relief retest? 👇
⚠️ Not financial advice. Always manage your risk. 🛡️
🏷️ #SPYB #ShortSetup #Trading #Crypto #MarketUpdate
🐻 📉
🚨 $SPYB REJECTION INTENSIFIES AS SELLERS DRAG PRICE TOWARD SUPPORT! 🐻
Entry: 770.00 - 771.50 ⚡
Target: 764.50 💥
Stop Loss: 773.00 ⚠️
The supply wall at $772–$774 held firm, completely snuffing out buyer momentum and flipping control back to the bears. 📉 Heavy sell volume is mounting fast as price probes the critical $770 level.
🔍 If this support snaps, expect a swift liquidity sweep straight down to lower targets. This high-conviction setup offers clean risk-reward for traders hunting downside momentum. 💬 Are you shorting the break of $770 or waiting for a relief retest? 👇
⚠️ Not financial advice. Always manage your risk. 🛡️
🏷️ #SPYB #ShortSetup #Trading #Crypto #MarketUpdate
🐻 📉
Entry: 770.00 - 771.50 ⚡
Target: 764.50 💥
Stop Loss: 773.00 ⚠️
The supply wall at $772–$774 held firm, completely snuffing out buyer momentum and flipping control back to the bears. 📉 Heavy sell volume is mounting fast as price probes the critical $770 level.
🔍 If this support snaps, expect a swift liquidity sweep straight down to lower targets. This high-conviction setup offers clean risk-reward for traders hunting downside momentum. 💬 Are you shorting the break of $770 or waiting for a relief retest? 👇
⚠️ Not financial advice. Always manage your risk. 🛡️
🏷️ #SPYB #ShortSetup #Trading #Crypto #MarketUpdate
🐻 📉
37
The hottest post on the feed today is asking, “Has Buffett made a move?” Its image shows panic selling as the Nasdaq plunges 3%. But at the same time, a traceable on-chain address just closed a $1.1 million long position in SP500 and flipped straight into a $10.81 million short—after already banking $30.41 million in profits. The interesting part is seeing these two scenes side by side: the narrative is calling for a dip-buy, while the positioning is betting on a drop.
First, look at the position itself. It was profitable, and the trader actively reversed direction; this wasn’t a passive hedge after getting stuck in a losing trade. The size jumped from $1.1 million to $10.81 million—nearly tenfold—and the direction flipped directly from long to short, with no transition in between. That kind of move either means they’ve seen something, or they’re making a structural basis or hedging play. You can’t tell which from one address alone, and that’s the biggest discount on the information. Even so, this is the first readable, sizable directional whale position to appear in tokenized S&P perpetuals 🔍 Previously, the positions in these products were opaque. Now, at least one trader has laid their cards on the table.
The second angle is the nature of this selloff. The S&P 500 fell 1.21%, its worst day since July; the Philadelphia Semiconductor Index dropped more than 6%; and the Nasdaq fell 3%. But the Dow edged up 0.02%. This isn’t a broad risk-off move; it’s a one-way deleveraging of tech and the AI complex. The trigger is ironic, too: Meta beat revenue expectations, yet its stock was hammered 7% after it raised AI capex forecasts. Good earnings, bad reaction—that suggests the market is starting to question the numerator-side logic of “spend money to buy growth,” rather than worrying about interest rates on the denominator side. This kind of structurally driven selloff has a particular trait: it won’t stop just because “some big name is buying the dip.” The sellers aren’t panicked retail traders; they’re institutions reassessing returns on capital. Brent crude has surged to $113, and tensions in the Middle East are escalating, adding another layer of cost pressure 📉
The third angle is what to watch in funding rates and positioning. At this level, if SPYB perpetual funding is still positive, or even elevated, that means longs are still paying to hold their positions. In that case, the $10.81 million short is collecting rent, and its odds are getting an extra boost from funding. On the other hand, if funding has already turned negative and shorts are getting crowded, the position’s marginal safety is lower. Open interest works the same way: price falling while open interest rises means new shorts are entering; price falling while open interest declines means longs are capitulating and exiting. The former can continue; the latter is more prone to a rebound. These two metrics are worth watching more than any screenshot of a “big name buying the dip.”
The risks should be clear. First, a single address doesn’t equal smart money. It could be a hedge leg or one side of an arbitrage; closing a long and opening a short is routine in basis trading and shouldn’t be read as “a whale declaring war.” Second, tokenized equity-index perpetuals are far less liquid than CME’s ES. Slippage on whale entries and exits, as well as deviations in mark price, can be magnified. A position that looks impressive on paper doesn’t mean it can be unwound smoothly. Third, the narrative and the positioning are now moving in opposite directions, and narratives always spread faster than positions change. Chasing hot posts to pick a direction usually just provides exit liquidity for someone else.
My take: this tech-stock pullback is a repricing of valuations, not an emotional oversold move. After the S&P 500’s worst single day since July, more volatility is likely—and that $10.81 million short at least shows that someone with real money doesn’t think the bottom is in yet. The real value of SPYB isn’t copy trading; it’s that, for the first time, directional bets on an equity index have become publicly readable on-chain information. Watching what that address does next is far more useful than fixating on the three letters in “Buffett.” Your position is your own. A signal from a single address can only be a reference point—not a reason to trade.
#股票财报季 #SPYB #Crypto
The hottest post on the feed today is asking, “Has Buffett made a move?” Its image shows panic selling as the Nasdaq plunges 3%. But at the same time, a traceable on-chain address just closed a $1.1 million long position in SP500 and flipped straight into a $10.81 million short—after already banking $30.41 million in profits. The interesting part is seeing these two scenes side by side: the narrative is calling for a dip-buy, while the positioning is betting on a drop.
First, look at the position itself. It was profitable, and the trader actively reversed direction; this wasn’t a passive hedge after getting stuck in a losing trade. The size jumped from $1.1 million to $10.81 million—nearly tenfold—and the direction flipped directly from long to short, with no transition in between. That kind of move either means they’ve seen something, or they’re making a structural basis or hedging play. You can’t tell which from one address alone, and that’s the biggest discount on the information. Even so, this is the first readable, sizable directional whale position to appear in tokenized S&P perpetuals 🔍 Previously, the positions in these products were opaque. Now, at least one trader has laid their cards on the table.
The second angle is the nature of this selloff. The S&P 500 fell 1.21%, its worst day since July; the Philadelphia Semiconductor Index dropped more than 6%; and the Nasdaq fell 3%. But the Dow edged up 0.02%. This isn’t a broad risk-off move; it’s a one-way deleveraging of tech and the AI complex. The trigger is ironic, too: Meta beat revenue expectations, yet its stock was hammered 7% after it raised AI capex forecasts. Good earnings, bad reaction—that suggests the market is starting to question the numerator-side logic of “spend money to buy growth,” rather than worrying about interest rates on the denominator side. This kind of structurally driven selloff has a particular trait: it won’t stop just because “some big name is buying the dip.” The sellers aren’t panicked retail traders; they’re institutions reassessing returns on capital. Brent crude has surged to $113, and tensions in the Middle East are escalating, adding another layer of cost pressure 📉
The third angle is what to watch in funding rates and positioning. At this level, if SPYB perpetual funding is still positive, or even elevated, that means longs are still paying to hold their positions. In that case, the $10.81 million short is collecting rent, and its odds are getting an extra boost from funding. On the other hand, if funding has already turned negative and shorts are getting crowded, the position’s marginal safety is lower. Open interest works the same way: price falling while open interest rises means new shorts are entering; price falling while open interest declines means longs are capitulating and exiting. The former can continue; the latter is more prone to a rebound. These two metrics are worth watching more than any screenshot of a “big name buying the dip.”
The risks should be clear. First, a single address doesn’t equal smart money. It could be a hedge leg or one side of an arbitrage; closing a long and opening a short is routine in basis trading and shouldn’t be read as “a whale declaring war.” Second, tokenized equity-index perpetuals are far less liquid than CME’s ES. Slippage on whale entries and exits, as well as deviations in mark price, can be magnified. A position that looks impressive on paper doesn’t mean it can be unwound smoothly. Third, the narrative and the positioning are now moving in opposite directions, and narratives always spread faster than positions change. Chasing hot posts to pick a direction usually just provides exit liquidity for someone else.
My take: this tech-stock pullback is a repricing of valuations, not an emotional oversold move. After the S&P 500’s worst single day since July, more volatility is likely—and that $10.81 million short at least shows that someone with real money doesn’t think the bottom is in yet. The real value of SPYB isn’t copy trading; it’s that, for the first time, directional bets on an equity index have become publicly readable on-chain information. Watching what that address does next is far more useful than fixating on the three letters in “Buffett.” Your position is your own. A signal from a single address can only be a reference point—not a reason to trade.
#股票财报季 #SPYB #Crypto
First, look at the position itself. It was profitable, and the trader actively reversed direction; this wasn’t a passive hedge after getting stuck in a losing trade. The size jumped from $1.1 million to $10.81 million—nearly tenfold—and the direction flipped directly from long to short, with no transition in between. That kind of move either means they’ve seen something, or they’re making a structural basis or hedging play. You can’t tell which from one address alone, and that’s the biggest discount on the information. Even so, this is the first readable, sizable directional whale position to appear in tokenized S&P perpetuals 🔍 Previously, the positions in these products were opaque. Now, at least one trader has laid their cards on the table.
The second angle is the nature of this selloff. The S&P 500 fell 1.21%, its worst day since July; the Philadelphia Semiconductor Index dropped more than 6%; and the Nasdaq fell 3%. But the Dow edged up 0.02%. This isn’t a broad risk-off move; it’s a one-way deleveraging of tech and the AI complex. The trigger is ironic, too: Meta beat revenue expectations, yet its stock was hammered 7% after it raised AI capex forecasts. Good earnings, bad reaction—that suggests the market is starting to question the numerator-side logic of “spend money to buy growth,” rather than worrying about interest rates on the denominator side. This kind of structurally driven selloff has a particular trait: it won’t stop just because “some big name is buying the dip.” The sellers aren’t panicked retail traders; they’re institutions reassessing returns on capital. Brent crude has surged to $113, and tensions in the Middle East are escalating, adding another layer of cost pressure 📉
The third angle is what to watch in funding rates and positioning. At this level, if SPYB perpetual funding is still positive, or even elevated, that means longs are still paying to hold their positions. In that case, the $10.81 million short is collecting rent, and its odds are getting an extra boost from funding. On the other hand, if funding has already turned negative and shorts are getting crowded, the position’s marginal safety is lower. Open interest works the same way: price falling while open interest rises means new shorts are entering; price falling while open interest declines means longs are capitulating and exiting. The former can continue; the latter is more prone to a rebound. These two metrics are worth watching more than any screenshot of a “big name buying the dip.”
The risks should be clear. First, a single address doesn’t equal smart money. It could be a hedge leg or one side of an arbitrage; closing a long and opening a short is routine in basis trading and shouldn’t be read as “a whale declaring war.” Second, tokenized equity-index perpetuals are far less liquid than CME’s ES. Slippage on whale entries and exits, as well as deviations in mark price, can be magnified. A position that looks impressive on paper doesn’t mean it can be unwound smoothly. Third, the narrative and the positioning are now moving in opposite directions, and narratives always spread faster than positions change. Chasing hot posts to pick a direction usually just provides exit liquidity for someone else.
My take: this tech-stock pullback is a repricing of valuations, not an emotional oversold move. After the S&P 500’s worst single day since July, more volatility is likely—and that $10.81 million short at least shows that someone with real money doesn’t think the bottom is in yet. The real value of SPYB isn’t copy trading; it’s that, for the first time, directional bets on an equity index have become publicly readable on-chain information. Watching what that address does next is far more useful than fixating on the three letters in “Buffett.” Your position is your own. A signal from a single address can only be a reference point—not a reason to trade.
#股票财报季 #SPYB #Crypto
14
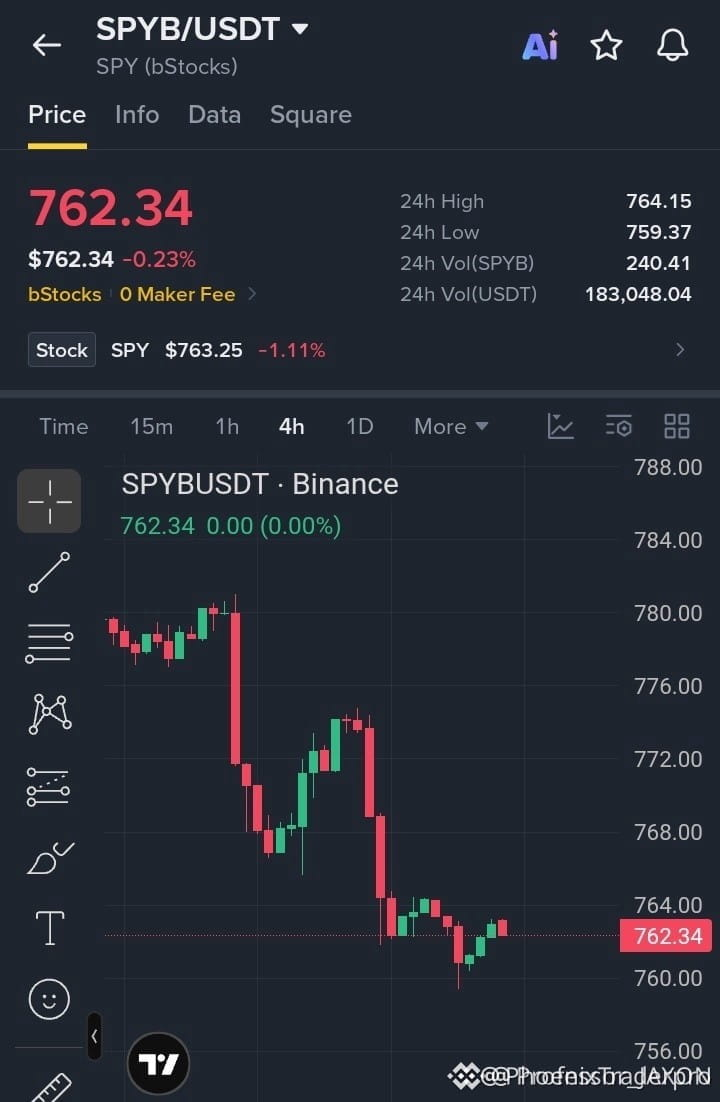
🔴 $SPYB CRUSHED UNDER HEAVY CEILING AS BEARS DEFEND KEY RESISTANCE! 📉
Entry: 762.00–763.00 ⚡
Target: 760.50, 758.50, 756.00 🎯
Stop Loss: 765.00 ⚠️
📌 Sellers remain firmly in control on the 4-hour chart, slamming down every relief attempt beneath the 764 resistance zone and printing textbook lower highs. 📊 Momentum heavily favors downside continuation, with a clean breakdown below 760 poised to trigger rapid liquidation cascades into lower demand blocks.
💡 Structural invalidation sits tightly above 765–768, locking in exceptional asymmetric risk for this momentum setup. 💬 Are you pressing the short continuation into support, or waiting for a liquidity squeeze first? 👇
⚠️ Not financial advice. Always manage your risk. 🛡️
🏷️ #SPYB #ShortSetup #PriceAction #Bearish #CryptoTrading
🎯 🐻
🔴 $SPYB CRUSHED UNDER HEAVY CEILING AS BEARS DEFEND KEY RESISTANCE! 📉
Entry: 762.00–763.00 ⚡
Target: 760.50, 758.50, 756.00 🎯
Stop Loss: 765.00 ⚠️
📌 Sellers remain firmly in control on the 4-hour chart, slamming down every relief attempt beneath the 764 resistance zone and printing textbook lower highs. 📊 Momentum heavily favors downside continuation, with a clean breakdown below 760 poised to trigger rapid liquidation cascades into lower demand blocks.
💡 Structural invalidation sits tightly above 765–768, locking in exceptional asymmetric risk for this momentum setup. 💬 Are you pressing the short continuation into support, or waiting for a liquidity squeeze first? 👇
⚠️ Not financial advice. Always manage your risk. 🛡️
🏷️ #SPYB #ShortSetup #PriceAction #Bearish #CryptoTrading
🎯 🐻
Entry: 762.00–763.00 ⚡
Target: 760.50, 758.50, 756.00 🎯
Stop Loss: 765.00 ⚠️
📌 Sellers remain firmly in control on the 4-hour chart, slamming down every relief attempt beneath the 764 resistance zone and printing textbook lower highs. 📊 Momentum heavily favors downside continuation, with a clean breakdown below 760 poised to trigger rapid liquidation cascades into lower demand blocks.
💡 Structural invalidation sits tightly above 765–768, locking in exceptional asymmetric risk for this momentum setup. 💬 Are you pressing the short continuation into support, or waiting for a liquidity squeeze first? 👇
⚠️ Not financial advice. Always manage your risk. 🛡️
🏷️ #SPYB #ShortSetup #PriceAction #Bearish #CryptoTrading
🎯 🐻
14

·
--
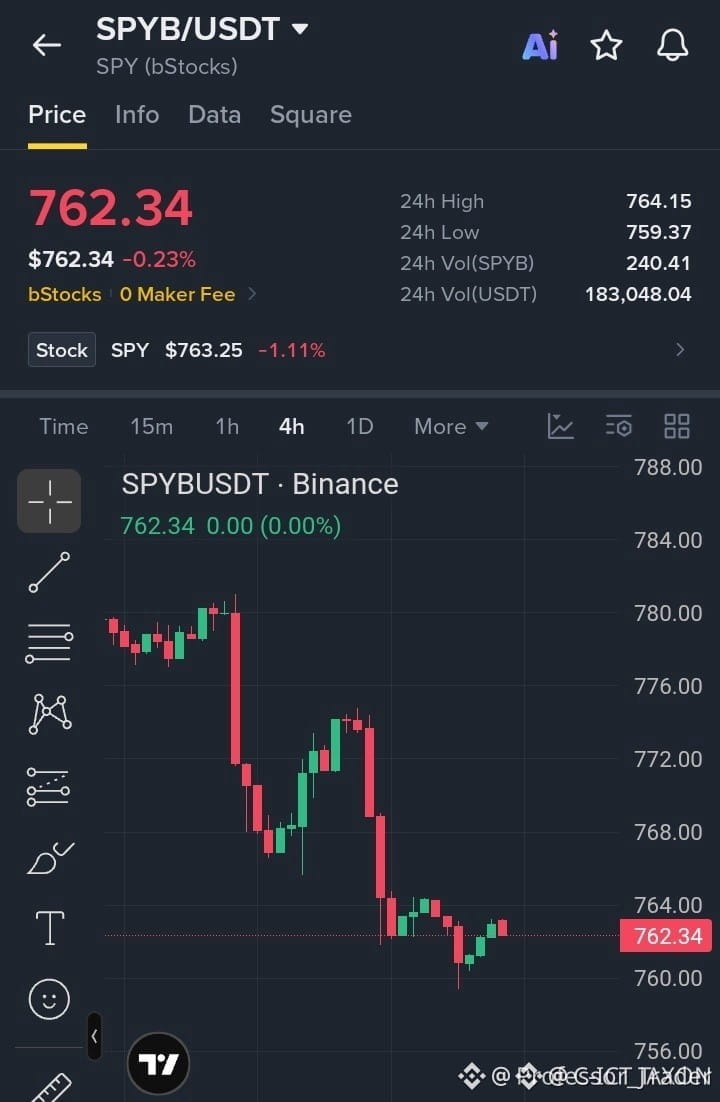
🚨 $SPYB REJECTS CRITICAL RESISTANCE AS INSTITUTIONAL SELLERS EXPAND DOWNSIDE MOMENTUM! 📉
Entry: 762.00 - 763.00 ⚡
Target: 760.50 - 756.00 🎯
Stop Loss: 765.00 ⚠️
📌 Market structure on the 4-hour timeframe remains decisively bearish, printing consecutive lower highs following heavy sell-side displacement. Institutional supply at the 764 block continues to cap upward relief, trapping late buyers trying to front-run a bottom.
🌊 A clean breakdown below 760 will expose resting sell-side liquidity, paving the way for an inefficiency fill down to structural support. 💬 Will bears trigger an immediate breakdown below 760, or do you anticipate one last liquidity sweep higher? 👇
⚠️ Not financial advice. Always manage your risk. 🛡️
🏷️ #SPYB #ShortSetup #Trading #Crypto #MarketStructure
🎯 🦈
🚨 $SPYB REJECTS CRITICAL RESISTANCE AS INSTITUTIONAL SELLERS EXPAND DOWNSIDE MOMENTUM! 📉
Entry: 762.00 - 763.00 ⚡
Target: 760.50 - 756.00 🎯
Stop Loss: 765.00 ⚠️
📌 Market structure on the 4-hour timeframe remains decisively bearish, printing consecutive lower highs following heavy sell-side displacement. Institutional supply at the 764 block continues to cap upward relief, trapping late buyers trying to front-run a bottom.
🌊 A clean breakdown below 760 will expose resting sell-side liquidity, paving the way for an inefficiency fill down to structural support. 💬 Will bears trigger an immediate breakdown below 760, or do you anticipate one last liquidity sweep higher? 👇
⚠️ Not financial advice. Always manage your risk. 🛡️
🏷️ #SPYB #ShortSetup #Trading #Crypto #MarketStructure
🎯 🦈
Entry: 762.00 - 763.00 ⚡
Target: 760.50 - 756.00 🎯
Stop Loss: 765.00 ⚠️
📌 Market structure on the 4-hour timeframe remains decisively bearish, printing consecutive lower highs following heavy sell-side displacement. Institutional supply at the 764 block continues to cap upward relief, trapping late buyers trying to front-run a bottom.
🌊 A clean breakdown below 760 will expose resting sell-side liquidity, paving the way for an inefficiency fill down to structural support. 💬 Will bears trigger an immediate breakdown below 760, or do you anticipate one last liquidity sweep higher? 👇
⚠️ Not financial advice. Always manage your risk. 🛡️
🏷️ #SPYB #ShortSetup #Trading #Crypto #MarketStructure
🎯 🦈
7

Article
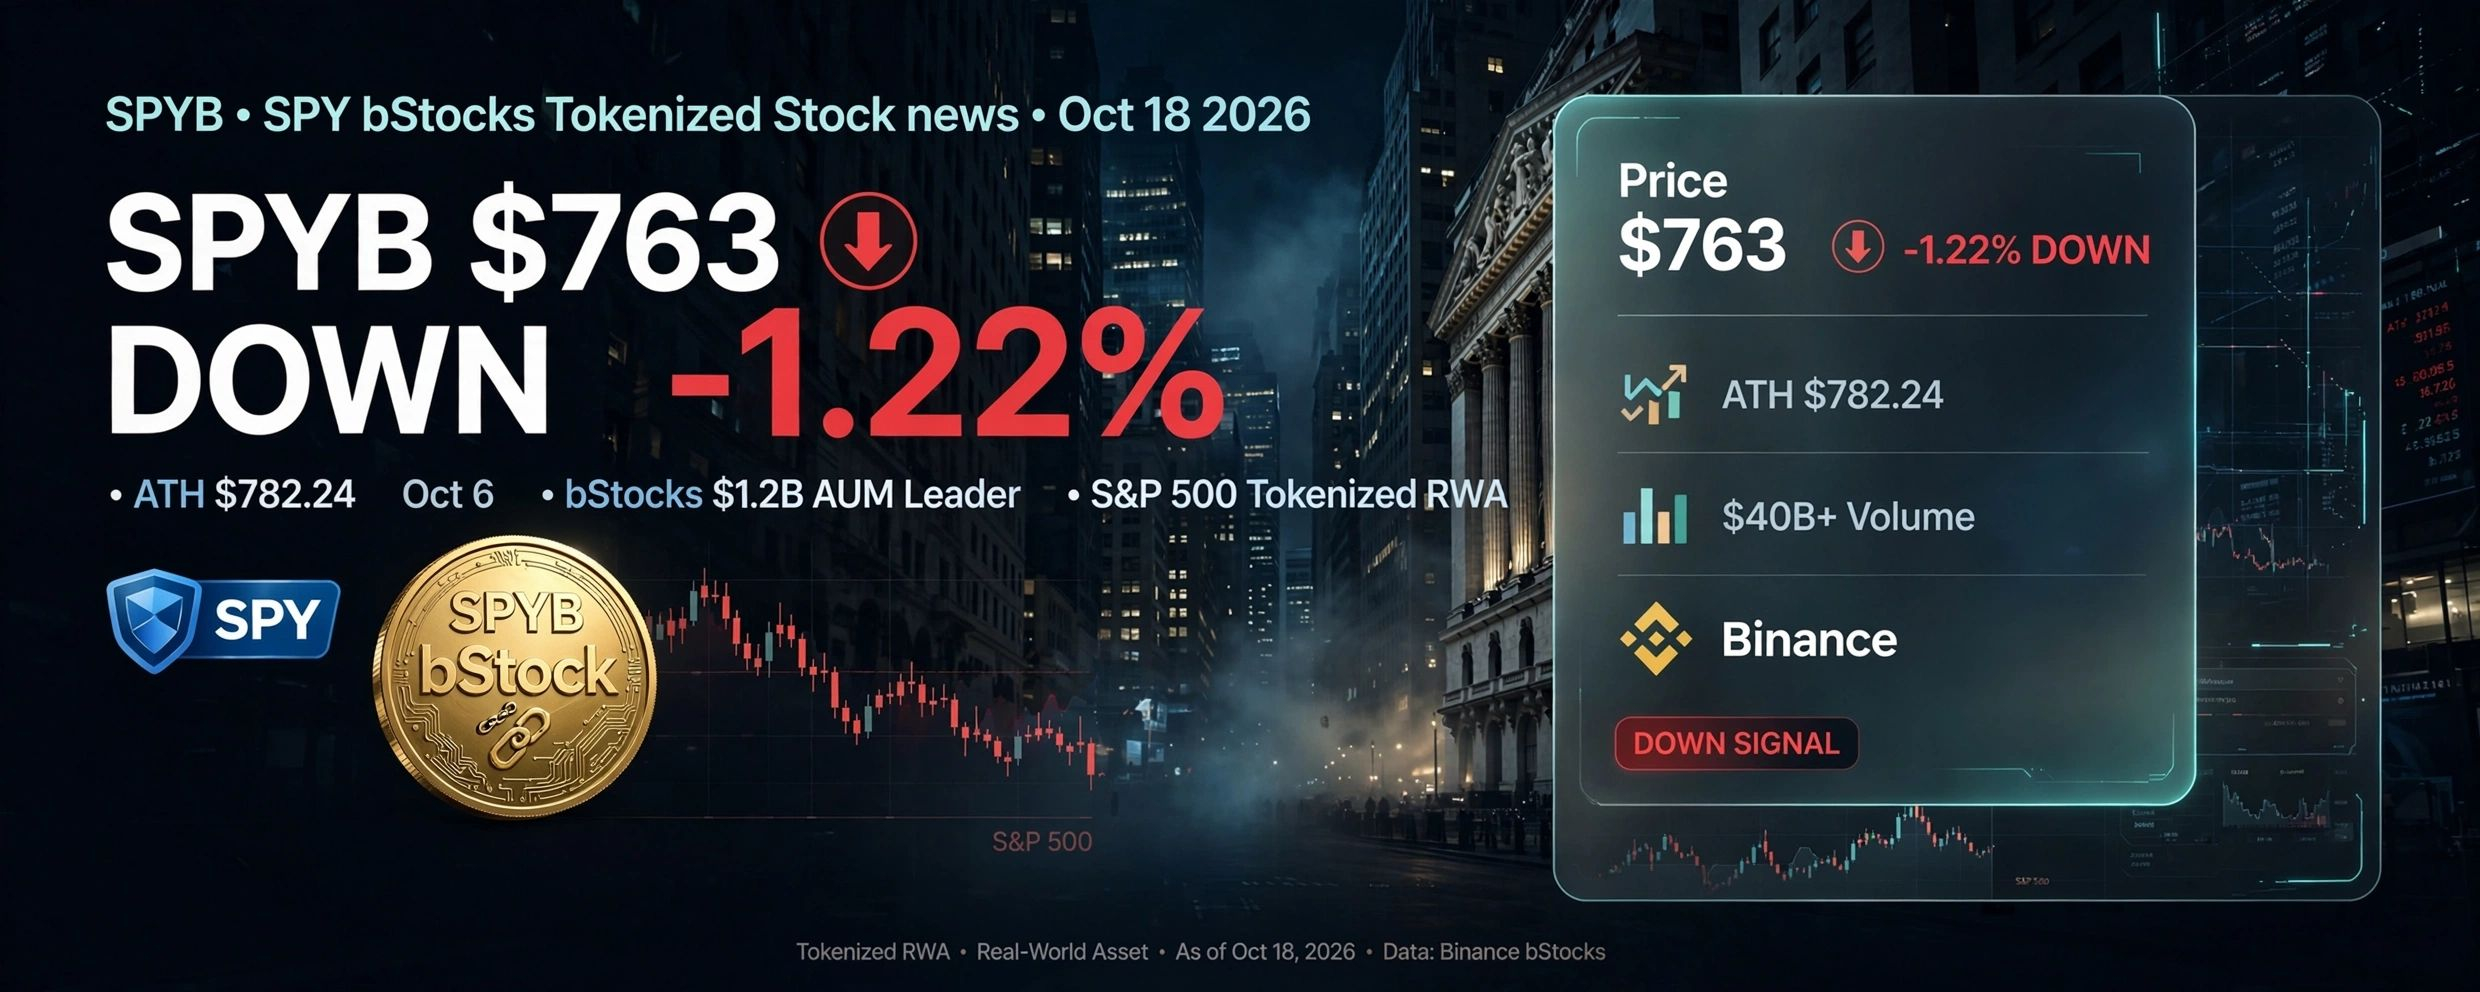
$SPYB News – Tokenized S&P 500 Asset Remains in Focus | October 18, 2026$SPYB , linked to the SPDR S&P 500 ETF through Binance’s tokenized bStocks product, continues to attract attention in the tokenized-asset market.
Recent market data showed SPYB trading around $770–$779 in mid-October, with prices reflecting movements in the underlying ETF.
Binance previously announced support for eligible $SPYB holders to receive net SPY dividends reinvested into additional tokenized units.
Market participants are watching U.S. equity trends, trading activity, and tokenized-asset demand for potential direction.$ETH
{spot}(ETHUSDT)
Note: SPYB is a tokenized asset, not a typical cryptocurrency; prices can fluctuate, and availability depends on applicable rules. DYOR.
#SPYB #BinanceSquare #TokenizedAssets #CryptoNews #SP500
$SPYB News – Tokenized S&P 500 Asset Remains in Focus | October 18, 2026
$SPYB , linked to the SPDR S&P 500 ETF through Binance’s tokenized bStocks product, continues to attract attention in the tokenized-asset market.
Recent market data showed SPYB trading around $770–$779 in mid-October, with prices reflecting movements in the underlying ETF.
Binance previously announced support for eligible $SPYB holders to receive net SPY dividends reinvested into additional tokenized units.
Market participants are watching U.S. equity trends, trading activity, and tokenized-asset demand for potential direction.$ETH
Note: SPYB is a tokenized asset, not a typical cryptocurrency; prices can fluctuate, and availability depends on applicable rules. DYOR.
#SPYB #BinanceSquare #TokenizedAssets #CryptoNews #SP500
Recent market data showed SPYB trading around $770–$779 in mid-October, with prices reflecting movements in the underlying ETF.
Binance previously announced support for eligible $SPYB holders to receive net SPY dividends reinvested into additional tokenized units.
Market participants are watching U.S. equity trends, trading activity, and tokenized-asset demand for potential direction.$ETH
Note: SPYB is a tokenized asset, not a typical cryptocurrency; prices can fluctuate, and availability depends on applicable rules. DYOR.
#SPYB #BinanceSquare #TokenizedAssets #CryptoNews #SP500
25

·
--
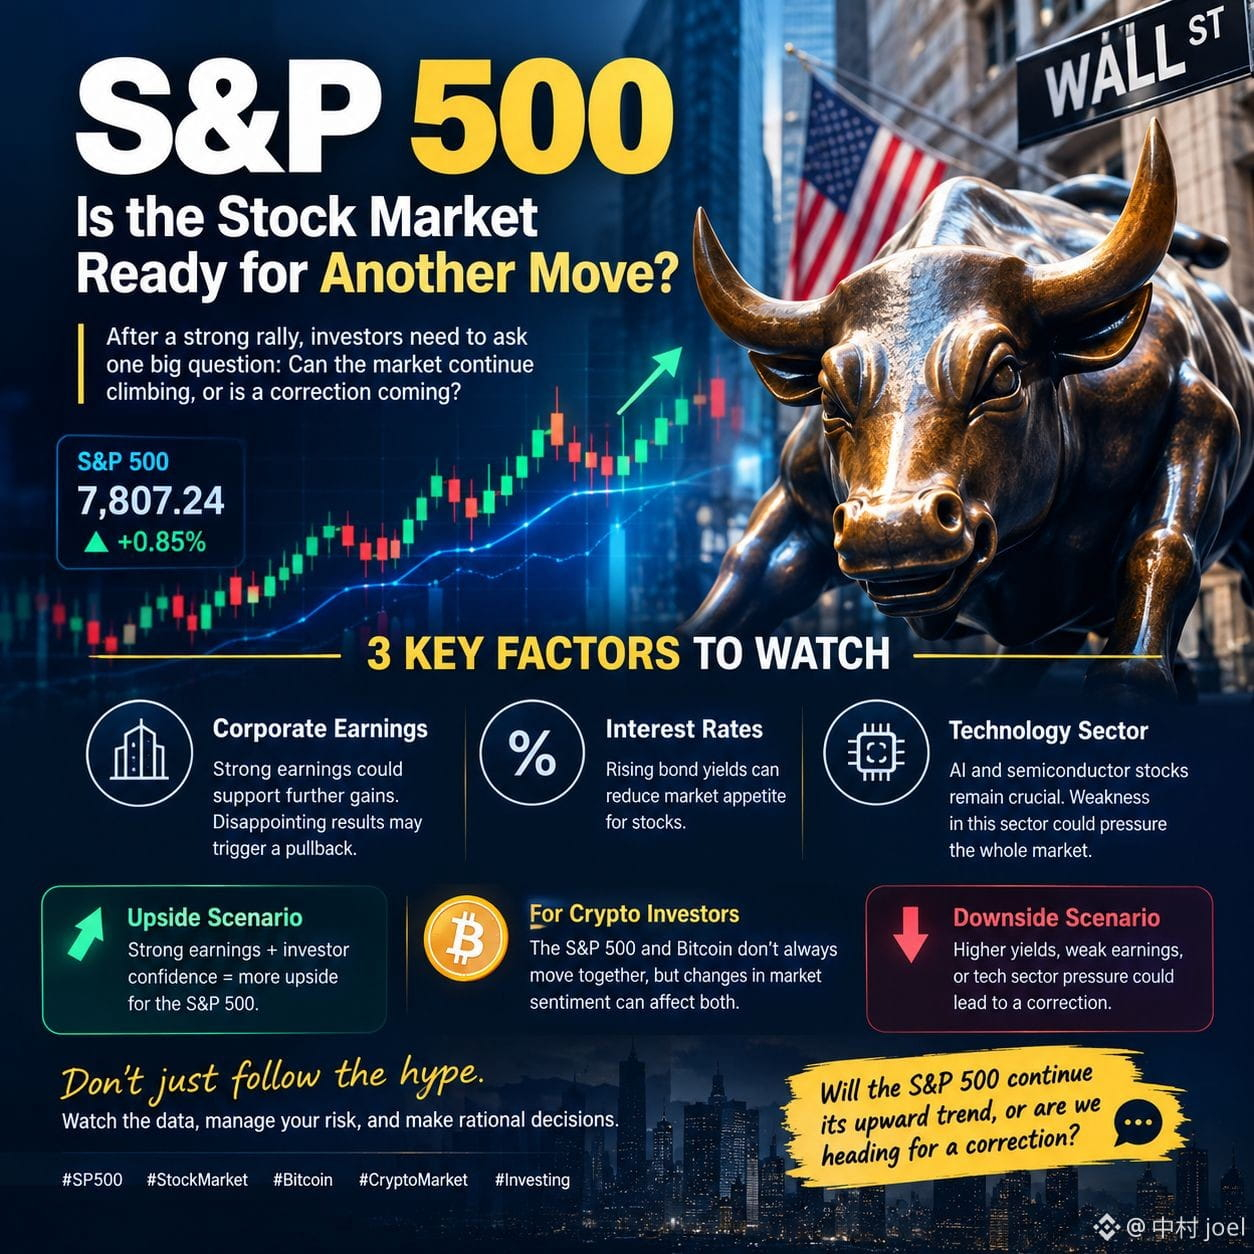
📊 S&P 500: Is the Stock Market Ready for Another Move?
The S&P 500 remains one of the most important indicators of the US stock market. But after a strong rally, investors need to ask one big question: Can the market continue climbing, or is a correction coming?
Three key factors deserve attention right now: corporate earnings, interest rates, and the technology sector, especially AI and semiconductor stocks.
📈 If companies report strong earnings and investor confidence remains high, the S&P 500 could find support for further gains.
📉 However, rising bond yields, disappointing earnings, or weakness in technology stocks could trigger selling pressure.
For crypto investors, the S&P 500 is also worth watching. Bitcoin and US stocks sometimes move in the same direction when market sentiment changes, although their relationship is not always consistent.
My view? Don't assume the market will keep rising just because it has performed well. Watch the data, manage risk, and avoid making emotional decisions.
What do you think? Will the S&P 500 continue its upward trend, or are we heading for a correction? 👇
$SPYB $SPCXB $TSLAB
#SP500
#StockMarket
#SPYB
📊 S&P 500: Is the Stock Market Ready for Another Move?
The S&P 500 remains one of the most important indicators of the US stock market. But after a strong rally, investors need to ask one big question: Can the market continue climbing, or is a correction coming?
Three key factors deserve attention right now: corporate earnings, interest rates, and the technology sector, especially AI and semiconductor stocks.
📈 If companies report strong earnings and investor confidence remains high, the S&P 500 could find support for further gains.
📉 However, rising bond yields, disappointing earnings, or weakness in technology stocks could trigger selling pressure.
For crypto investors, the S&P 500 is also worth watching. Bitcoin and US stocks sometimes move in the same direction when market sentiment changes, although their relationship is not always consistent.
My view? Don't assume the market will keep rising just because it has performed well. Watch the data, manage risk, and avoid making emotional decisions.
What do you think? Will the S&P 500 continue its upward trend, or are we heading for a correction? 👇
$SPYB $SPCXB $TSLAB
#SP500
#StockMarket
#SPYB
The S&P 500 remains one of the most important indicators of the US stock market. But after a strong rally, investors need to ask one big question: Can the market continue climbing, or is a correction coming?
Three key factors deserve attention right now: corporate earnings, interest rates, and the technology sector, especially AI and semiconductor stocks.
📈 If companies report strong earnings and investor confidence remains high, the S&P 500 could find support for further gains.
📉 However, rising bond yields, disappointing earnings, or weakness in technology stocks could trigger selling pressure.
For crypto investors, the S&P 500 is also worth watching. Bitcoin and US stocks sometimes move in the same direction when market sentiment changes, although their relationship is not always consistent.
My view? Don't assume the market will keep rising just because it has performed well. Watch the data, manage risk, and avoid making emotional decisions.
What do you think? Will the S&P 500 continue its upward trend, or are we heading for a correction? 👇
$SPYB $SPCXB $TSLAB
#SP500
#StockMarket
#SPYB
1.2k
3
46
1.2k

·
--
Bullish
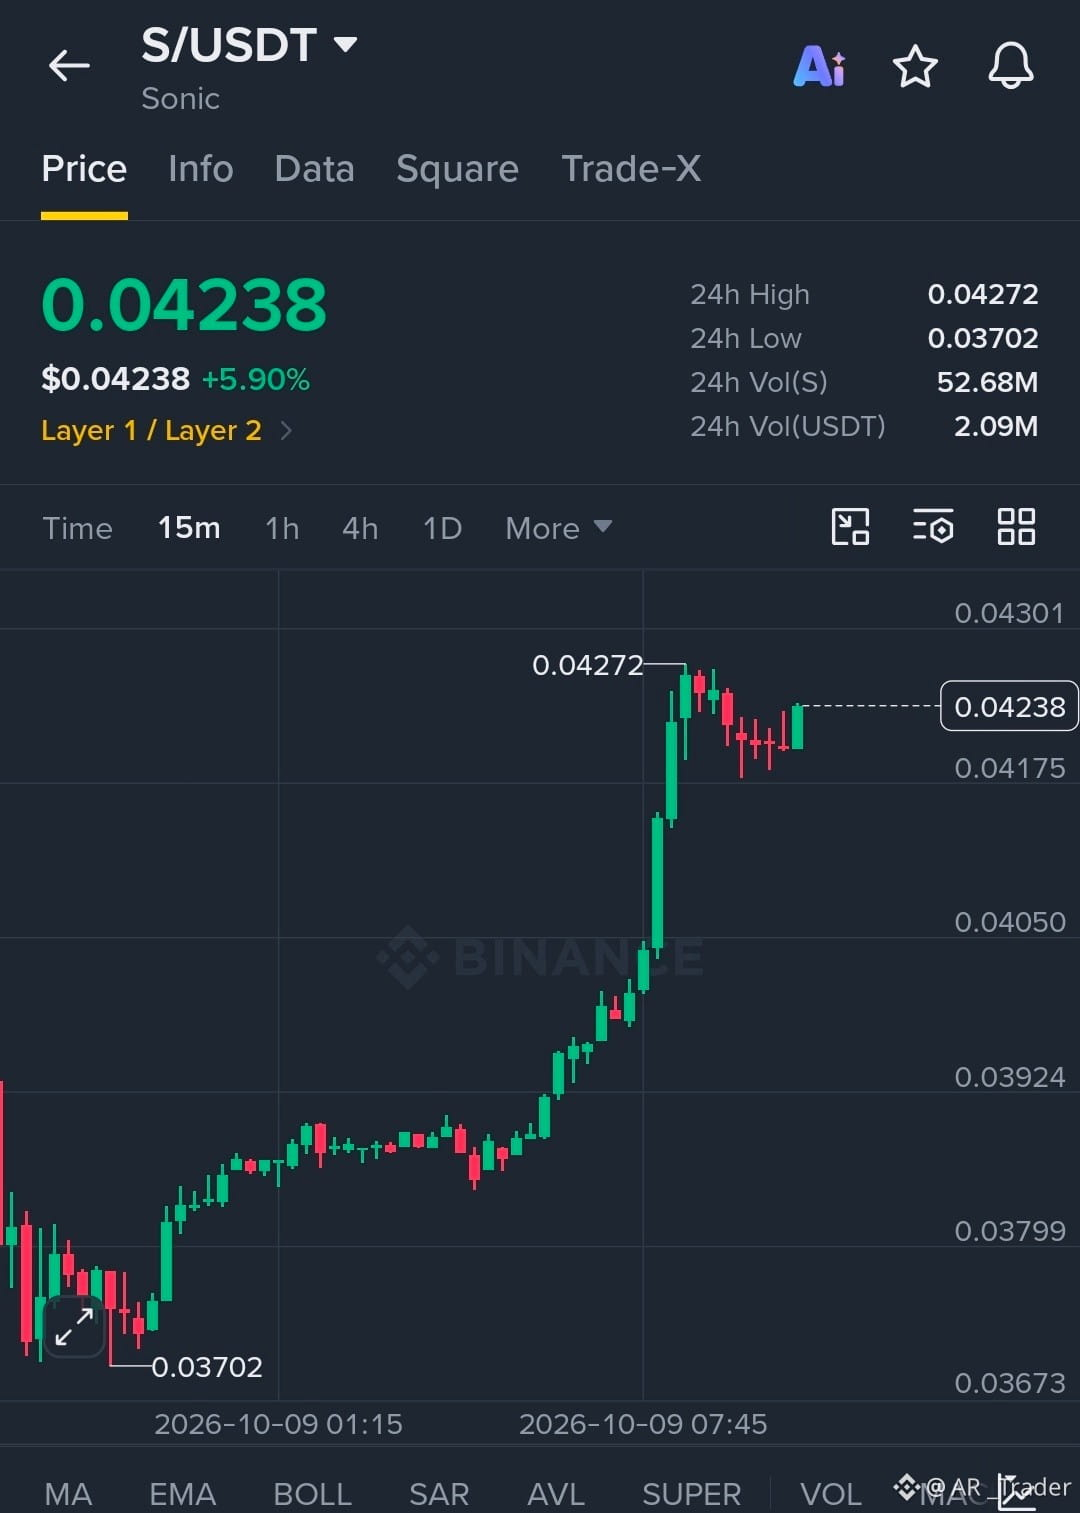
$SPYB Is Holding Strong Near Resistance And Another Push Could Be Coming
#spyb is showing bullish momentum after recovering from 0.03702 and now trading near 0.04238 Buyers are testing the 0.04272 resistance and a clean breakout could target 0.04301 and 0.04400 while 0.04175 remains the key support zone
{spot}(SPYBUSDT)
$PYPLB
{spot}(PYPLBUSDT)
$$龙虾
{future}(龙虾USDT)
$SPYB Is Holding Strong Near Resistance And Another Push Could Be Coming
#spyb is showing bullish momentum after recovering from 0.03702 and now trading near 0.04238 Buyers are testing the 0.04272 resistance and a clean breakout could target 0.04301 and 0.04400 while 0.04175 remains the key support zone
$PYPLB
$$龙虾
#spyb is showing bullish momentum after recovering from 0.03702 and now trading near 0.04238 Buyers are testing the 0.04272 resistance and a clean breakout could target 0.04301 and 0.04400 while 0.04175 remains the key support zone
$PYPLB
$$龙虾
1
94
·
--
Bullish
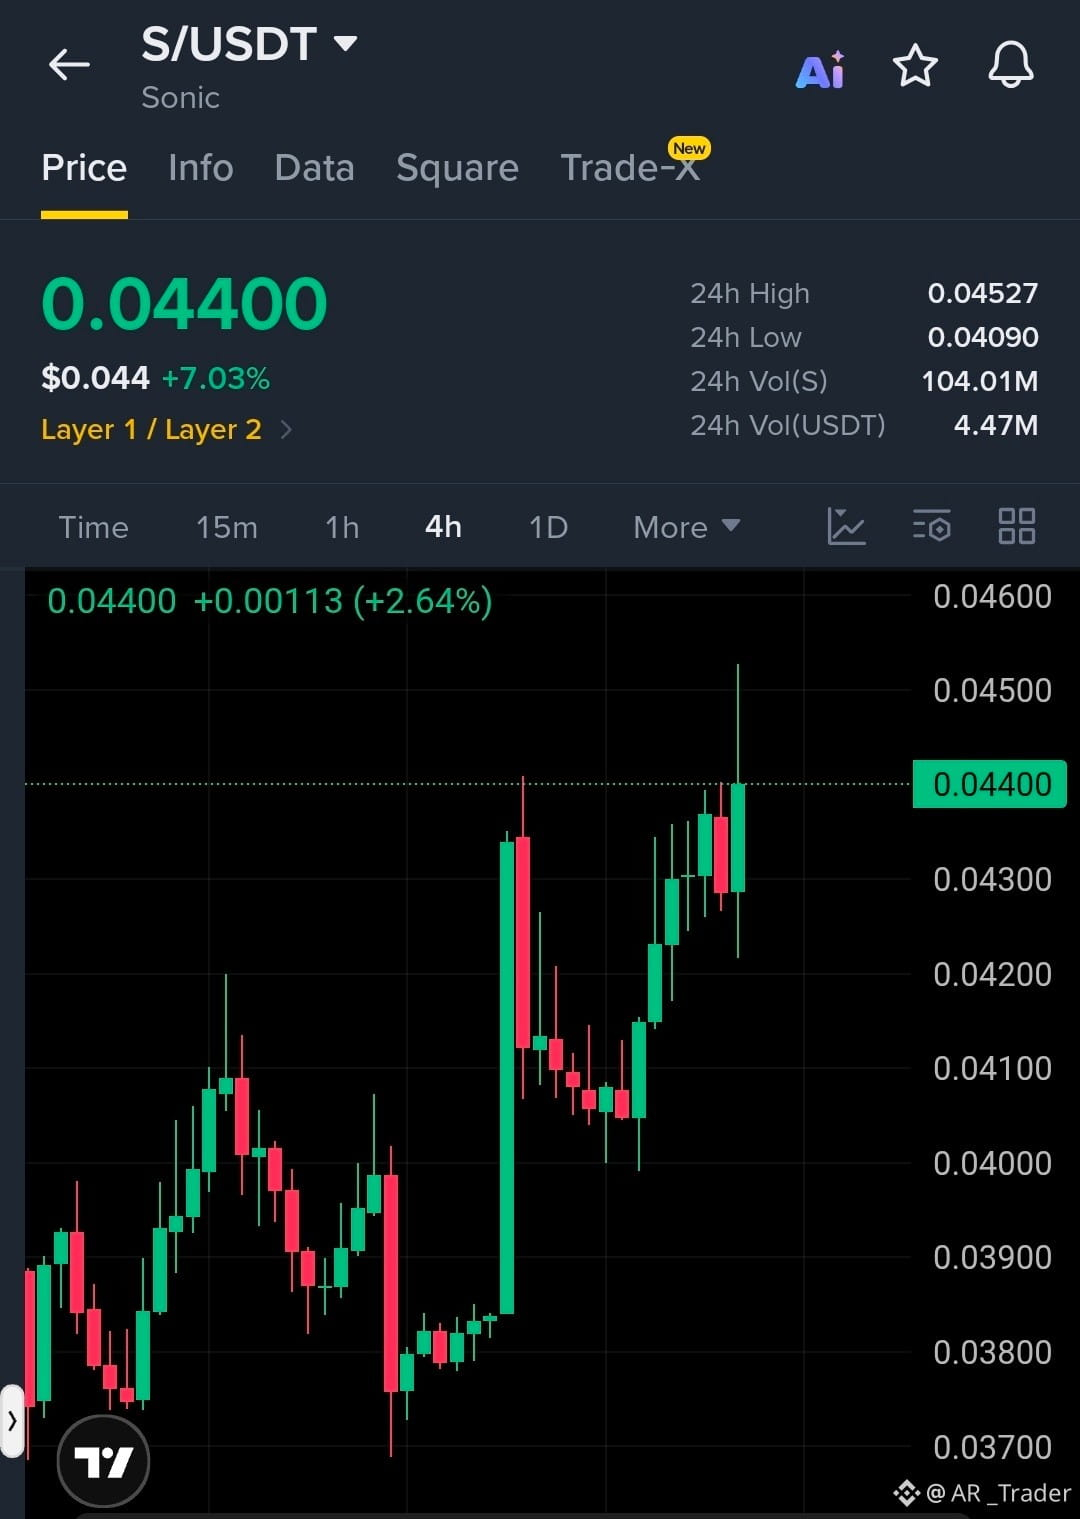
$SPYB Is Building Strong Momentum For The Next Move…!!
#spyb S is holding a bullish structure after the recent breakout and buyers are defending the 0.04300 area A clean break above 0.04527 could push momentum toward 0.04600 and 0.04700 while 0.04200 remains the key support zone
{spot}(SPYBUSDT)
$SPCXB
{spot}(SPCXBUSDT)
$龙虾
{future}(龙虾USDT)
$SPYB Is Building Strong Momentum For The Next Move…!!
#spyb S is holding a bullish structure after the recent breakout and buyers are defending the 0.04300 area A clean break above 0.04527 could push momentum toward 0.04600 and 0.04700 while 0.04200 remains the key support zone
$SPCXB
$龙虾
#spyb S is holding a bullish structure after the recent breakout and buyers are defending the 0.04300 area A clean break above 0.04527 could push momentum toward 0.04600 and 0.04700 while 0.04200 remains the key support zone
$SPCXB
$龙虾
117

·
--
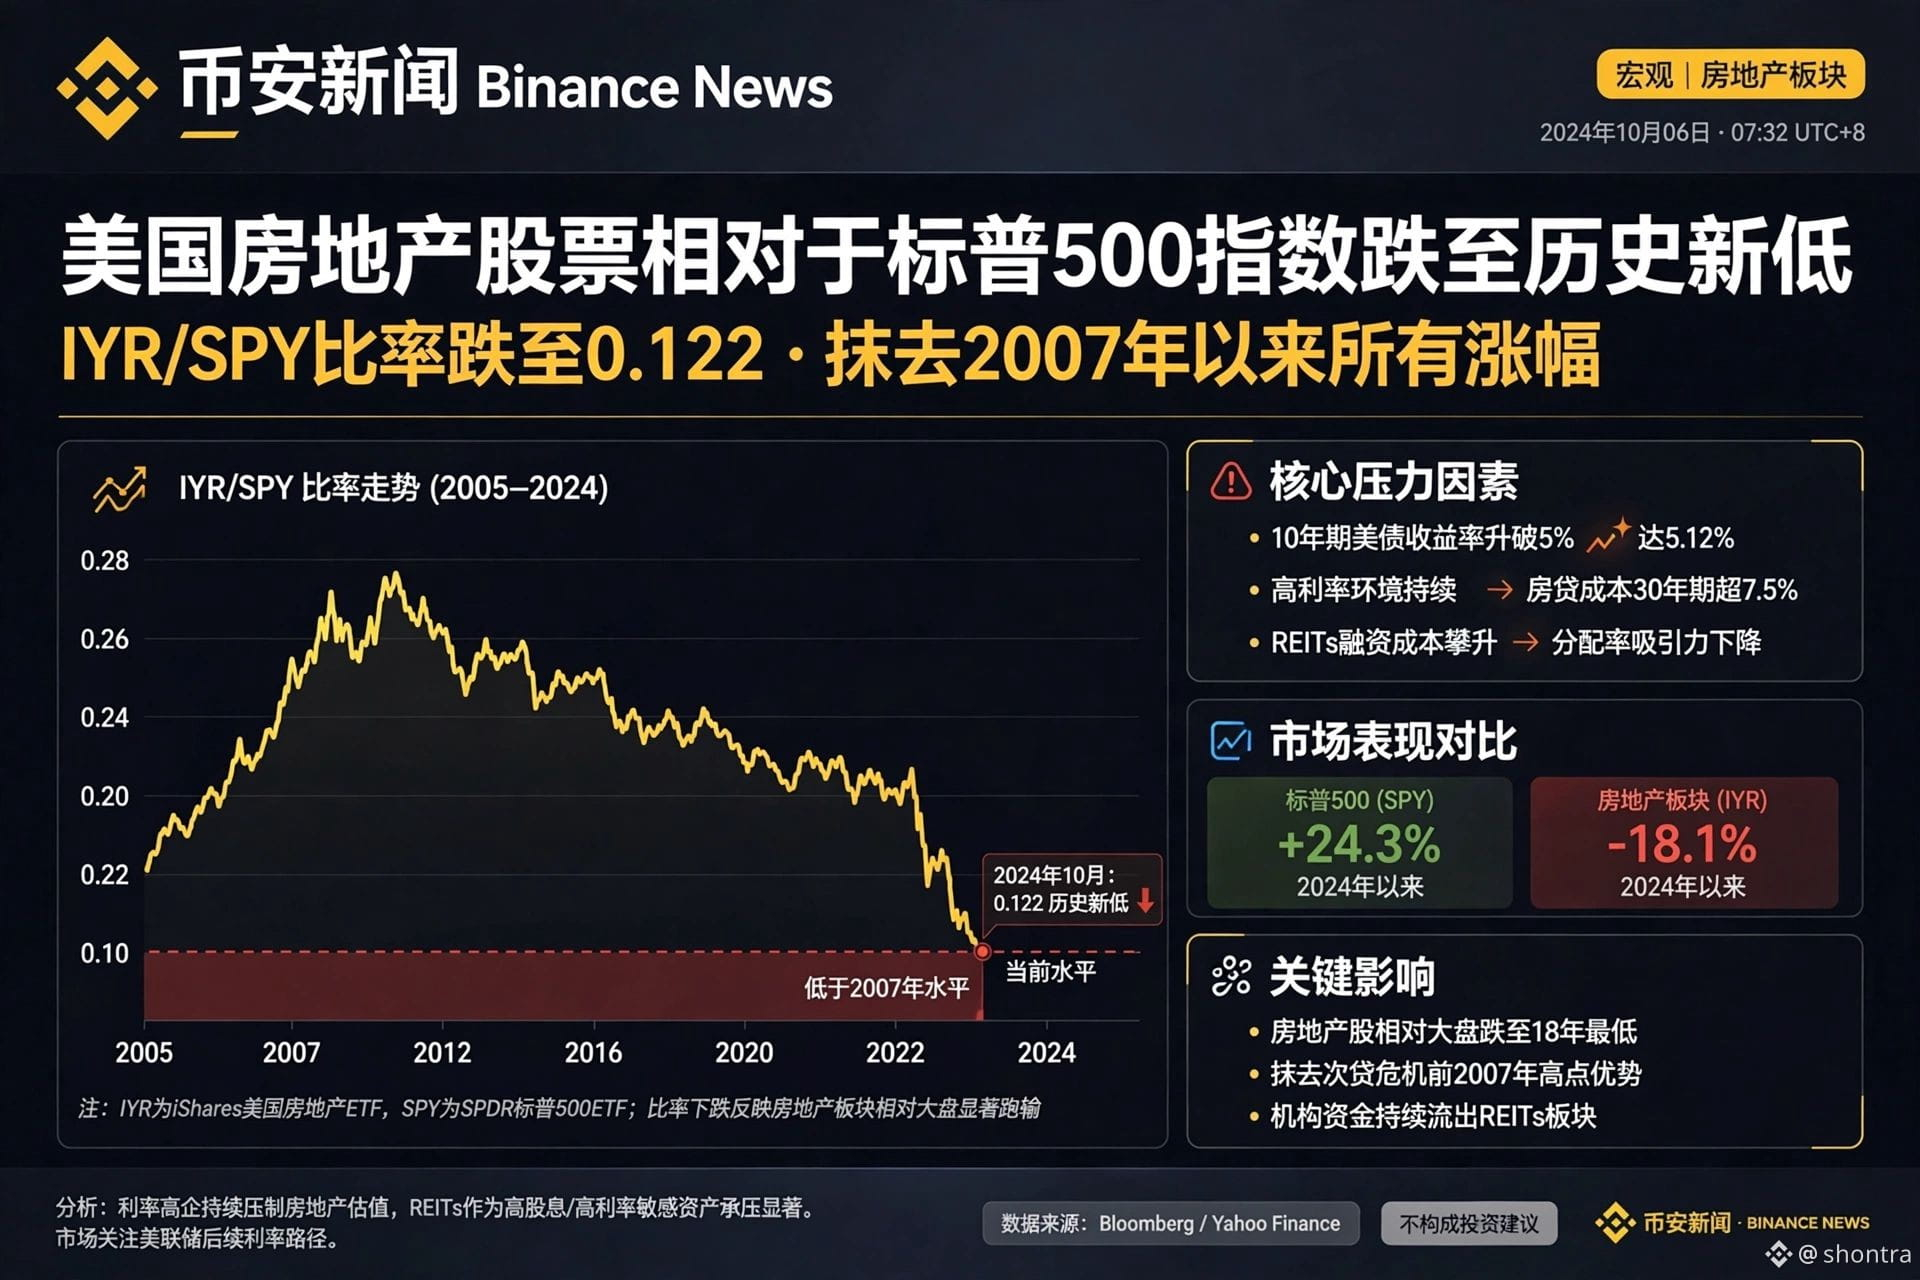
Chinese version complete — beautiful, realistic:
*U.S. real estate stocks hit an all-time low relative to the S&P 500*
*IYR/SPY ratio fell to 0.122 · wiping out all gains since 2007*
The 10-year U.S. Treasury yield climbed above 5% to 5.12%. Persistently high interest rates and 30-year mortgage rates above 7.5% are weighing on REITs. #iyr $IYR.ETF #spyb $SPYB
{spot}(SPYBUSDT)
{etf_us}(IYR.ETF)
Chinese version complete — beautiful, realistic:
*U.S. real estate stocks hit an all-time low relative to the S&P 500*
*IYR/SPY ratio fell to 0.122 · wiping out all gains since 2007*
The 10-year U.S. Treasury yield climbed above 5% to 5.12%. Persistently high interest rates and 30-year mortgage rates above 7.5% are weighing on REITs. #iyr $IYR.ETF #spyb $SPYB
*U.S. real estate stocks hit an all-time low relative to the S&P 500*
*IYR/SPY ratio fell to 0.122 · wiping out all gains since 2007*
The 10-year U.S. Treasury yield climbed above 5% to 5.12%. Persistently high interest rates and 30-year mortgage rates above 7.5% are weighing on REITs. #iyr $IYR.ETF #spyb $SPYB
IYRETF-1.68%
SPYB-4.16%
62
Log in to explore more content
Join global crypto users on Binance Square
⚡️ Get latest and useful information about crypto.
💬 Trusted by the world’s largest crypto exchange.
👍 Discover real insights from verified creators.
Email / Phone number
Trending Topics
1
#BinanceReopensWithdrawalsForMoreAssets
845,632 views
4,592 Discussing
2
#Binance98PercentReplenished
186,662 views
1,861 Discussing
3
#USStocksSlipandCryptoMarketUnderBroadPressure
12,665 views
238 Discussing
4
#StrategySTRCResumesIssuanceAfterOver170Days
22,951 views
413 Discussing
5
#ADPUSPrivateEmployersAdd86000JobsInOctober
39,056 views
565 Discussing
6
#KazakhstanReportedlyInvests$100MInCryptoFunds
2,361 views
57 Discussing
7
#SouthKoreaSeeksCryptoTaxDelayUntil2029
23,442 views
257 Discussing
8
#USMidterms-WhatAreMarketsExpecting?
635,766 views
2,938 Discussing
9
#US10YearTreasuryYieldFallsTo4.845%
32,136 views
192 Discussing
10
#ZcashExpectsNU7ToMake$16MSproutZECInaccessible
1,777 views
24 Discussing