
#spcxb
spcxb
434,809 views
3,948 Discussing
Hot
Latest

·
--
$SOXSB +1.76% | $SPCXB +1.65% | $JUP +1.41%
#SOXSB is trading at $53.73, up +1.76% with $2.0 M of volume.
#SPCXB holds $138.27, up +1.65% on a solid $13.6 M flow, suggesting stronger market interest.
#JUP sits at $0.2653, up +1.41% with $5.5 M traded; the modest rise may be tempered by its lower liquidity.
👀 SPCXB’s comparatively high volume could act as a catalyst if the upward trend persists.
#Write2Earn #Binance
$SOXSB +1.76% | $SPCXB +1.65% | $JUP +1.41%
#SOXSB is trading at $53.73, up +1.76% with $2.0 M of volume.
#SPCXB holds $138.27, up +1.65% on a solid $13.6 M flow, suggesting stronger market interest.
#JUP sits at $0.2653, up +1.41% with $5.5 M traded; the modest rise may be tempered by its lower liquidity.
👀 SPCXB’s comparatively high volume could act as a catalyst if the upward trend persists.
#Write2Earn #Binance
#SOXSB is trading at $53.73, up +1.76% with $2.0 M of volume.
#SPCXB holds $138.27, up +1.65% on a solid $13.6 M flow, suggesting stronger market interest.
#JUP sits at $0.2653, up +1.41% with $5.5 M traded; the modest rise may be tempered by its lower liquidity.
👀 SPCXB’s comparatively high volume could act as a catalyst if the upward trend persists.
#Write2Earn #Binance

·
--
SPCXB is testing the upper limits of its recent trading range.
$SPCXB currently trades at $138.01, showing a modest 1.48% daily gain. With volume remaining at 0.72x the recent average, the move lacks aggressive conviction.
A clear bullish confirmation requires a sustained breakout above the $138 high. Conversely, a fall back toward the $133.39 range low would invalidate current momentum, signaling potential exhaustion.
Do you see the current volume as a healthy consolidation before a breakout, or a sign that the rally lacks the fuel to sustain new highs?
Tap $SPCXB for the live chart. #SPCXB #BinanceSquare
SPCXB is testing the upper limits of its recent trading range.
$SPCXB currently trades at $138.01, showing a modest 1.48% daily gain. With volume remaining at 0.72x the recent average, the move lacks aggressive conviction.
A clear bullish confirmation requires a sustained breakout above the $138 high. Conversely, a fall back toward the $133.39 range low would invalidate current momentum, signaling potential exhaustion.
Do you see the current volume as a healthy consolidation before a breakout, or a sign that the rally lacks the fuel to sustain new highs?
Tap $SPCXB for the live chart. #SPCXB #BinanceSquare
$SPCXB currently trades at $138.01, showing a modest 1.48% daily gain. With volume remaining at 0.72x the recent average, the move lacks aggressive conviction.
A clear bullish confirmation requires a sustained breakout above the $138 high. Conversely, a fall back toward the $133.39 range low would invalidate current momentum, signaling potential exhaustion.
Do you see the current volume as a healthy consolidation before a breakout, or a sign that the rally lacks the fuel to sustain new highs?
Tap $SPCXB for the live chart. #SPCXB #BinanceSquare

·
--
Bearish
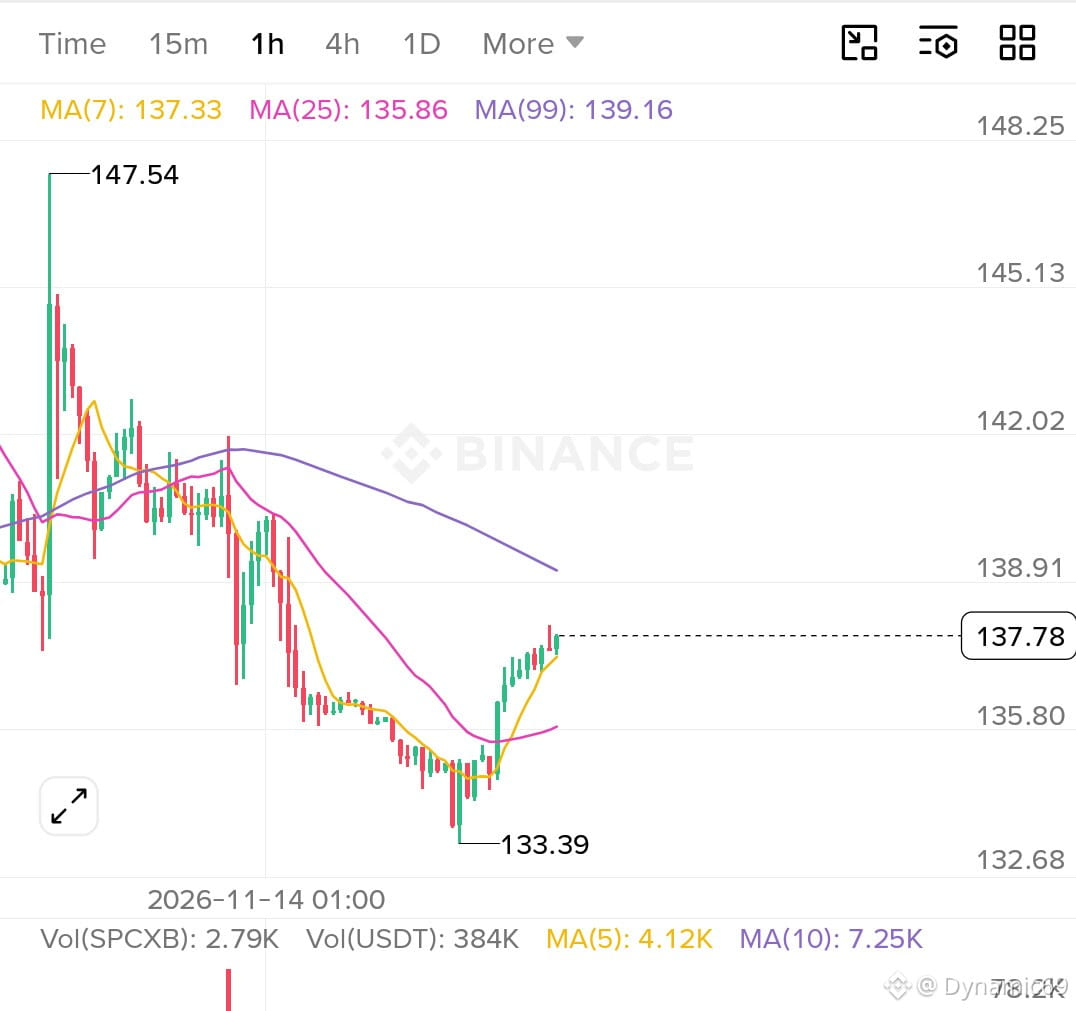
🔻 $SPCXB — More Downside Ahead?
Current Price: Around $137
I'm watching $SPCXB for further downside.
📉 My downside watch: $133
If Selling Pressure Continues, Price Could Retest This level Within the Next 24 hours.
Will $SPCXB drop to $133?
What's your prediction? 👇
#spcxb #short #cryptotrading
🔻 $SPCXB — More Downside Ahead?
Current Price: Around $137
I'm watching $SPCXB for further downside.
📉 My downside watch: $133
If Selling Pressure Continues, Price Could Retest This level Within the Next 24 hours.
Will $SPCXB drop to $133?
What's your prediction? 👇
#spcxb #short #cryptotrading
Current Price: Around $137
I'm watching $SPCXB for further downside.
📉 My downside watch: $133
If Selling Pressure Continues, Price Could Retest This level Within the Next 24 hours.
Will $SPCXB drop to $133?
What's your prediction? 👇
#spcxb #short #cryptotrading
21

·
--
$SPCXB volume surged to 4.99x the hourly average, signaling increased market interest.
Trading at $137, the asset is testing the upper bound of its recent range near $137.32. A clean breakout above this level may suggest momentum, while failing to hold the $133.39 floor could indicate a return to consolidation.
Current volume spikes often attract high-frequency activity, increasing the risk of sharp reversals for late entrants.
Do you view the $137.32 reclaim as a sign of sustained strength, or is the $133.39 support level the more critical pivot to watch?
Tap $SPCXB for the live chart. #SPCXB #BinanceSquare
$SPCXB volume surged to 4.99x the hourly average, signaling increased market interest.
Trading at $137, the asset is testing the upper bound of its recent range near $137.32. A clean breakout above this level may suggest momentum, while failing to hold the $133.39 floor could indicate a return to consolidation.
Current volume spikes often attract high-frequency activity, increasing the risk of sharp reversals for late entrants.
Do you view the $137.32 reclaim as a sign of sustained strength, or is the $133.39 support level the more critical pivot to watch?
Tap $SPCXB for the live chart. #SPCXB #BinanceSquare
Trading at $137, the asset is testing the upper bound of its recent range near $137.32. A clean breakout above this level may suggest momentum, while failing to hold the $133.39 floor could indicate a return to consolidation.
Current volume spikes often attract high-frequency activity, increasing the risk of sharp reversals for late entrants.
Do you view the $137.32 reclaim as a sign of sustained strength, or is the $133.39 support level the more critical pivot to watch?
Tap $SPCXB for the live chart. #SPCXB #BinanceSquare
4


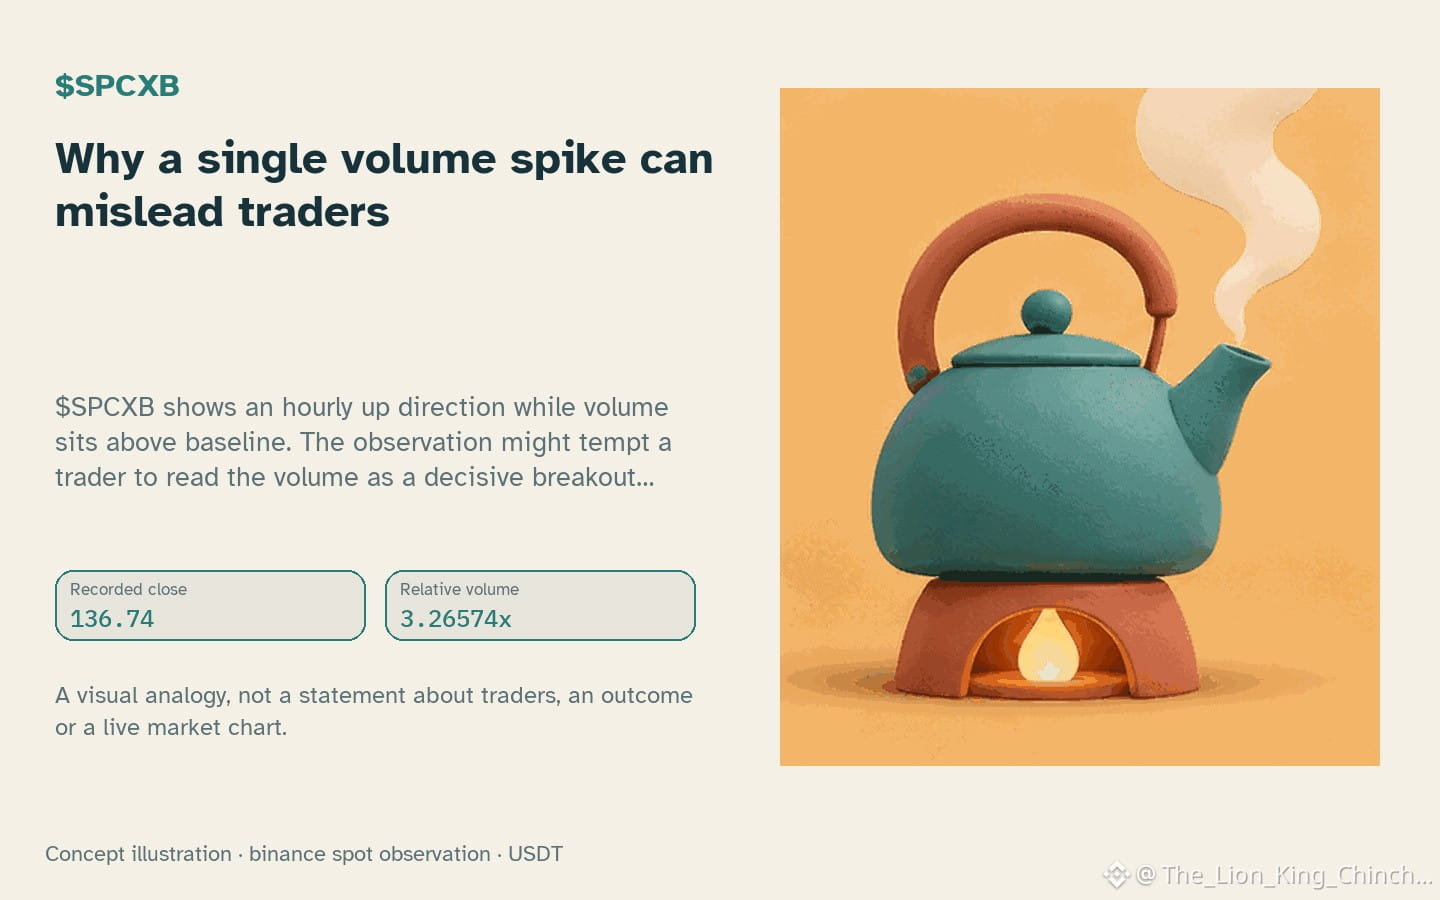
$SPCXB: Why a single volume spike can mislead traders
$SPCXB shows an hourly up direction while volume sits above baseline. The observation might tempt a trader to read the volume as a decisive breakout signal. Yet volume alone is a measure of how many contracts changed hands, not a guarantee of future price direction.
Imagine a busy street where a sudden crowd gathers. The sheer number of people passing the square suggests activity, but it does not reveal whether they are heading north or south. Similarly, a volume spike indicates that buyers and sellers are active, but without knowing the balance of orders it cannot confirm momentum.
In crypto, a spike can occur when a large limit order is placed and quickly filled, or when a few market orders push the price momentarily. If the spike is caused by a single large player, the price may stall once the order is satisfied, leaving the market unchanged. A counterexample: a sustained increase in volume over several hours, coupled with a rising price, would strengthen the case for genuine upward momentum.
The key limitation is that volume does not distinguish between buying and selling pressure. Future closed‑candle evidence. such as a consistent rise in price alongside sustained volume. could support a breakout claim. Without it, a single volume spike remains an ambiguous signal and should not dictate trade decisions.
Probabilistic market research, not a recommendation or guaranteed return.
For a wider view: $ETH has hourly direction up and volume not above its baseline; $SOPH has hourly direction down and volume not above its baseline. This alone does not establish correlation.
The label or the mechanism behind it?
#SPCXB #ETH #SOPH #CryptoEducation
$SPCXB : Why a single volume spike can mislead traders
$SPCXB shows an hourly up direction while volume sits above baseline. The observation might tempt a trader to read the volume as a decisive breakout signal. Yet volume alone is a measure of how many contracts changed hands, not a guarantee of future price direction.
Imagine a busy street where a sudden crowd gathers. The sheer number of people passing the square suggests activity, but it does not reveal whether they are heading north or south. Similarly, a volume spike indicates that buyers and sellers are active, but without knowing the balance of orders it cannot confirm momentum.
In crypto, a spike can occur when a large limit order is placed and quickly filled, or when a few market orders push the price momentarily. If the spike is caused by a single large player, the price may stall once the order is satisfied, leaving the market unchanged. A counterexample: a sustained increase in volume over several hours, coupled with a rising price, would strengthen the case for genuine upward momentum.
The key limitation is that volume does not distinguish between buying and selling pressure. Future closed‑candle evidence. such as a consistent rise in price alongside sustained volume. could support a breakout claim. Without it, a single volume spike remains an ambiguous signal and should not dictate trade decisions.
Probabilistic market research, not a recommendation or guaranteed return.
For a wider view: $ETH has hourly direction up and volume not above its baseline; $SOPH has hourly direction down and volume not above its baseline. This alone does not establish correlation.
The label or the mechanism behind it?
#SPCXB #ETH #SOPH #CryptoEducation
$SPCXB shows an hourly up direction while volume sits above baseline. The observation might tempt a trader to read the volume as a decisive breakout signal. Yet volume alone is a measure of how many contracts changed hands, not a guarantee of future price direction.
Imagine a busy street where a sudden crowd gathers. The sheer number of people passing the square suggests activity, but it does not reveal whether they are heading north or south. Similarly, a volume spike indicates that buyers and sellers are active, but without knowing the balance of orders it cannot confirm momentum.
In crypto, a spike can occur when a large limit order is placed and quickly filled, or when a few market orders push the price momentarily. If the spike is caused by a single large player, the price may stall once the order is satisfied, leaving the market unchanged. A counterexample: a sustained increase in volume over several hours, coupled with a rising price, would strengthen the case for genuine upward momentum.
The key limitation is that volume does not distinguish between buying and selling pressure. Future closed‑candle evidence. such as a consistent rise in price alongside sustained volume. could support a breakout claim. Without it, a single volume spike remains an ambiguous signal and should not dictate trade decisions.
Probabilistic market research, not a recommendation or guaranteed return.
For a wider view: $ETH has hourly direction up and volume not above its baseline; $SOPH has hourly direction down and volume not above its baseline. This alone does not establish correlation.
The label or the mechanism behind it?
#SPCXB #ETH #SOPH #CryptoEducation
49

·
--
$SPCXB -1.17% | $KITE -1.70% | $GOOGLB -1.81%
#SPCXB sits at $134.80, slipping 1.17% on about $5.2 M of trades. The modest pullback could be a short‑term wobble rather than a sustained trend.
#KITE is priced at $0.1270, down 1.70% with $2.2 M changing hands. Its lower volume hints the move may lack strong conviction.
#GOOGLB trades around $289.30, a 1.81% dip backed by $5.4 M in volume. The relative strength in volume suggests some buyers are still active.
📈 Watch whether the broader market dip nudges these assets toward a quick rebound as liquidity resurfaces.
#Write2Earn #Binance
$SPCXB -1.17% | $KITE -1.70% | $GOOGLB -1.81%
#SPCXB sits at $134.80, slipping 1.17% on about $5.2 M of trades. The modest pullback could be a short‑term wobble rather than a sustained trend.
#KITE is priced at $0.1270, down 1.70% with $2.2 M changing hands. Its lower volume hints the move may lack strong conviction.
#GOOGLB trades around $289.30, a 1.81% dip backed by $5.4 M in volume. The relative strength in volume suggests some buyers are still active.
📈 Watch whether the broader market dip nudges these assets toward a quick rebound as liquidity resurfaces.
#Write2Earn #Binance
#SPCXB sits at $134.80, slipping 1.17% on about $5.2 M of trades. The modest pullback could be a short‑term wobble rather than a sustained trend.
#KITE is priced at $0.1270, down 1.70% with $2.2 M changing hands. Its lower volume hints the move may lack strong conviction.
#GOOGLB trades around $289.30, a 1.81% dip backed by $5.4 M in volume. The relative strength in volume suggests some buyers are still active.
📈 Watch whether the broader market dip nudges these assets toward a quick rebound as liquidity resurfaces.
#Write2Earn #Binance
30
·
--
$SPCXB -1.20% | $GOOGLB -1.53% | $XAUT -1.88%
#SPCXB slipped to $134.74, down 1.20% on $5.1 M of volume. The modest trade flow suggests the dip may be more sentiment‑driven than liquidity‑strained.
#GOOGLB fell to $289.96, losing 1.53% with $5.3 M changing hands. Slightly higher volume than SPCXB hints at a broader sell‑off across the basket.
#XAUT dropped to $3,804.19, down 1.88% on a solid $27.3 M of volume. Heavy trading in the gold‑backed token could point to short‑term repositioning.
📈 Watch the widening gap between XAUT’s volume and the modest flows in the other two; it may foreshadow divergent price paths.
#Write2Earn #Binance
$SPCXB -1.20% | $GOOGLB -1.53% | $XAUT -1.88%
#SPCXB slipped to $134.74, down 1.20% on $5.1 M of volume. The modest trade flow suggests the dip may be more sentiment‑driven than liquidity‑strained.
#GOOGLB fell to $289.96, losing 1.53% with $5.3 M changing hands. Slightly higher volume than SPCXB hints at a broader sell‑off across the basket.
#XAUT dropped to $3,804.19, down 1.88% on a solid $27.3 M of volume. Heavy trading in the gold‑backed token could point to short‑term repositioning.
📈 Watch the widening gap between XAUT’s volume and the modest flows in the other two; it may foreshadow divergent price paths.
#Write2Earn #Binance
#SPCXB slipped to $134.74, down 1.20% on $5.1 M of volume. The modest trade flow suggests the dip may be more sentiment‑driven than liquidity‑strained.
#GOOGLB fell to $289.96, losing 1.53% with $5.3 M changing hands. Slightly higher volume than SPCXB hints at a broader sell‑off across the basket.
#XAUT dropped to $3,804.19, down 1.88% on a solid $27.3 M of volume. Heavy trading in the gold‑backed token could point to short‑term repositioning.
📈 Watch the widening gap between XAUT’s volume and the modest flows in the other two; it may foreshadow divergent price paths.
#Write2Earn #Binance
45

·
--
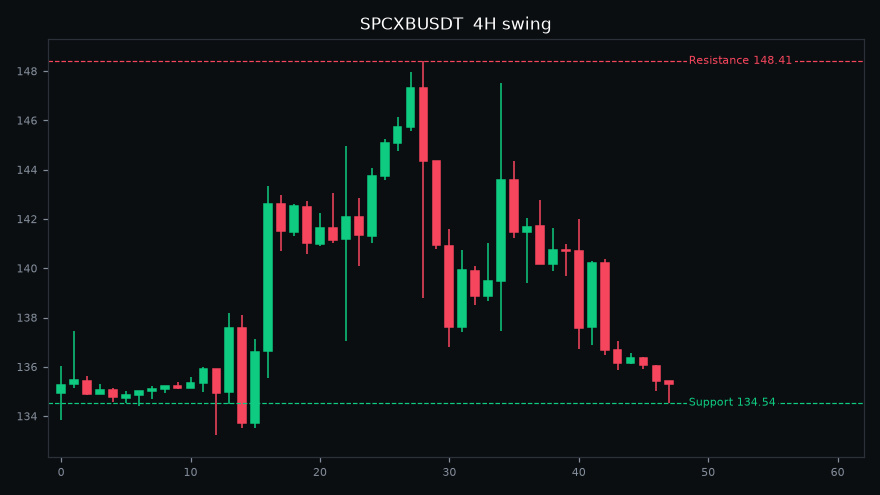
📉 $SPCXB among today's top losers (-2.6%)
Price: 135.26
24h High: 140.36 | 24h Low: 134.54
24h Volume: $27.8M
Support: 134.54 | Resistance: 148.41
RSI 39 (4H swing)
Watch the support level for a bounce or a breakdown.
#SPCXB #CryptoTrading #Binance
⚠️ Not financial advice. Do your own research.
📉 $SPCXB among today's top losers (-2.6%)
Price: 135.26
24h High: 140.36 | 24h Low: 134.54
24h Volume: $27.8M
Support: 134.54 | Resistance: 148.41
RSI 39 (4H swing)
Watch the support level for a bounce or a breakdown.
#SPCXB #CryptoTrading #Binance
⚠️ Not financial advice. Do your own research.
Price: 135.26
24h High: 140.36 | 24h Low: 134.54
24h Volume: $27.8M
Support: 134.54 | Resistance: 148.41
RSI 39 (4H swing)
Watch the support level for a bounce or a breakdown.
#SPCXB #CryptoTrading #Binance
⚠️ Not financial advice. Do your own research.
11
·
--
$SPCXB volume is currently tracking at just 0.27x the hourly average.
With SPCXB trading at $135.34, market participation remains thin. A sustained move back above the $140.36 high could signal a shift in momentum, indicating buyers are re-entering the market. Conversely, failure to hold above the $135.06 range low could confirm a lack of demand, increasing the risk of further downside.
Would you wait for a reclaim of the $140.36 level to confirm trend strength, or does the current low volume suggest a deeper breakdown below $135.06 is more likely?
Tap $SPCXB for the live chart. #SPCXB #BinanceSquare
$SPCXB volume is currently tracking at just 0.27x the hourly average.
With SPCXB trading at $135.34, market participation remains thin. A sustained move back above the $140.36 high could signal a shift in momentum, indicating buyers are re-entering the market. Conversely, failure to hold above the $135.06 range low could confirm a lack of demand, increasing the risk of further downside.
Would you wait for a reclaim of the $140.36 level to confirm trend strength, or does the current low volume suggest a deeper breakdown below $135.06 is more likely?
Tap $SPCXB for the live chart. #SPCXB #BinanceSquare
With SPCXB trading at $135.34, market participation remains thin. A sustained move back above the $140.36 high could signal a shift in momentum, indicating buyers are re-entering the market. Conversely, failure to hold above the $135.06 range low could confirm a lack of demand, increasing the risk of further downside.
Would you wait for a reclaim of the $140.36 level to confirm trend strength, or does the current low volume suggest a deeper breakdown below $135.06 is more likely?
Tap $SPCXB for the live chart. #SPCXB #BinanceSquare
3

·
--
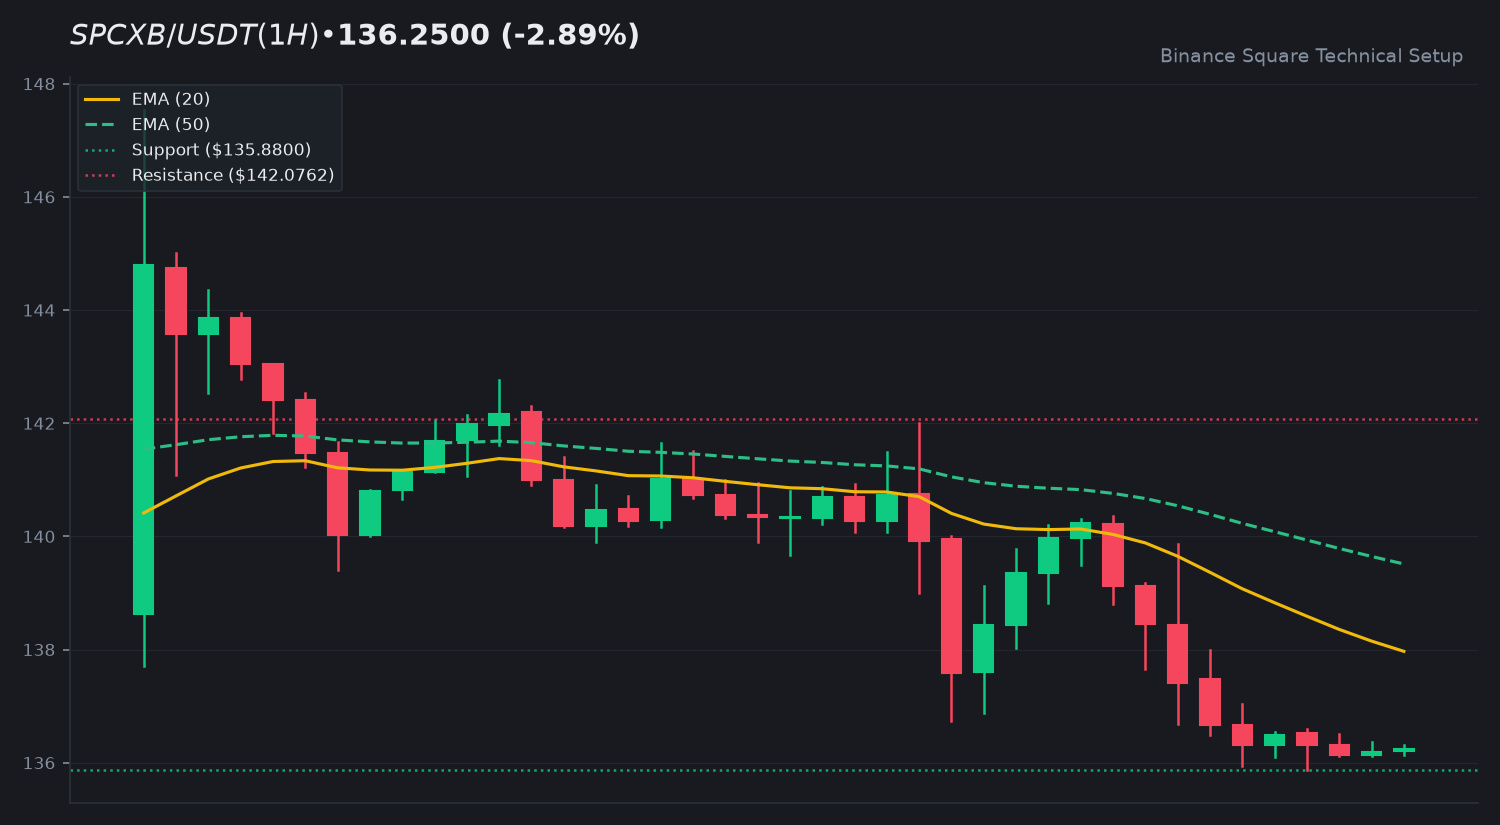
🔥 $SPCXB Technical Update: Key Levels & Momentum Breakdown
📊 1. Market Snapshot
The asset $SPCXB is currently trading at $136.2500, reflecting a 24h change of -2.89%. Market activity remains subdued with a 24h quote volume of 62,983,347 USDT. The current volume-to-SMA ratio of 0.03x indicates low market conviction and a period of consolidation.
📈 2. Technical Momentum & Indicator Bias
Current price action for $SPCXB remains beneath both the EMA 20 (137.9687) and the EMA 50 (139.5124), confirming a prevailing downward trend. The RSI at 34.03 sits in neutral territory, nearing oversold conditions but lacking clear bullish divergence. The MACD histogram at -0.2119, combined with a negative MACD line and signal, suggests that selling pressure persists, though momentum is currently light.
🎯 3. Key Technical Levels to Watch
• 🟢 Resistance Zone: Initial resistance is established at 142.0762, with a secondary ceiling near 147.9750.
• 🔴 Support Zone: The immediate floor is the 24h low of 135.8800.
• 🛡️ Pivot Confluence: The EMA 20 at 137.9687 serves as the primary pivot for any potential trend reversal.
💡 4. Technical Takeaway & Risk Management
Price action is currently testing local support. Traders typically monitor whether the asset can reclaim the EMA 20 level to shift the short-term bias. Given the low volume, participants often look for a high-volume breakout or a confirmed consolidation pattern before determining the next directional move.
💬 5. Community Discussion
What is your technical outlook for $SPCXB this week? Are you accumulating or waiting for confirmation? Drop your thoughts below! 👇
⚠️ 6. Disclaimer
Educational technical analysis only. Not financial advice (NFA). Crypto markets involve risk. Always DYOR.
$SPCXB #SPCXB #BinanceSquare
🔥 $SPCXB Technical Update: Key Levels & Momentum Breakdown
📊 1. Market Snapshot
The asset $SPCXB is currently trading at $136.2500, reflecting a 24h change of -2.89%. Market activity remains subdued with a 24h quote volume of 62,983,347 USDT. The current volume-to-SMA ratio of 0.03x indicates low market conviction and a period of consolidation.
📈 2. Technical Momentum & Indicator Bias
Current price action for $SPCXB remains beneath both the EMA 20 (137.9687) and the EMA 50 (139.5124), confirming a prevailing downward trend. The RSI at 34.03 sits in neutral territory, nearing oversold conditions but lacking clear bullish divergence. The MACD histogram at -0.2119, combined with a negative MACD line and signal, suggests that selling pressure persists, though momentum is currently light.
🎯 3. Key Technical Levels to Watch
• 🟢 Resistance Zone: Initial resistance is established at 142.0762, with a secondary ceiling near 147.9750.
• 🔴 Support Zone: The immediate floor is the 24h low of 135.8800.
• 🛡️ Pivot Confluence: The EMA 20 at 137.9687 serves as the primary pivot for any potential trend reversal.
💡 4. Technical Takeaway & Risk Management
Price action is currently testing local support. Traders typically monitor whether the asset can reclaim the EMA 20 level to shift the short-term bias. Given the low volume, participants often look for a high-volume breakout or a confirmed consolidation pattern before determining the next directional move.
💬 5. Community Discussion
What is your technical outlook for $SPCXB this week? Are you accumulating or waiting for confirmation? Drop your thoughts below! 👇
⚠️ 6. Disclaimer
Educational technical analysis only. Not financial advice (NFA). Crypto markets involve risk. Always DYOR.
$SPCXB #SPCXB #BinanceSquare
📊 1. Market Snapshot
The asset $SPCXB is currently trading at $136.2500, reflecting a 24h change of -2.89%. Market activity remains subdued with a 24h quote volume of 62,983,347 USDT. The current volume-to-SMA ratio of 0.03x indicates low market conviction and a period of consolidation.
📈 2. Technical Momentum & Indicator Bias
Current price action for $SPCXB remains beneath both the EMA 20 (137.9687) and the EMA 50 (139.5124), confirming a prevailing downward trend. The RSI at 34.03 sits in neutral territory, nearing oversold conditions but lacking clear bullish divergence. The MACD histogram at -0.2119, combined with a negative MACD line and signal, suggests that selling pressure persists, though momentum is currently light.
🎯 3. Key Technical Levels to Watch
• 🟢 Resistance Zone: Initial resistance is established at 142.0762, with a secondary ceiling near 147.9750.
• 🔴 Support Zone: The immediate floor is the 24h low of 135.8800.
• 🛡️ Pivot Confluence: The EMA 20 at 137.9687 serves as the primary pivot for any potential trend reversal.
💡 4. Technical Takeaway & Risk Management
Price action is currently testing local support. Traders typically monitor whether the asset can reclaim the EMA 20 level to shift the short-term bias. Given the low volume, participants often look for a high-volume breakout or a confirmed consolidation pattern before determining the next directional move.
💬 5. Community Discussion
What is your technical outlook for $SPCXB this week? Are you accumulating or waiting for confirmation? Drop your thoughts below! 👇
⚠️ 6. Disclaimer
Educational technical analysis only. Not financial advice (NFA). Crypto markets involve risk. Always DYOR.
$SPCXB #SPCXB #BinanceSquare
39
·
--
$SPCXB -2.96% | $RLUSD +0.00% | $PEPE -6.18%
#SPCXB trades at $136.25, down -2.96% on $67.1 M of volume.
#RLUSD holds steady at $1.00, unchanged on $61.5 M of volume.
#PEPE slides to $0.00000425, down -6.18% with $52.4 M traded.
👀 Watch the divergence between SPCXB’s price drop and its still‑high volume; it may hint at short‑covering pressure.
#Write2Earn #Binance
$SPCXB -2.96% | $RLUSD +0.00% | $PEPE -6.18%
#SPCXB trades at $136.25, down -2.96% on $67.1 M of volume.
#RLUSD holds steady at $1.00, unchanged on $61.5 M of volume.
#PEPE slides to $0.00000425, down -6.18% with $52.4 M traded.
👀 Watch the divergence between SPCXB’s price drop and its still‑high volume; it may hint at short‑covering pressure.
#Write2Earn #Binance
#SPCXB trades at $136.25, down -2.96% on $67.1 M of volume.
#RLUSD holds steady at $1.00, unchanged on $61.5 M of volume.
#PEPE slides to $0.00000425, down -6.18% with $52.4 M traded.
👀 Watch the divergence between SPCXB’s price drop and its still‑high volume; it may hint at short‑covering pressure.
#Write2Earn #Binance
5
·
--
$SPCXB -3.92% | $RLUSD +0.01% | $PEPE -3.51%
#SPCXB sits at $136.43, down ‑3.92% on $72.0 M of volume. The dip comes with a solid flow, suggesting traders are still active despite the slide.
#RLUSD trades flat at $1.00, edging up +0.01% while pulling $64.2 M in volume. The near‑zero move hints at a pause rather than a breakout.
#PEPE is priced at $0.00000440, down ‑3.51% on $55.8 M of volume. The token’s pullback is modest given the still‑healthy turnover.
👀 Watch whether the volume levels hold, as a drop could signal waning interest before any price rebound.
#Write2Earn #Binance
$SPCXB -3.92% | $RLUSD +0.01% | $PEPE -3.51%
#SPCXB sits at $136.43, down ‑3.92% on $72.0 M of volume. The dip comes with a solid flow, suggesting traders are still active despite the slide.
#RLUSD trades flat at $1.00, edging up +0.01% while pulling $64.2 M in volume. The near‑zero move hints at a pause rather than a breakout.
#PEPE is priced at $0.00000440, down ‑3.51% on $55.8 M of volume. The token’s pullback is modest given the still‑healthy turnover.
👀 Watch whether the volume levels hold, as a drop could signal waning interest before any price rebound.
#Write2Earn #Binance
#SPCXB sits at $136.43, down ‑3.92% on $72.0 M of volume. The dip comes with a solid flow, suggesting traders are still active despite the slide.
#RLUSD trades flat at $1.00, edging up +0.01% while pulling $64.2 M in volume. The near‑zero move hints at a pause rather than a breakout.
#PEPE is priced at $0.00000440, down ‑3.51% on $55.8 M of volume. The token’s pullback is modest given the still‑healthy turnover.
👀 Watch whether the volume levels hold, as a drop could signal waning interest before any price rebound.
#Write2Earn #Binance
36
·
--
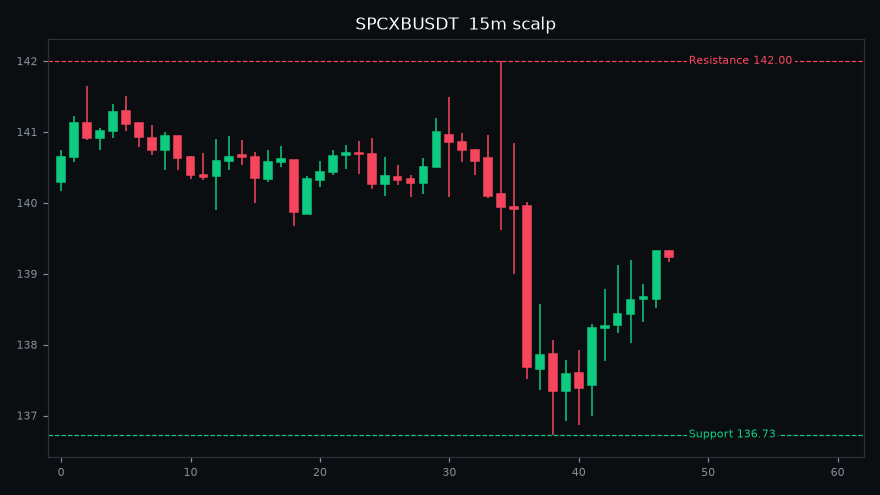
📉 $SPCXB is down -2.9% in 24h
Price: 139.24
24h High: 143.63 | 24h Low: 136.73
24h Volume: $58.4M
Support: 136.73 | Resistance: 142.00
RSI 42 (15m scalp)
Falling fast, wait for confirmation before catching it.
#SPCXB #Trading #CryptoTrading #BinanceSquare
⚠️ Educational only, not financial advice. DYOR.
📉 $SPCXB is down -2.9% in 24h
Price: 139.24
24h High: 143.63 | 24h Low: 136.73
24h Volume: $58.4M
Support: 136.73 | Resistance: 142.00
RSI 42 (15m scalp)
Falling fast, wait for confirmation before catching it.
#SPCXB #Trading #CryptoTrading #BinanceSquare
⚠️ Educational only, not financial advice. DYOR.
Price: 139.24
24h High: 143.63 | 24h Low: 136.73
24h Volume: $58.4M
Support: 136.73 | Resistance: 142.00
RSI 42 (15m scalp)
Falling fast, wait for confirmation before catching it.
#SPCXB #Trading #CryptoTrading #BinanceSquare
⚠️ Educational only, not financial advice. DYOR.
5
·
--
Volume for $SPCXB surged to 5.26x its hourly average, signaling increased participation.
The price now sits at $138.72, down 3.88% over 24 hours. Bullish momentum requires a reclaim of the $145 level to confirm buyers are absorbing current selling pressure. Conversely, failing to hold the $139.40 boundary suggests further downside risk as liquidity thins.
Market participants are now testing the resilience of recent lows. If volume continues to spike, would you view a reclaim of $145 as a valid signal, or does the current hourly decline favor a test of lower support?
Tap $SPCXB for the live chart. #SPCXB #BinanceSquare
Volume for $SPCXB surged to 5.26x its hourly average, signaling increased participation.
The price now sits at $138.72, down 3.88% over 24 hours. Bullish momentum requires a reclaim of the $145 level to confirm buyers are absorbing current selling pressure. Conversely, failing to hold the $139.40 boundary suggests further downside risk as liquidity thins.
Market participants are now testing the resilience of recent lows. If volume continues to spike, would you view a reclaim of $145 as a valid signal, or does the current hourly decline favor a test of lower support?
Tap $SPCXB for the live chart. #SPCXB #BinanceSquare
The price now sits at $138.72, down 3.88% over 24 hours. Bullish momentum requires a reclaim of the $145 level to confirm buyers are absorbing current selling pressure. Conversely, failing to hold the $139.40 boundary suggests further downside risk as liquidity thins.
Market participants are now testing the resilience of recent lows. If volume continues to spike, would you view a reclaim of $145 as a valid signal, or does the current hourly decline favor a test of lower support?
Tap $SPCXB for the live chart. #SPCXB #BinanceSquare
2

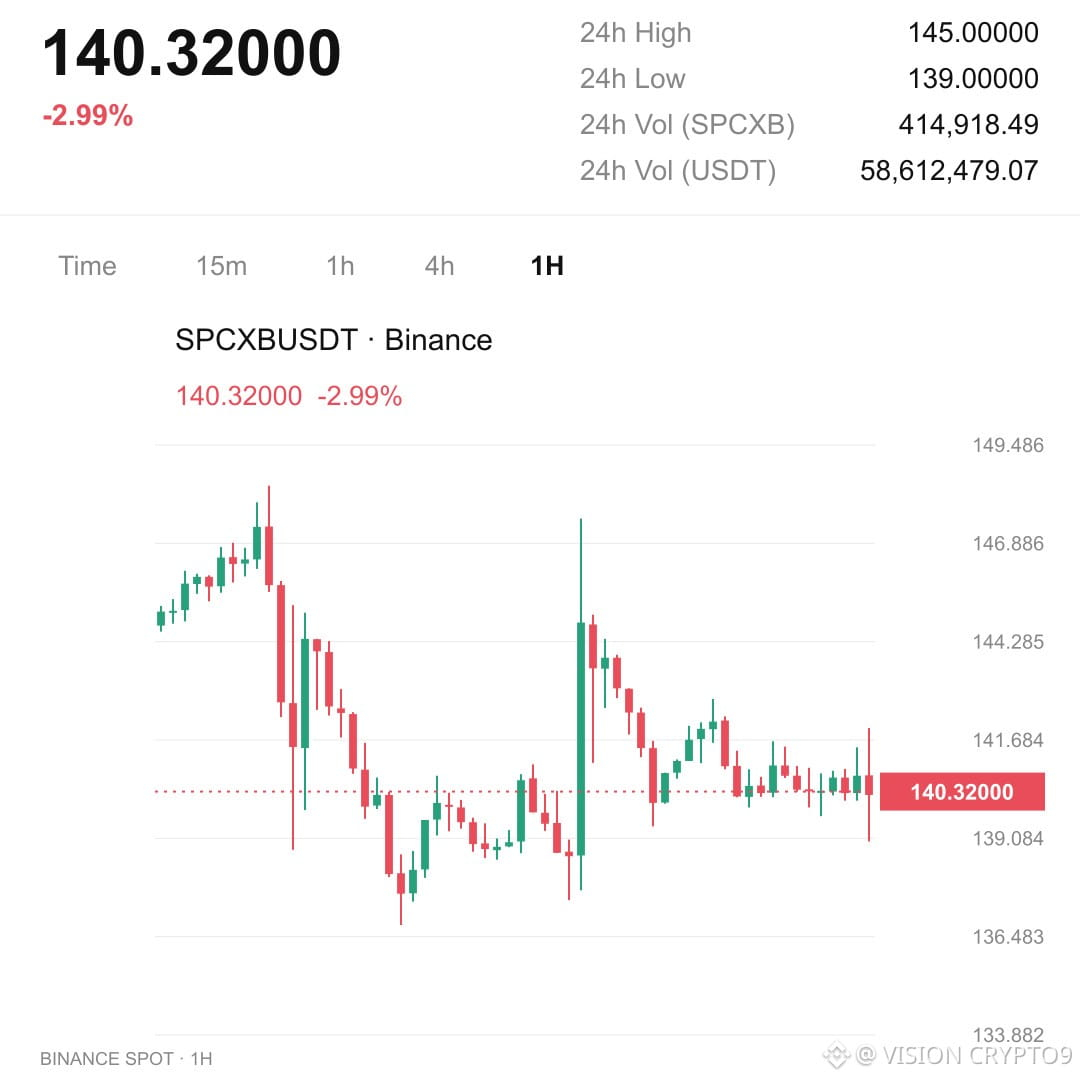
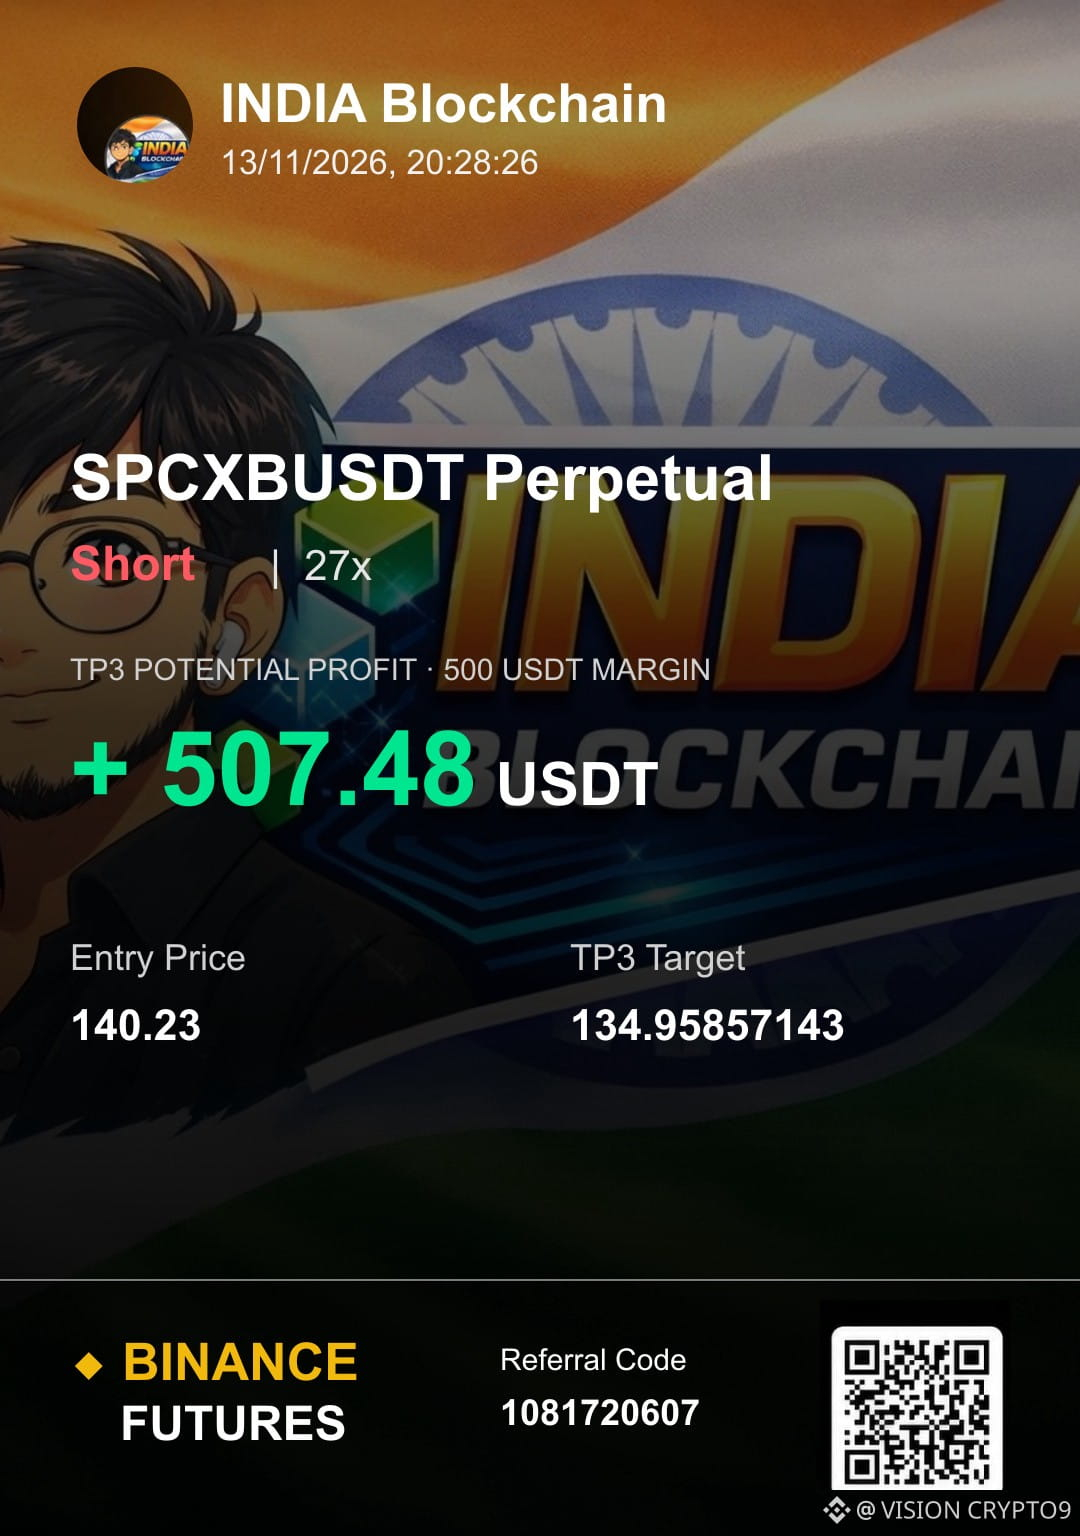

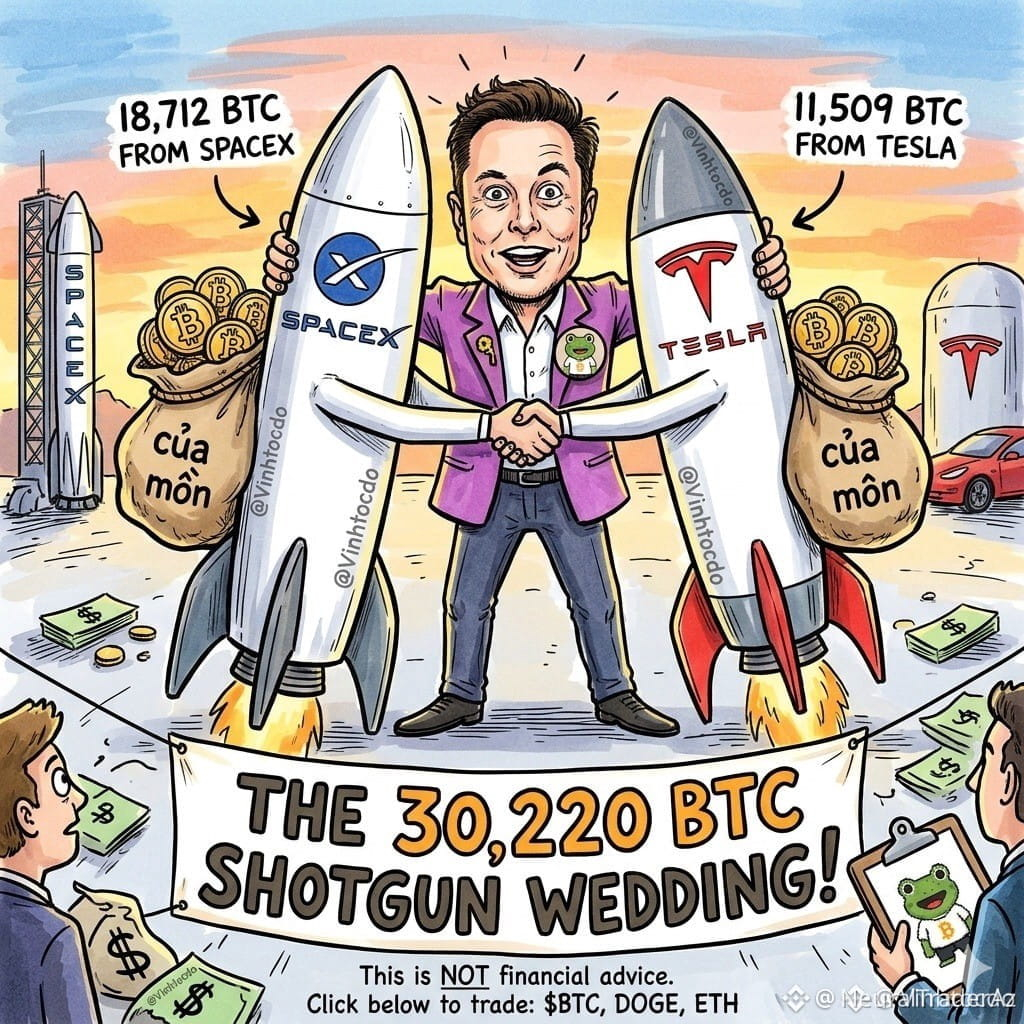
🚨 $SPCXB AND $TSLAB TREASURY MERGER RUMORS: WHY THIS 69K USD LEVEL DEMANDS PATIENCE 📊
Entry: 69,000 ⚡
Institutional treasury rumors pointing to a corporate consolidation between major entities holding over thirty thousand bitcoin units represent a structural non-event for immediate order flow. 💡
While the headline valuation sounds massive, it accounts for a negligible fraction of their overall capitalization and involves dormant wallets simply changing custody rather than generating fresh spot demand. 📉
Smart money ignores news-driven FOMO and focuses strictly on structural reaction zones near 69,000 USD to gauge true market intent. 🔍 Are you positioning for a structural retest or waiting for volume confirmation before entry? 👇
⚠️ Not financial advice. Always manage your risk. 🛡️
🏷️ #SPCXB #TSLAB #CryptoNews #MarketStructure #Bitcoin
🔥 💎
🚨 $SPCXB AND $TSLAB TREASURY MERGER RUMORS: WHY THIS 69K USD LEVEL DEMANDS PATIENCE 📊
Entry: 69,000 ⚡
Institutional treasury rumors pointing to a corporate consolidation between major entities holding over thirty thousand bitcoin units represent a structural non-event for immediate order flow. 💡
While the headline valuation sounds massive, it accounts for a negligible fraction of their overall capitalization and involves dormant wallets simply changing custody rather than generating fresh spot demand. 📉
Smart money ignores news-driven FOMO and focuses strictly on structural reaction zones near 69,000 USD to gauge true market intent. 🔍 Are you positioning for a structural retest or waiting for volume confirmation before entry? 👇
⚠️ Not financial advice. Always manage your risk. 🛡️
🏷️ #SPCXB #TSLAB #CryptoNews #MarketStructure #Bitcoin
🔥 💎
Entry: 69,000 ⚡
Institutional treasury rumors pointing to a corporate consolidation between major entities holding over thirty thousand bitcoin units represent a structural non-event for immediate order flow. 💡
While the headline valuation sounds massive, it accounts for a negligible fraction of their overall capitalization and involves dormant wallets simply changing custody rather than generating fresh spot demand. 📉
Smart money ignores news-driven FOMO and focuses strictly on structural reaction zones near 69,000 USD to gauge true market intent. 🔍 Are you positioning for a structural retest or waiting for volume confirmation before entry? 👇
⚠️ Not financial advice. Always manage your risk. 🛡️
🏷️ #SPCXB #TSLAB #CryptoNews #MarketStructure #Bitcoin
🔥 💎
3

·
--
⚔️ $SPCXB is trapped in a mild tug-of-war.
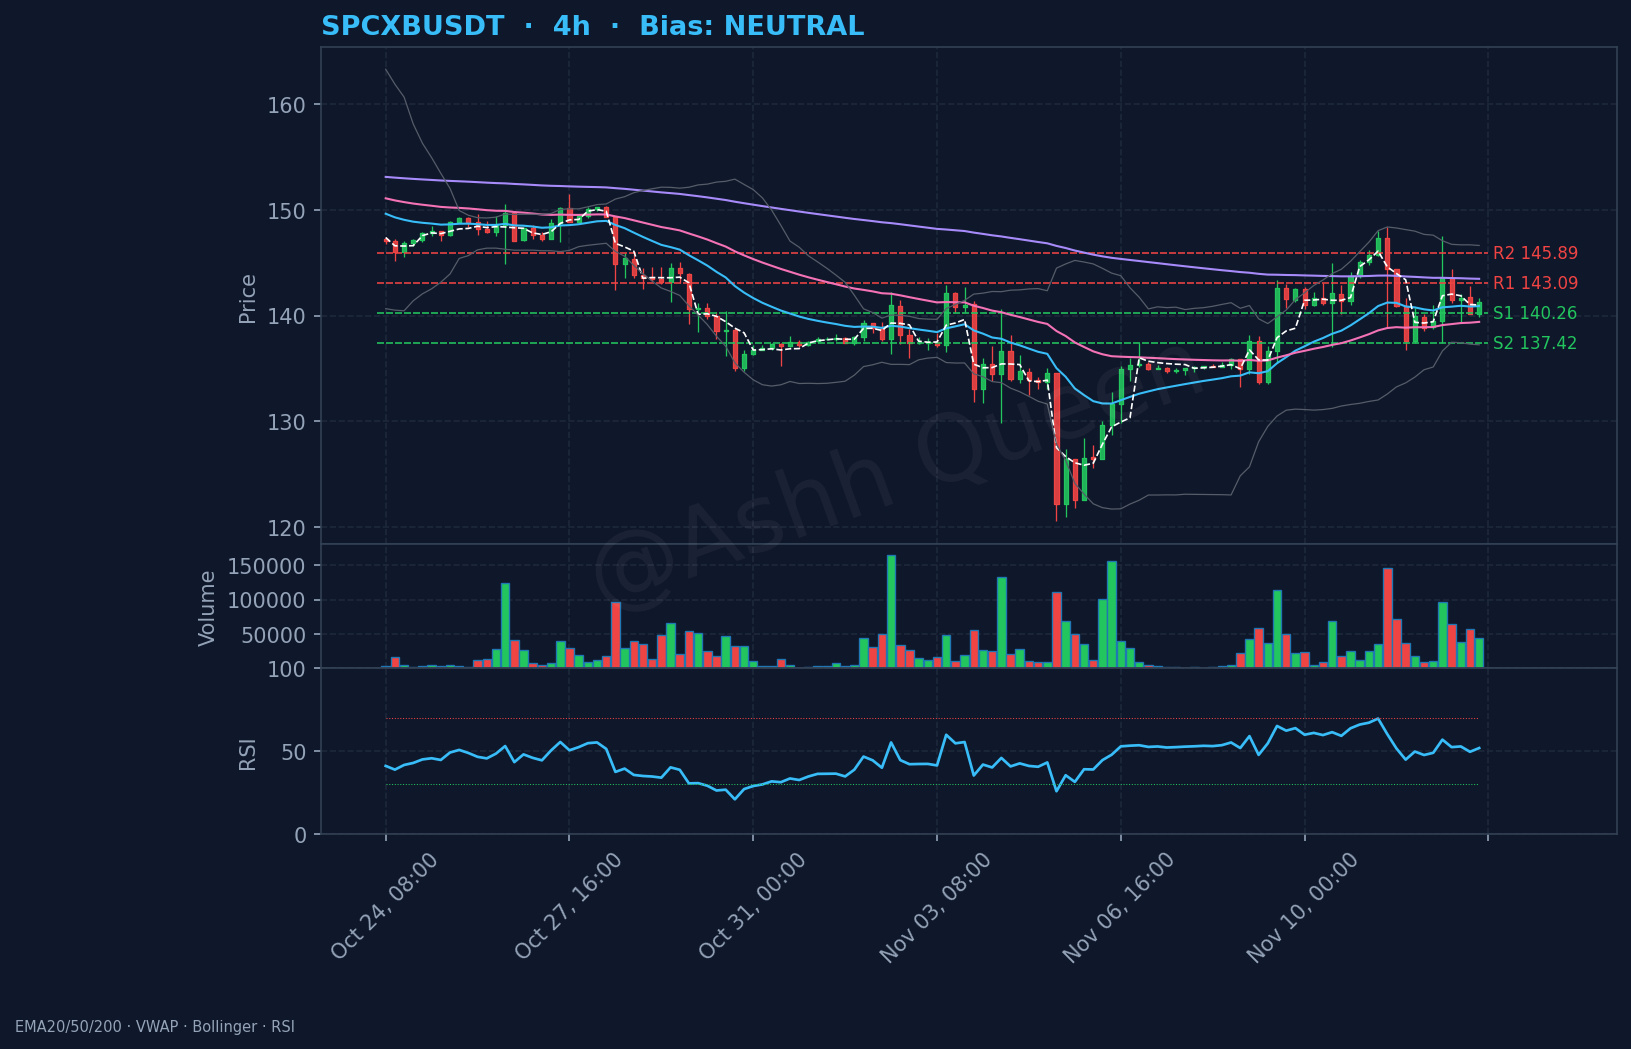
Bulls need a breakout above resistance at 143.09 to gain momentum.
Bears want to see a dip below VWAP at 141.00.
Price at 141.26 remains above EMA50 at 139.40 but below EMA200 at 143.47. With RSI at 51.92, neither side currently has the edge in this 4h range. 📉 📈
Which side do you think blinks first, the bulls or the bears?
#SPCXB #CryptoMarket #Altcoins #Trading
Risk note: leverage magnifies losses. Plan the exit before the entry.
⚔️ $SPCXB is trapped in a mild tug-of-war.
Bulls need a breakout above resistance at 143.09 to gain momentum.
Bears want to see a dip below VWAP at 141.00.
Price at 141.26 remains above EMA50 at 139.40 but below EMA200 at 143.47. With RSI at 51.92, neither side currently has the edge in this 4h range. 📉 📈
Which side do you think blinks first, the bulls or the bears?
#SPCXB #CryptoMarket #Altcoins #Trading
Risk note: leverage magnifies losses. Plan the exit before the entry.
Bulls need a breakout above resistance at 143.09 to gain momentum.
Bears want to see a dip below VWAP at 141.00.
Price at 141.26 remains above EMA50 at 139.40 but below EMA200 at 143.47. With RSI at 51.92, neither side currently has the edge in this 4h range. 📉 📈
Which side do you think blinks first, the bulls or the bears?
#SPCXB #CryptoMarket #Altcoins #Trading
Risk note: leverage magnifies losses. Plan the exit before the entry.
1
88
·
--
$SPCXB +1.15% | $PSG +0.91% | $APE +0.76%
#SPCXB nudged to $140.36, up +1.15% on $43.1 M volume. The hefty turnover suggests some institutional interest behind the move.
#PSG edged higher to $0.3320, gaining +0.91% with $1.2 M changing hands. Momentum is modest but the price is holding steady.
#APE rose to $0.0932, up +0.76% on $2.5 M volume. The token is quietly climbing despite a relatively thin order flow.
⚡️ Keep an eye on SPCXB’s volume gap; if it narrows, the rally could face fresh pressure.
#Write2Earn #Binance
$SPCXB +1.15% | $PSG +0.91% | $APE +0.76%
#SPCXB nudged to $140.36, up +1.15% on $43.1 M volume. The hefty turnover suggests some institutional interest behind the move.
#PSG edged higher to $0.3320, gaining +0.91% with $1.2 M changing hands. Momentum is modest but the price is holding steady.
#APE rose to $0.0932, up +0.76% on $2.5 M volume. The token is quietly climbing despite a relatively thin order flow.
⚡️ Keep an eye on SPCXB’s volume gap; if it narrows, the rally could face fresh pressure.
#Write2Earn #Binance
#SPCXB nudged to $140.36, up +1.15% on $43.1 M volume. The hefty turnover suggests some institutional interest behind the move.
#PSG edged higher to $0.3320, gaining +0.91% with $1.2 M changing hands. Momentum is modest but the price is holding steady.
#APE rose to $0.0932, up +0.76% on $2.5 M volume. The token is quietly climbing despite a relatively thin order flow.
⚡️ Keep an eye on SPCXB’s volume gap; if it narrows, the rally could face fresh pressure.
#Write2Earn #Binance
4

·
--
Article
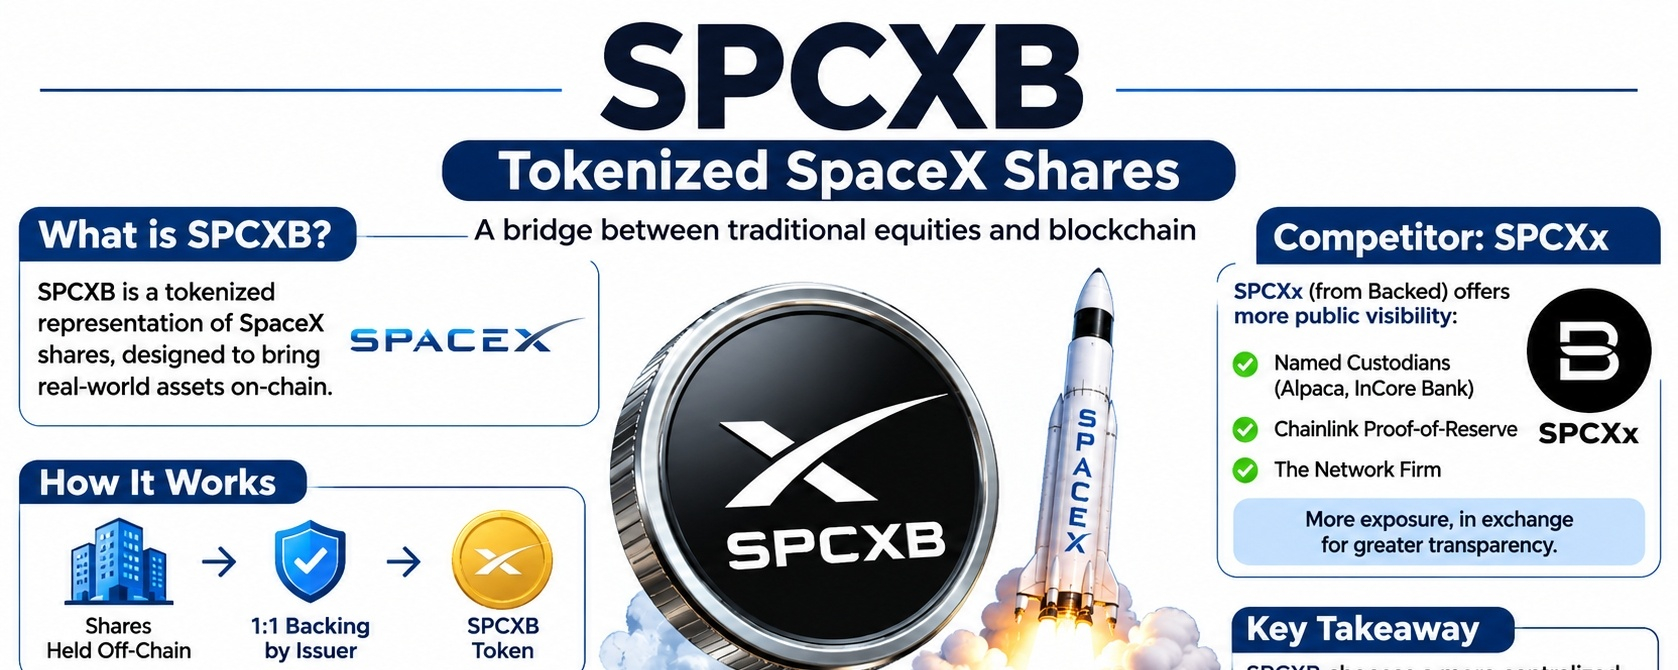
SPCXB is a tokenized representationSPCXB is a tokenized representation of SpaceX shares, not a native cryptocurrency. Its central trust question is whether holders can independently verify the underlying share collateral, rather than simply rely on the issuer's backing claims.
SPCXB uses an issuer-led custody model. BTECH Holdings Limited, a Binance group affiliate, says the tokens are backed 1:1 by underlying shares held in segregated custody. The specific custody arrangement is less publicly detailed than some competing products. That's not an oversight. It's a stated structural choice. bStocks Docs +1
Centralized custody can reduce public exposure of sensitive operational details and simplify administration. But holders surrender some ability to independently scrutinise the full custody chain and the institutions responsible for safeguarding the shares.
Holders can check SPCXB's BNB Chain contract, token supply and publicly verifiable daily proof of collateral. The issuer also operates under an ADGM-approved prospectus framework. However, no named independent reserve-attestation firm or continuous independent reserve audit is clearly identified in the disclosures reviewed. Daily proof is not continuous independent verification. ,binance bstocks +1
Compare SPCXx, the rival SpaceX token from Backed. It identifies custodians including Alpaca Securities, InCore Bank and Maerki Baumann, alongside Chainlink proof-of-reserve infrastructure and The Network Firm. More exposure, in exchange for greater visibility into custody and verification. Backed Assets +1
Neither approach removes counterparty risk. SPCXB relies more heavily on issuer-controlled collateral reporting. SPCXx offers more visible third-party verification, but still depends on custodians and service providers.
Which risk worries you more — less publicly disclosed custody arrangements, or greater dependence on multiple external i
nstitutions?#SPCXB $SPCXB
SPCXB is a tokenized representation
SPCXB is a tokenized representation of SpaceX shares, not a native cryptocurrency. Its central trust question is whether holders can independently verify the underlying share collateral, rather than simply rely on the issuer's backing claims.
SPCXB uses an issuer-led custody model. BTECH Holdings Limited, a Binance group affiliate, says the tokens are backed 1:1 by underlying shares held in segregated custody. The specific custody arrangement is less publicly detailed than some competing products. That's not an oversight. It's a stated structural choice. bStocks Docs +1
Centralized custody can reduce public exposure of sensitive operational details and simplify administration. But holders surrender some ability to independently scrutinise the full custody chain and the institutions responsible for safeguarding the shares.
Holders can check SPCXB's BNB Chain contract, token supply and publicly verifiable daily proof of collateral. The issuer also operates under an ADGM-approved prospectus framework. However, no named independent reserve-attestation firm or continuous independent reserve audit is clearly identified in the disclosures reviewed. Daily proof is not continuous independent verification. ,binance bstocks +1
Compare SPCXx, the rival SpaceX token from Backed. It identifies custodians including Alpaca Securities, InCore Bank and Maerki Baumann, alongside Chainlink proof-of-reserve infrastructure and The Network Firm. More exposure, in exchange for greater visibility into custody and verification. Backed Assets +1
Neither approach removes counterparty risk. SPCXB relies more heavily on issuer-controlled collateral reporting. SPCXx offers more visible third-party verification, but still depends on custodians and service providers.
Which risk worries you more — less publicly disclosed custody arrangements, or greater dependence on multiple external i
nstitutions?#SPCXB $SPCXB
SPCXB uses an issuer-led custody model. BTECH Holdings Limited, a Binance group affiliate, says the tokens are backed 1:1 by underlying shares held in segregated custody. The specific custody arrangement is less publicly detailed than some competing products. That's not an oversight. It's a stated structural choice. bStocks Docs +1
Centralized custody can reduce public exposure of sensitive operational details and simplify administration. But holders surrender some ability to independently scrutinise the full custody chain and the institutions responsible for safeguarding the shares.
Holders can check SPCXB's BNB Chain contract, token supply and publicly verifiable daily proof of collateral. The issuer also operates under an ADGM-approved prospectus framework. However, no named independent reserve-attestation firm or continuous independent reserve audit is clearly identified in the disclosures reviewed. Daily proof is not continuous independent verification. ,binance bstocks +1
Compare SPCXx, the rival SpaceX token from Backed. It identifies custodians including Alpaca Securities, InCore Bank and Maerki Baumann, alongside Chainlink proof-of-reserve infrastructure and The Network Firm. More exposure, in exchange for greater visibility into custody and verification. Backed Assets +1
Neither approach removes counterparty risk. SPCXB relies more heavily on issuer-controlled collateral reporting. SPCXx offers more visible third-party verification, but still depends on custodians and service providers.
Which risk worries you more — less publicly disclosed custody arrangements, or greater dependence on multiple external i
nstitutions?#SPCXB $SPCXB
1
423
·
--
$SPCXB +0.20% | $ATOM +0.07% | $TVK +0.04%
#SPCXB nudges up to $142.68, gaining +0.20% on $33.1 M of volume. The move is modest but the liquidity suggests enough hands are staying active.
#ATOM trades at $1.42, edging +0.07% with $1.5 M changing hands. Its Cosmos network’s multi‑zone design continues to attract steady interest despite the thin margin.
#TVK slips slightly higher to $0.0541, up +0.04% on $1.0 M of volume. The token’s thin upside may be vulnerable if broader market pressure returns.
📊 Watching whether the modest price lifts can hold without a volume surge; a sudden dip in activity could reverse the small gains.
#Write2Earn #Binance
$SPCXB +0.20% | $ATOM +0.07% | $TVK +0.04%
#SPCXB nudges up to $142.68, gaining +0.20% on $33.1 M of volume. The move is modest but the liquidity suggests enough hands are staying active.
#ATOM trades at $1.42, edging +0.07% with $1.5 M changing hands. Its Cosmos network’s multi‑zone design continues to attract steady interest despite the thin margin.
#TVK slips slightly higher to $0.0541, up +0.04% on $1.0 M of volume. The token’s thin upside may be vulnerable if broader market pressure returns.
📊 Watching whether the modest price lifts can hold without a volume surge; a sudden dip in activity could reverse the small gains.
#Write2Earn #Binance
#SPCXB nudges up to $142.68, gaining +0.20% on $33.1 M of volume. The move is modest but the liquidity suggests enough hands are staying active.
#ATOM trades at $1.42, edging +0.07% with $1.5 M changing hands. Its Cosmos network’s multi‑zone design continues to attract steady interest despite the thin margin.
#TVK slips slightly higher to $0.0541, up +0.04% on $1.0 M of volume. The token’s thin upside may be vulnerable if broader market pressure returns.
📊 Watching whether the modest price lifts can hold without a volume surge; a sudden dip in activity could reverse the small gains.
#Write2Earn #Binance
6
Log in to explore more content
Join global crypto users on Binance Square
⚡️ Get latest and useful information about crypto.
💬 Trusted by the world’s largest crypto exchange.
👍 Discover real insights from verified creators.
Email / Phone number
Trending Topics
1
#CryptoSelloffTriggersMultipleWhaleLiquidations
49,100 views
692 Discussing
2
#USSpotXRPETFsSeeLargestWeeklyOutflowIn8Months
77,671 views
917 Discussing
3
#WillFOMCMinutesReinforceRateHikeExpectations?
12,353 views
282 Discussing
4
#BitcoinActiveSupplyInProfitDropsBelow45%
145,330 views
1,279 Discussing
5
#TONStrategyReports$23.97MQ3NetLoss
15,244 views
104 Discussing
6
#KavaSaysAbnormalActivityLimitedToKavaLend
94,640 views
705 Discussing
7
#WORPTLetsTouristsConvertCryptoToThaiBaht
25,413 views
243 Discussing
8
#WhoWillSucceedJensenHuangatNvidia?
270,949 views
1,982 Discussing
9
#WhatWillDriveCryptoandStocks’NextRebound?
746,896 views
3,792 Discussing
10
#TradFiForBeginners
794,446 views
4,774 Discussing