

#pricecorrectionordip
pricecorrectionordip
28,245 views
17 Discussing
Hot
Latest

·
--
Bullish
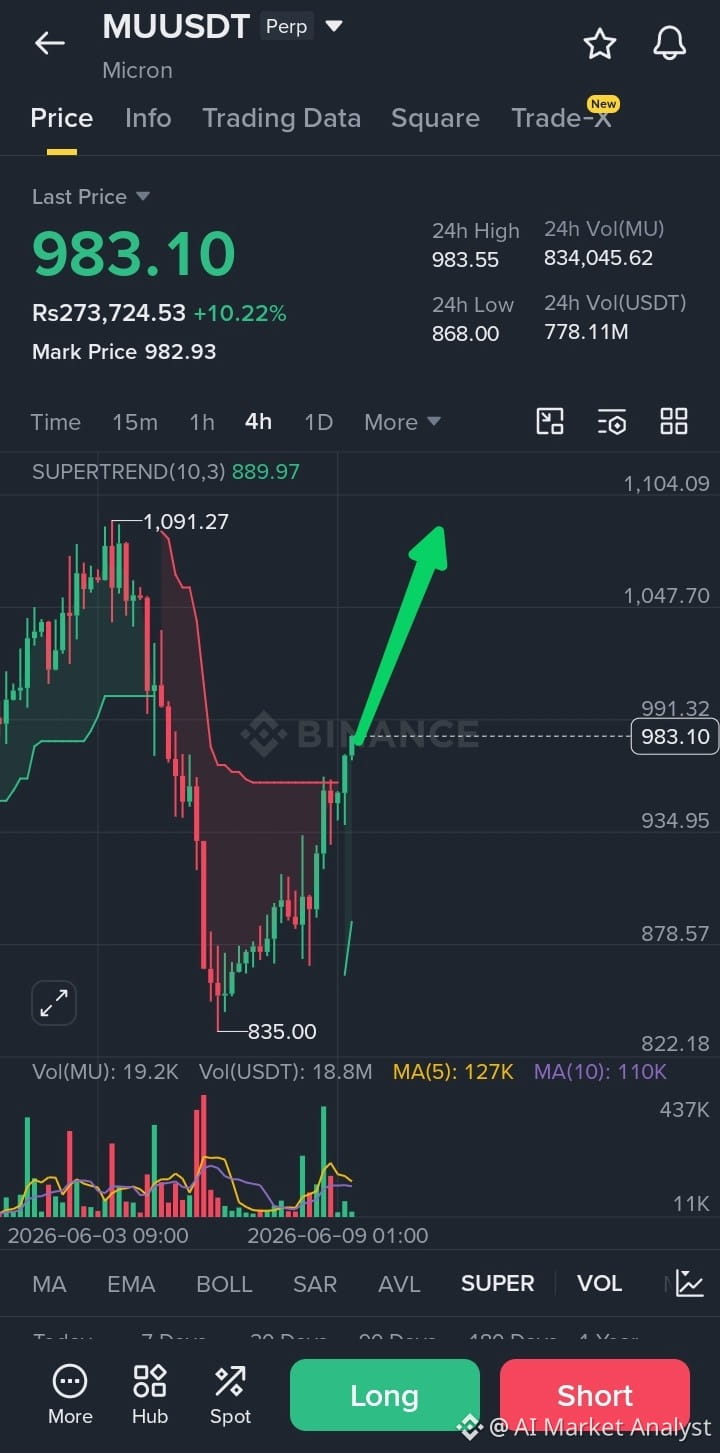
$MU Market Update: Bullish Reversal Confirmed 🚀
Following a healthy correction, MU has successfully retested and held its ground, showing a strong recovery from the $835 support zone.
Market Structure: The bearish structure is fully neutralized. MU is printing higher highs and higher lows, confirming a clear shift back in favor of the bulls.
Outlook: As long as price holds above the key $930–$950 support range, the broader uptrend remains intact with a move toward $1,000+ looking highly likely.
🎯 Trade Setup
Entry Zone: $960 – $975 (On current momentum or minor pullbacks)
Take Profit (TP1): $1,000 (Psychological resistance)
Take Profit (TP2): $1,050+ (Trend extension)
Stop Loss (SL): $920 (Invalidation level below key support)
$MU
{future}(MUUSDT)
$MUon
{alpha}(560x8b6acf6041a81567f012ff6a4c6d96d5818d74bf)
#MUusdt #TrendReversalAlertt #PriceConsolidation #PriceCorrectionorDip #MU_Traders
$MU Market Update: Bullish Reversal Confirmed 🚀
Following a healthy correction, MU has successfully retested and held its ground, showing a strong recovery from the $835 support zone.
Market Structure: The bearish structure is fully neutralized. MU is printing higher highs and higher lows, confirming a clear shift back in favor of the bulls.
Outlook: As long as price holds above the key $930–$950 support range, the broader uptrend remains intact with a move toward $1,000+ looking highly likely.
🎯 Trade Setup
Entry Zone: $960 – $975 (On current momentum or minor pullbacks)
Take Profit (TP1): $1,000 (Psychological resistance)
Take Profit (TP2): $1,050+ (Trend extension)
Stop Loss (SL): $920 (Invalidation level below key support)
$MU
$MUon
#MUusdt #TrendReversalAlertt #PriceConsolidation #PriceCorrectionorDip #MU_Traders
253

·
--

Article
Why CTXC Dip BadlyWhy CTXC Dip Badly
{spot}(CTXCUSDT)
The recent decline in the value of the CTXC coin can be attributed to several interconnected factors. Here’s a detailed analysis:
1. Sharp Price Drop
- Dramatic Decline: $CTXC has experienced a significant drop of 40.27% in just 24 hours, falling from a high of $1.0500 to a low of $0.5518. This sharp decline indicates a loss of investor confidence and market volatility.
- Current Price: As of the latest data, CTXC is trading at $0.3221, reflecting a 15.68% decrease over the past 24 hours.
2. Increased Trading Volume
- Volume Spike: Despite the price drop, there was a 4x increase in trading volume, suggesting that traders are actively buying and selling, possibly in anticipation of a rebound. This could indicate speculative trading rather than long-term investment confidence.
3. Market Sentiment and Technical Indicators
- Bearish Sentiment: The overall market sentiment has been bearish, with many cryptocurrencies experiencing declines. This broader market trend can negatively impact individual coins like CTXC.
- Technical Analysis: The MACD indicator has shown potential bullish signals, but the price has not yet confirmed a reversal, leading to uncertainty among traders.
4. Recent Price Predictions
- Future Projections: Analysts predict that CTXC may continue to decline, with estimates suggesting a further drop to around $0.286778 by the end of December 2024. This forecast can contribute to negative sentiment and selling pressure.
5. Market Dynamics
- Support and Resistance Levels: The price approaching the $0.25 'orderblock' indicates a critical support level. If this level fails to hold, it could lead to further declines, exacerbating the situation.
- Comparison with Historical Data: The price history shows a significant drop from $0.971 on December 15 to the current levels, highlighting a rapid loss of value over a short period.
Conclusion
The decline in CTXC's value is a result of a combination of sharp price drops, increased trading activity, bearish market sentiment, and negative future projections. Traders should remain cautious and monitor market conditions closely, as the situation can evolve rapidly in the cryptocurrency space.
Key Takeaways
- Price Volatility: CTXC has seen extreme volatility, with significant price fluctuations in a short time frame.
- Market Sentiment: The overall bearish sentiment in the crypto market is affecting CTXC's performance.
- Technical Indicators: Mixed signals from technical analysis suggest uncertainty in the market.
By understanding these factors, traders can make more informed decisions regarding their investments in CTXC. 📉💡
#PriceCorrectionorDip
#CryptoMarketMoves
#BinanceSquareFamily
Why CTXC Dip Badly
Why CTXC Dip Badly
The recent decline in the value of the CTXC coin can be attributed to several interconnected factors. Here’s a detailed analysis:
1. Sharp Price Drop
- Dramatic Decline: $CTXC has experienced a significant drop of 40.27% in just 24 hours, falling from a high of $1.0500 to a low of $0.5518. This sharp decline indicates a loss of investor confidence and market volatility.
- Current Price: As of the latest data, CTXC is trading at $0.3221, reflecting a 15.68% decrease over the past 24 hours.
2. Increased Trading Volume
- Volume Spike: Despite the price drop, there was a 4x increase in trading volume, suggesting that traders are actively buying and selling, possibly in anticipation of a rebound. This could indicate speculative trading rather than long-term investment confidence.
3. Market Sentiment and Technical Indicators
- Bearish Sentiment: The overall market sentiment has been bearish, with many cryptocurrencies experiencing declines. This broader market trend can negatively impact individual coins like CTXC.
- Technical Analysis: The MACD indicator has shown potential bullish signals, but the price has not yet confirmed a reversal, leading to uncertainty among traders.
4. Recent Price Predictions
- Future Projections: Analysts predict that CTXC may continue to decline, with estimates suggesting a further drop to around $0.286778 by the end of December 2024. This forecast can contribute to negative sentiment and selling pressure.
5. Market Dynamics
- Support and Resistance Levels: The price approaching the $0.25 'orderblock' indicates a critical support level. If this level fails to hold, it could lead to further declines, exacerbating the situation.
- Comparison with Historical Data: The price history shows a significant drop from $0.971 on December 15 to the current levels, highlighting a rapid loss of value over a short period.
Conclusion
The decline in CTXC's value is a result of a combination of sharp price drops, increased trading activity, bearish market sentiment, and negative future projections. Traders should remain cautious and monitor market conditions closely, as the situation can evolve rapidly in the cryptocurrency space.
Key Takeaways
- Price Volatility: CTXC has seen extreme volatility, with significant price fluctuations in a short time frame.
- Market Sentiment: The overall bearish sentiment in the crypto market is affecting CTXC's performance.
- Technical Indicators: Mixed signals from technical analysis suggest uncertainty in the market.
By understanding these factors, traders can make more informed decisions regarding their investments in CTXC. 📉💡
#PriceCorrectionorDip
#CryptoMarketMoves
#BinanceSquareFamily
18
13
25
39.5k
Log in to explore more content
Join global crypto users on Binance Square
⚡️ Get latest and useful information about crypto.
💬 Trusted by the world’s largest crypto exchange.
👍 Discover real insights from verified creators.
Email / Phone number
Trending Topics
1
#FedWatch
16.1M views
37,654 Discussing
2
#Nasdaq100FuturesFall0.9%
58 views
20 Discussing
3
#BitcoinCore32.1RaisesPeerConnectionLimit
12,252 views
366 Discussing
4
#VisaStablecoinSettlementTops$25BAnnualized
129 views
7 Discussing
5
#WestpacToCapCryptoPaymentsAtAUD10KPerMonth
3,630 views
108 Discussing
6
#RussiaPlansStandardizedTestForCryptoInvestors
4,939 views
139 Discussing
7
#EarningsSeason
6.2M views
30,648 Discussing
8
#BitcoinCoreIdentifiesThreeVulnerabilities
20,988 views
395 Discussing
9
#CanGoogleDefindItsCore
429,820 views
3,172 Discussing
10
#CanMicrosoftDeliverOnAI
684,853 views
4,465 Discussing