LUNCDream
942,931 views
106 Posts
Hot
Latest
EOS Sees Slight 1.31% Price Uptick to $0.7721: Key Insights for July 24, 2023
EOS has recorded a minor 1.31% price gain over the past 24 hours, rising from $0.7618 up to $0.7721. This ends a 3-day losing streak for EOS, although prices still remain stuck in a longer-term downtrend. In our analysis, we'll examine the key factors behind this small rebound and what it means looking ahead.
Short-Term Overselling Prompts Bounce
The main driver of this slight 1% uptick appears to be short-term oversold conditions. EOS prices have dropped 3.52% over the past week amidst broader altcoin weakness. Selling pressure prompted the RSI indicator on the 4-hour chart into oversold territory below 30.
This seems to have sparked a relief bounce today as bargain hunters stepped in. However, trading volumes remain relatively muted at $136 million, suggesting buying conviction still lacks. A minor 0.51% pullback in just the past hour also indicates continued choppiness.
Longer-Term Technicals Remain Weak
Stepping back, EOS is still firmly stuck within the bearish trend that has defined its price action since May 2021. Key resistance levels around $0.80 and $1.00 have continued thwarting upside attempts.
Network adoption metrics also show declining activity and developer participation, raising questions about EOS's long-term blockchain prospects compared to competitors.
While the bull case revolves around EOS transitioning to a more decentralized governance model, execution risks remain. The technical picture looks weak without a clear catalyst emerging.
Price Prediction and Outlook
My technical prediction is that EOS will likely trade rangebound between $0.70 and $0.80 over the coming weeks barring any major news events. Near-term upside looks limited by the falling 200-day moving average around $0.85.
I expect EOS will struggle to break out sustainably without indications of revived developer and user activity. Possible downside toward the $0.50 support zone seems more likely in the interim.
For conservative investors, sitting on the sidelines seems prudent until EOS shows signs of a broader turnaround. Aggressive traders may look to play the likely rangebound action via short-term swing trades.
What Factors Led to Declining EOS Adoption Over Recent Years?
EOS adoption and development activity has slowed considerably from its early highs in 2018 and 2019. Here are some of the key factors that contributed to this declining adoption:
-Governance centralization concerns - Block producers became more consolidated and centralized after launch.
-Competition from other chains like Solana offering higher speeds.
-Lack of clarity around long-term token economics and incentives.
-Failure to deliver promised features like inter-blockchain communication.
-Loss of EOS community support as enthusiasm waned post-launch.
-More developers gravitating to Ethereum as it solved congestion issues.
While marketed as an "Ethereum killer”, EOS ultimately failed to differentiate itself enough technically or offer compelling developer incentives long-term. Unless it can reinvent itself, declining adoption trends may persist.
Is EOS a Good Buy After the Recent Uptick to $0.7721?
EOS has bounced 1.3% off its recent lows, which may prompt some investors to consider opening positions after the pullback. However, the overall long-term investment case still appears weak.
On the positive side, the bounce has put EOS back above its 20-day moving average and February 2022 support around $0.75. Short-term oversold readings also suggest near-term downside could be limited.
However, EOS remains deep in a long-term technical downtrend without clear signs of a meaningful reversal. Developer engagement is still deteriorating and use cases are lacking.
Until EOS can orchestrate a clear turnaround fundamentally, significant upside seems unlikely. Those seeking short-term trades could look for rangebound swings, but long-term investment merits caution until adoption trends reverse.$EOS #LUNCDream #CryptoWorldbyINQ2

Bitcoin Address Activity Signals Short-Term Price Jump
In August 2023, Bitcoin address activity has reached a peak not seen in 3.5 months. The surge in activity suggests that the BTC price is gearing up for the next bull run, and this comes amidst a period of low volatility.
As August begins, the Bitcoin address activity has shown a remarkable increase. Despite the BTC price consolidating around $29,000, this surge in address activity suggests a potential bounce back in the short term.
In August, the utilization of Bitcoin addresses reached its highest point in 3.5 months. Alongside this rise in activity, there have been significant loss transactions and negative sentiment. These factors combined indicate a high probability of a short-term price bounce for BTC, as explained by Santiment.
Bitcoin Price Consolidates Around $29,000 Amid Low Volatility
Bitcoin, the world’s largest cryptocurrency, has experienced some price fluctuations this week. However, it is once again consolidating around the $29,000 mark. Interestingly, the Bitcoin price volatility has reached its lowest levels since June 2020, indicating the potential formation of a base for the next parabolic bull run, following historical trends.
According to Mike McGlone, Bloomberg’s senior commodity strategist, the 180-day volatility, currently at approximately 46% at the start of August, is historically a bullish sign for prices. However, he raises concerns about the recent Bitcoin priceweakness compared to equities since the end of the first quarter, which could imply pressure on all risk assets.
Despite the price swings and low volatility, long-term Bitcoin holders are holding strong with “diamond hands.” An impressive 55% of the total supply has remained untouched over the past two years, showcasing their conviction and confidence in the cryptocurrency.
Bitcoin whales, referring to millionaire and billionaire addresses, have been consistently accumulating the cryptocurrency since May 2023. Together, these whales own a massive 11.5 million BTC, accounting for more than half of the total supply (59.2%). In just the past 12 weeks, their combined share has increased by 27,755 BTC, as reported by Santiment.
Bitcoin Price Movement on the Technical Chart
The technical analysis for Bitcoin appears to be bullish currently. CrediBULL Crypto believes that the most significant price movements for cryptocurrencies are yet to happen. Despite a month of sideways movement in BTC and market dominance, the cryptocurrency has established a higher low. The H12 bullish divergence has been confirmed, and the Relative Strength Index (RSI) on higher timeframes looks reset. Staying above the critical “magic” 40 RSI level, there are expectations for the next upward move.
#CryptoWorldbyINQ2 #LUNCDream $BTC

Dogecoin Jumps 5.53% to $0.07932: Key Analysis for July 26, 2023
Dogecoin is seeing impressive gains today, with the price up 5.53% over the past 24 hours to $0.07932. The meme-inspired cryptocurrency now has a market cap of $10.77 billion.
Trading volume for DOGE stands high at $1.61 billion in the past day. This shows strong interest in the coin. Over the last hour alone, the price has surged 1.79%, continuing its upwards momentum.
Before we dive in, I want to highlight our data provider CoinStats. They've announced that today you can register with a 10% discount for premium and track ALL your coins from one dashboard.
Is This a Sustained Recovery for Dogecoin?
Dogecoin's over 5% daily increase provides hope that this could be the start of a sustained recovery. The price is extending its rebound from the June lows and has now gained 15.74% in the last week.
The positive momentum aligns with Dogecoin's 16.55% monthly gain. However, the 6-month performance remains down 8.32%, indicating the longer-term outlook is still uncertain.
To confirm an uptrend, DOGE needs to break above resistance around $0.08. This area provided support earlier in the year and could now flip to become resistance. Clearing this hurdle would open the door for further upside towards $0.10.
What is Driving Dogecoin's Comeback Rally?
A few factors are contributing to Dogecoin's strong rebound. Firstly, the coin often benefits from ELon Musk's occasional tweets referencing it. Any high-profile endorsement can quickly send DOGE surging.
Additionally, Dogecoin tends to rally in sympathy with larger cryptos like Bitcoin. With Bitcoin recovering in recent weeks, altcoins like DOGE are also seeing speculative inflows.
However, Dogecoin remains a highly volatile asset. Traders should exercise caution, as steep pullbacks are common after massive runs. Still, further adoption from merchants could make this recovery more sustainable over the long run.
$DOGE #LUNCDream #CryptoWorldbyINQ2

Litecoin Jumps 6.14% to $94.99: Key Takeaways for Traders
Litecoin has seen a strong 6.14% price surge over the past 24 hours, lifting the token to $94.99 based on the data provided. This bounce comes after a period of rangebound trading for LTC, with the price up just 0.29% over the past week. Zooming out further shows the broader technical picture remains constructive for Litecoin, with gains of 7.29% and 6.86% over the past month and 6 months respectively.
Today's 6.14% single-day increase indicates bullish momentum is accelerating for LTC again following its recent consolidation. Litecoin maintains its position as the 8th largest cryptocurrency, with a market capitalization now standing at $6.72 billion. Trading activity is robust, with 24-hour volume of $485.21 million highlighting significant interest in the token.
Analyzing the percentages shows Litecoin staged a bullish breakout from its trading range today, positioned for further upside after gathering strength. The quick swing from sideways to positive momentum reflects the speed cryptocurrencies can see changing conditions.
For traders, some key insights on Litecoin's price action include:
Breakout above $94 signals the end of the recent rangebound period
Buying pressure spiked today, driving the 6%+ price surge
Longer term uptrend remains intact, with continued higher lows and highs
Consolidation periods help establish foundations for the next leg higher
LTC remains vulnerable to volatility amid speculative crypto trading
Moving forward, the focus will be on Litecoin holding above the $94 breakout level and extending gains in the short term. LTC appears poised to challenge resistance around the $100 level if bulls can maintain control.#LUNCDream #CryptoWorldbyINQ2 $LTC

Terra Classic (LUNC) and L1 Task Force Developers Resign Due to Private Info Doxxing
Terra Classic (LUNC) developers and L1JTF team members LuncBurnArmy and Fragwuerdig have resigned after having their private info doxxed.
In a shocking turn of events, two prominent LUNC L1 Task Force members, LuncBurnArmy (LBA) and Fragwuerdig, have resigned from Terra Classic (LUNC) due to a disturbing breach of their privacy.
The developers made the difficult decision to step down immediately after their sensitive personal information was released to the public without their consent.
LBA and Fragwuerdig emphasized that this decision was not taken lightly, underlining the importance of personal security.
Following their resignation, the surplus funding allocated for the second quarter will be returned to the community pool, as the team completed the quarter under budget. Additionally, the funding initially designated for LBA and Fragwuerdig for the third quarter will be redirected back to the community pool
Vinh, in particular, will serve as the primary point of contact for the L1 Task Force team. LBA, who formerly served as the L1 Team’s project manager, encouraged community members to direct any questions $LUNC #LUNCDream
ETH price prediction… will it reach $3000
Ethereum Price Prediction 2023-2032
Ethereum Price Prediction 2023 – up to $2,365
Ethereum Price Prediction 2026 – up to $7,465
Ethereum Price Prediction 2029 – up $to $22,410
Ethereum Price Prediction 2032 – up to $64,578
$ETH
#LUNCDream #CryptoWorldbyINQ2
Ethereum Price Prediction 2023 – up to $2,365
Ethereum Price Prediction 2026 – up to $7,465
Ethereum Price Prediction 2029 – up $to $22,410
Ethereum Price Prediction 2032 – up to $64,578
$ETH
#LUNCDream #CryptoWorldbyINQ2

Litecoin Price Prediction 2023-2032: Will LTC Price skyrocket?
Please like, share and follow, as well get your 🎁 by giving the right comment
Litecoin Price Prediction 2023-2032
LTC Price Prediction 2023 – up to $142
LTC Price Prediction 2026 – up to $436
LTC Price Prediction 2029 – up to $1499
LTC Price Prediction 2032 – up to $4000
How much is LTC worth?
The current price of Litecoin stands at $91.1. Over the past 24 hours, it has experienced a trading volume of $1.72B and a market capitalization of $6.71B. Litecoin’s market dominance is at 0.55%. However, there has been a decrease in the LTC price by 0.41% within the last 24 hours. Currently, there are 73.33 million LTC in circulation out of a maximum supply of 84.00 million LTC.
Litecoin price analysis: LTC price attempted to surge but faced resistance at $92
TL; DR Breakdown
LTC price experienced a selling pressure as it reached a high of $92; however, bulls are attempting to hold an uptrend above $90
Resistance for LTC is present at $92
Support for LTC/USD is present at $89.78
The LTC price analysis for 29 July confirms that bulls failed to push the price beyond $92 as bears are strongly dominating that level. As bears pushed the altcoin below and sent the price near the immediate support level, bulls lost confidence.
LTC price analysis 1-day chart: LTC/USD still hovers around resistance zone at $90
Analyzing the daily price chart of Litecoin, Litecoin witnessed a bullish rally after bears failed to maintain a trade below $90. However, after triggering a minor upward correction above $91, LTC price met selling pressure, consolidating the token within a resistance zone at $90-$91. The 24-hour volume declined to $7.7 million, showing a decreased interest in trading activity today. LTC price is currently trading at $91.1, decreasing by nearly 0.4% in the last 24 hours.
The RSI-14 trend line has surged slightly from its previous level but trades below the midline at level of 46, hinting that bulls are yet to gain complete control. The SMA-14 level is suggesting upward volatility in the next few hours.
LTC/USD 4-hour price chart: LTC price tumbles near EMA20
The 4-hour Litecoin price chart suggests that bulls failed to hold the momentum near $92 as buyers faced bearish domination. Currently, bears are dominating the price chart as LTC price faces intense volatility to remain within the EMA20-EMA50 region.
The BoP indicator is trading in a bearish region at 0.12, bringing concerns of an immediate downward correction.
However, the MACD trend line has formed minor green candles above the signal line and the indicator attempts for a bullish reversal, strengthening the buyers’ positions.
What to expect from LTC price analysis next?
The hourly price chart confirms that bulls are inducing buying pressure to hold the price; however, sellers may soon make a comeback. If LTC price holds its momentum above $92, it may climb toward $95.75.
If bulls fail to initiate a surge, LTC price may drop below the immediate support line at $89.78, which may result in a correction to $87.59.
Recent News/Opinions on LTC
Growing Network Activity: Litecoin has achieved a significant landmark in its network transactions. The Litecoin network has recently completed its 170 millionth transaction, as revealed in an enthusiastic Twitter update. This indicates a rapid expansion for Litecoin, with an addition of more than 10 million transactions in the previous seven weeks. This implies that the network handles over a million transactions on a weekly basis.
Litecoin halving: Still on track for August 2023 is Litecoin halving, a much-anticipated event for the LTC community. Why does Litecoin (LTC) halving matter? The Litecoin halving, an important event in the Litecoin monetary system, reduces the subsidy for each block mined by 50% for every 840,000 blocks. Litecoin’s next halving is supposed to take place in August 2023 and will see the rewards for miners drop again by another 50% to 6.25 LTC. Will the price of LTC asset rise after a halving?
#CryptoWorldbyINQ2 #LUNCDream $LTC
Bitcoin (BTC) Price Trades Near 50 Day EMA, Will it Retest $30K?
Bitcoin (BTC) price trading below the crucial barrier of $30k, and sellers maintained their grip by tightly preventing the range. However, mighty bulls continuously tried to overtake the spot but failed to surpass it. In the last month, BTC price showed a breakout of the falling wedge pattern and rallied toward $31K, but buyers did not sustain there and showed a retracement toward $29K.
At the moment, Bitcoin (BTC) technical parameters indicate the buyers are accumulating the price and looking to retest the $30K mark soon. However, the price is close to the 100-day EMA, and a bounce can be anticipated. Moreover, BTC price trading inside the rising wedge pattern took support at $28500 and showed a bounce.
However, the BTC price was noted as a fake breakout on the charts, and buyers were trapped in the last sessions, trying to attain a bounce to unwind their long positions, indicating a rebound toward $30K in the upcoming sessions.
At press time, Bitcoin (BTC) price is trading at $28,911 with an intraday drop of 1.58% showing neutral indications. Moreover, the trading volume increased by 2.32% to $14.43 Billion. However, the market capitalization of BTC is $561.86 Billion. The intraday high of BTC is $29,468.88, and the intraday low is $28,835.13 showing a failure to sustain above $29K.
#LUNCDream #CryptoWorldbyINQ2 $BTC

Terra Classic Spikes as Binance Announces Support for Upgrade; Is $0.005 Next?
Terra Classic (LUNC) experiences a significant surge after Binance announces support for the Terra network upgrade, coinciding with its 6th anniversary.
Speculation arises about the possibility of LUNC reaching the milestone price of $0.005 as attention focuses on its upward trajectory.$LUNC #LUNCDream
Speculation arises about the possibility of LUNC reaching the milestone price of $0.005 as attention focuses on its upward trajectory.$LUNC #LUNCDream


Altcoins Take the Spotlight: LUNC, IOTA, and ORDI Soar in Recent Gains
While Bitcoin and Ethereum have experienced significant upticks in the past week, with increases of 13% and 10% respectively, a handful of altcoins have stolen the show with even more impressive gains. LUNC, IOTA, and ORDI have emerged as the top performers this week, each posting remarkable surges in value.
LUNC (Terra Classic)
LUNC, the native token of the Terra Classic blockchain, has been on a tear this week, skyrocketing over 100% in the past seven days. This surge comes amid renewed interest in the project following the recent launch of its v2.0 mainnet, which aims to address the issues that led to the Terra ecosystem's collapse in May.
IOTA (MIOTA)
IOTA, the token powering the IOTA Tangle, a feeless and scalable distributed ledger technology, has also seen significant gains this week, climbing over 60% in value. This upward trend is likely attributed to the project's recent partnerships with major companies, including Bosch and Dell Technologies.
ORDI (ORDI Network)
ORDI, the native token of the ORDI Network, a decentralized data storage and sharing platform, has also experienced impressive growth this week, surging over 50% in value. This surge is likely fueled by the project's recent launch of its mainnet and the growing interest in decentralized data storage solutions.
Altcoin Dominance on the Rise
The strong performance of these altcoins highlights the growing dominance of altcoins in the crypto market. As investors seek out alternative investment options with potentially higher returns, altcoins are gaining traction and attracting increasing attention.
Important Considerations
As with any investment, it's crucial to conduct thorough research and exercise caution before investing in altcoins. The crypto market is highly volatile, and altcoins are often riskier than more established cryptocurrencies like Bitcoin and Ethereum. Investors should only invest in altcoins they understand and have a reasonable expectation of success.
#ORDI
#IOTA/USDT
#LUNCDream

Ethereum's 1.4% Price Surge to $1,877.31: Key Takeaways for July 27, 2023
The data shows that Ethereum's price has seen a 1.4% surge over the past hour to $1,877.31, along with a market cap of $222.42B and 24 hour trading volume of $4.02B. In the past day, Ethereum's price is up a slight 0.16%, while it is down 0.91% over the past week. Over the past month, ETH has dropped 2.36%, but is up 16.51% over the past 6 months.#LUNCDream #CryptoWorldbyINQ2 $ETH
NEAR Price Prediction 2023-2032: Is the NEAR Protocol a Good Investment?
NEAR Price Prediction 2023-2032
NEAR Protocol Price Prediction 2023 – up to $1.99
NEAR Protocol Price Prediction 2023 – up to $6.19
NEAR Protocol Price Prediction 2023 – up to $19.92
NEAR Protocol Price Prediction 2023 – up to $61.32
Near Protocol (NEAR) is a blockchainplatform with significant attention and partnerships within the cryptocurrency industry. Initially established by a small team in San Francisco, NEAR Protocol has rapidly expanded its influence and formed collaborations with industry giants. As a result, it has witnessed a consistent upward trajectory since its inception.
Cryptocurrencies continue to gain traction as a viable asset class, and investors are becoming more aware of the potential for long-term returns. In this NEAR Price Prediction, we will look at the current price state of the NEAR Protocol and its price predictions between 2023 – 2032 to determine if it is a good investment opportunity.
How much is NEAR Protocol worth today?
Today’s live NEAR Protocol price is $1.38, with a 24-hour trading volume of $46,606,735. NEAR Protocol is down 2.07% in the last 24 hours. The current CoinMarketCap ranking is #40, with a live market cap of $1,291,239,382. It has a circulating supply of 941,671,517 NEAR coins, and the max. supply is not available.
NEAR Protocol price analysis: NEAR dips to lows of $1.38 as bears continue to dominate
NEAR Protocol price analysis confirms a downtrend.
Support is found at the $1.37 level.
Bearish pressure rules over the NEAR/USD.
The NEAR Protocol price analysis for 02-08-2023 shows a sharp price decrease. The initial support found around $1.37 has been broken down, forming a downward trend. The bearish wave is getting stronger as the selling momentum intensifies with time. The downward curve is expected to extend in the upcoming hours, and the price is drawing closer to the support level. The NEAR/USD value is displayed at $1.37, with a decrease of 2.07 percent.
NEAR/USD 1-day price chart: NEAR falls sharply as Bears mount pressure
The NEAR/USD 1-day price chart reveals a breakdown at the $1.38 level after the bearish divergence was noticed past few hours. The downward channel is expected to continue in the upcoming hours with an extension below $1.42. The price underwent a surge in the early hours of the day and hit a high of $1.42 but the bearish pressure took over the market and pulled the price down close to support level.
The MACD indicator reflects a bearish divergence as it moves below the zero line, supporting the downtrend. The Relative strength index has moved lower and is placed at 45.22, hinting toward selling pressure. The volatility in the market is to remain high with a negative outlook. The Bollinger bands are squeezing, with the lower band at $1.32 and the upper band at $1.52, indicating a tight trading range.
NEAR price analysis: Price steps down to $1.38 as the bearish wave intensifies
NEAR Protocol price analysis reveals a downtrend as the bears have completely controlled the market. The breakdown at $1.38 has been confirmed by the moving averages, which are trending in a bearish direction with an extended downward slope. The selling pressure is expected to persist as long as the NEAR/USD value remains below the 50-day moving average.
The area between the Bollinger bands is increasing, suggesting that further downtrends are coming ahead as the volatility increases. The upper band of the Bollinger bands indicator is touching $1.42, while the lower band is close to $1.34, forming a tight range for further price moves. The MACD indicator is in a negative region, indicating that the bearish wave will remain strong. The RSI displays a bearish divergence at 42.30, indicating selling pressure in the NEAR markets.
What to expect from NEAR Protocol price analysis
To conclude, NEAR Protocol price analysis shows that the bears completely dominate the market. The support at $1.37 needs to be watched carefully, and any break below this level may lead to further losses. On the upside, the resistance is found at $1.42, and a possible break above this level may help with some bullish pressure. The volatility in the market remains high as the technical indicators are moving in a bearish direction.
#CryptoWorldbyINQ2 #LUNCDream $NEAR

Ethereum Price Prediction 2023-2032: Will ETH reach $8000 soon?
Ethereum Price Prediction 2023-2032
Ethereum Price Prediction 2023 – up to $2,365
Ethereum Price Prediction 2026 – up to $7,465
Ethereum Price Prediction 2029 – up to $22,410
Ethereum Price Prediction 2032 – up to $64,578
$ETH #LUNCDream #CryptoWorldbyINQ2
Ethereum Price Prediction 2023 – up to $2,365
Ethereum Price Prediction 2026 – up to $7,465
Ethereum Price Prediction 2029 – up to $22,410
Ethereum Price Prediction 2032 – up to $64,578
$ETH #LUNCDream #CryptoWorldbyINQ2
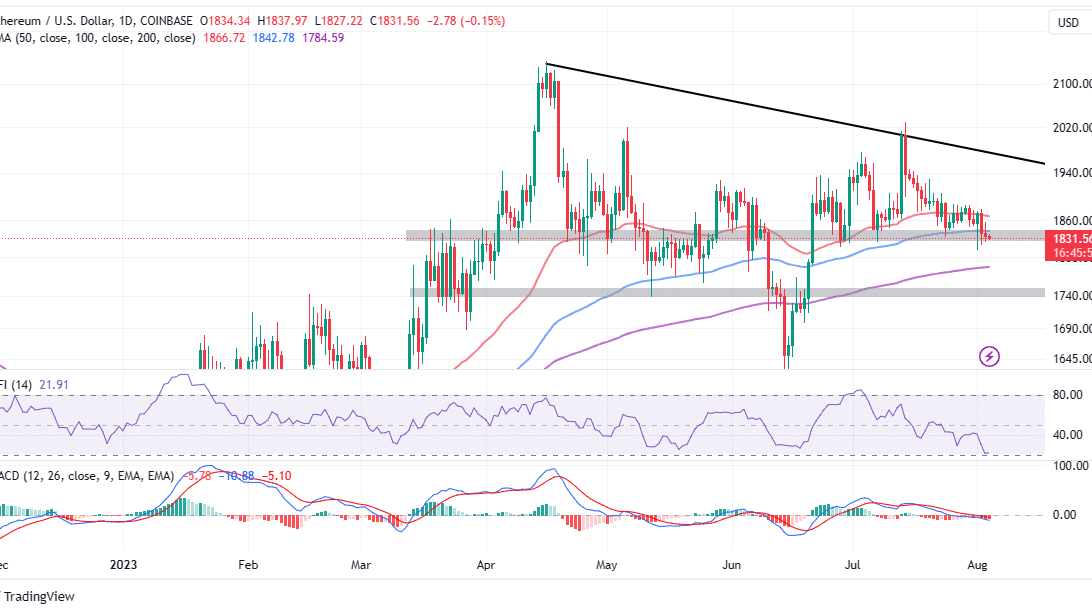
Ethereum Price Doldrums: How to Survive Second Stage Capitulation
Ethereum price is struggling to keep support at $1,830 intact, while the entire crypto market continues with its longstanding lull. Since the rejection from $2,000 around mid-July, recovery attempts have been minimal, with the least resistance path mainly downward.
Based on the prevailing technical picture, bears have the upper hand, especially with Ethereum price below all the major moving averages such as the 50-day EMA (red), the 100-day EMA (blue), and the 200-day EMA (purple).
Support at $1,830 is critical for the resumption of the uptrend, but if declines intensify, the buyer congestion at $1,800 will come in handy.
Ethereum Price Final Capitulation
The crypto winter has lasted well over two years with attribute to many attacks on the blockchain ecosystem, including the Terra crash “through which governments are stepping in with a regulatory framework… to protect investors,” Michaël van de Poppe, a popular analyst told investors on Friday.
This push to regulate the market, although understandable, is exerting a lot of pressure to the extent of risking the survival of the crypto ecosystem.
In addition to the recently resolved matter between Ripple and the SEC, the regulator is suing Coinbase and Binance, and the DoJ has been investigating the latter exchange platform. In all this, proposals for Ethereum and Bitcoin exchange-traded funds (ETFs) have surged in the past couple of months, bringing institutions like Blackrock and Valkyrie into the industry.
Ethereum and most other altcoins, according to Poppe, “have been trending downwards for 18-24 months straight.
However, one notable fundamental factor is that the supply on exchange continues to shrink to the lowest levels while staking both on the Ethereum protocol and liquid staking platforms like Lido soar to the highest levels since the implementation of the Shanghai upgrade.
The mundane market structure represents “the second stage of capitulation, which is time.” Investors will continue to feel like markets are unresponsive, with some shunning crypto for other industry sectors.
As for investors, perhaps excluding traders, it is wise to keep calm and be patient with the market. Accumulation, according to Poppe the best strategy at the moment, with institutions like Blackrock jumping in.
What’s Next for Ethereum Price in The Short Term?
The bearish outlook in both the Moving Average Convergence Divergence (MACD) and the Money Flow Index (MFI) hints at declines continuing to $1,800 in the short term. In addition to the sell signal, the MACD holds below the mean line (0.00), further reinforcing the bearish grip.
If bulls manage the arrest the bearish situation at $1,830 traders can prepare to seek fresh exposure to ETH longs after the price steps above the 100-day EMA. The subsequent break above the 50-day EMA at $1,866 would serve as confirmation for a stronger uptrend to be validated by recovery past the descending trendline for gains above $2,000.
#LUNCDream #CryptoWorldbyINQ2 $BTC $ETH
FTM Price Prediction 2023
Fantom (FTM) is a unique blockchain platform designed to overcome the limitations of traditional systems through speed, security, and scalability. Leveraging its innovative Lachesis Protocol and Ethereum-compatible Opera Chain, Fantom offers a novel solution to the blockchain trilemma. However, the journey of FTM has seen several ups and downs, including a significant setback due to the Multichain hack. This article aims to provide a comprehensive overview of Fantom and delve into the future of FTM, covering price predictions from 2023 to 2030. From fundamental analysis to technical projections, we will explore various factors that could influence FTM’s trajectory in the coming years.
What we are going to learn?
What is Fantom?
Fantom is a decentralized, open-source, and permissionless smart-contract platform built on a consensus protocol called Lachesis. It provides faster, cheaper transactions with high security, and is compatible with Ethereum Virtual Machine (EVM), allowing for easy smart contract creation and deployment. It can process thousands of transactions per second, achieves transaction finality in about one second, and offers absolute finality, meaning completed transactions can’t be reverted. It also allows multiple blockchains to operate independently while communicating with each other, each with their own custom tokens and governance rules.
FTM is the native token of the Fantom network, used for securing the network through a Proof-of-Stake system, facilitating payments due to fast transaction times and low fees, and serving as the token for on-chain governance and network fees. The total supply is 3.175 billion, with 2.8 billion in circulation and the rest reserved for staking rewards. FTM can be bought on major exchanges and stored and staked in Fantom’s fWallet.
Fantom (FTM) price prediction for 2023 presents an optimistic trajectory, indicating a potential recovery from its current bearish phase. Presently, FTM is trading at $0.24, significantly below its all-time high (ATH) of $3.46, a drop largely attributed to market fluctuations and the recent Multichain hack. Yet, as we look forward into 2023, predictions suggest a potential recovery. Starting from July, FTM’s value is expected to climb, reaching up to $0.35. Despite a small anticipated dip in October, the trend continues positively, with the price potentially hitting $0.61 by December. This forecast indicates a promising turn for FTM, encouraging for its investors.$FTM #LUNCDream #CryptoWorldbyINQ2
Tesla’s Bitcoin Holdings on Balance Sheet Remains at $184M
Tesla's digital asset holdings remained unchanged, with $184 million worth of digital assets still included on its balance sheet as of Q2 2023.
Due to accounting regulations that prevent unrealized gains on cryptocurrencies from being recorded, the value of the holdings remained unchanged throughout the quarter even though the price of Bitcoin increased by about 7%.
Tesla reported purchasing $1.5 billion in Bitcoin in February 2021 and selling almost 75% of its Bitcoin holdings in Q2 2022, bringing the entire value of digital assets on its balance sheet down to $218 million.
Tesla's CEO, Elon Musk, stated that the firm is open to boosting its Bitcoin holdings in the future during the company's earnings call in July 2022. Later, in Q4 2022, the corporation cut its holdings of digital assets from $218 million to $184 million, and it has remained at that level ever since.
Musk is known for his fondness for Dogecoin but has also said he's not advising anyone to buy crypto or bet the farm on Dogecoin.$BTC #bitcoin #LUNCDream
