

#hbarprice
hbarprice
530,797 views
391 Discussing
Hot
Latest

$HBAR Entry A (safer): pullback to 0.105–0.108, the retest of the level the spike broke through.
Entry B (deeper dip): 0.095–0.097, the old consolidation zone.
Stop-loss: below 0.093 for Entry B, or below 0.099 for Entry A.
Targets: 0.121, then 0.131, then 0.134+ if it breaks the high.
Short (sell)
Entry A: rejection at 0.125–0.130, only after a bearish 4h candle confirms it, since the wick at 0.131 already showed selling.
Entry B: a 4h candle closing below 0.108, which would be a breakdown short.
Stop-loss: above 0.1345 for Entry A, or above 0.113 for Entry B.
Targets: 0.108, then 0.097, then 0.095.
#HBARPrice
$HBAR Entry A (safer): pullback to 0.105–0.108, the retest of the level the spike broke through.
Entry B (deeper dip): 0.095–0.097, the old consolidation zone.
Stop-loss: below 0.093 for Entry B, or below 0.099 for Entry A.
Targets: 0.121, then 0.131, then 0.134+ if it breaks the high.
Short (sell)
Entry A: rejection at 0.125–0.130, only after a bearish 4h candle confirms it, since the wick at 0.131 already showed selling.
Entry B: a 4h candle closing below 0.108, which would be a breakdown short.
Stop-loss: above 0.1345 for Entry A, or above 0.113 for Entry B.
Targets: 0.108, then 0.097, then 0.095.
#HBARPrice
Entry B (deeper dip): 0.095–0.097, the old consolidation zone.
Stop-loss: below 0.093 for Entry B, or below 0.099 for Entry A.
Targets: 0.121, then 0.131, then 0.134+ if it breaks the high.
Short (sell)
Entry A: rejection at 0.125–0.130, only after a bearish 4h candle confirms it, since the wick at 0.131 already showed selling.
Entry B: a 4h candle closing below 0.108, which would be a breakdown short.
Stop-loss: above 0.1345 for Entry A, or above 0.113 for Entry B.
Targets: 0.108, then 0.097, then 0.095.
#HBARPrice
2
114

·
--
Bearish
30.5% pumped- $HBAR
{spot}(HBARUSDT)
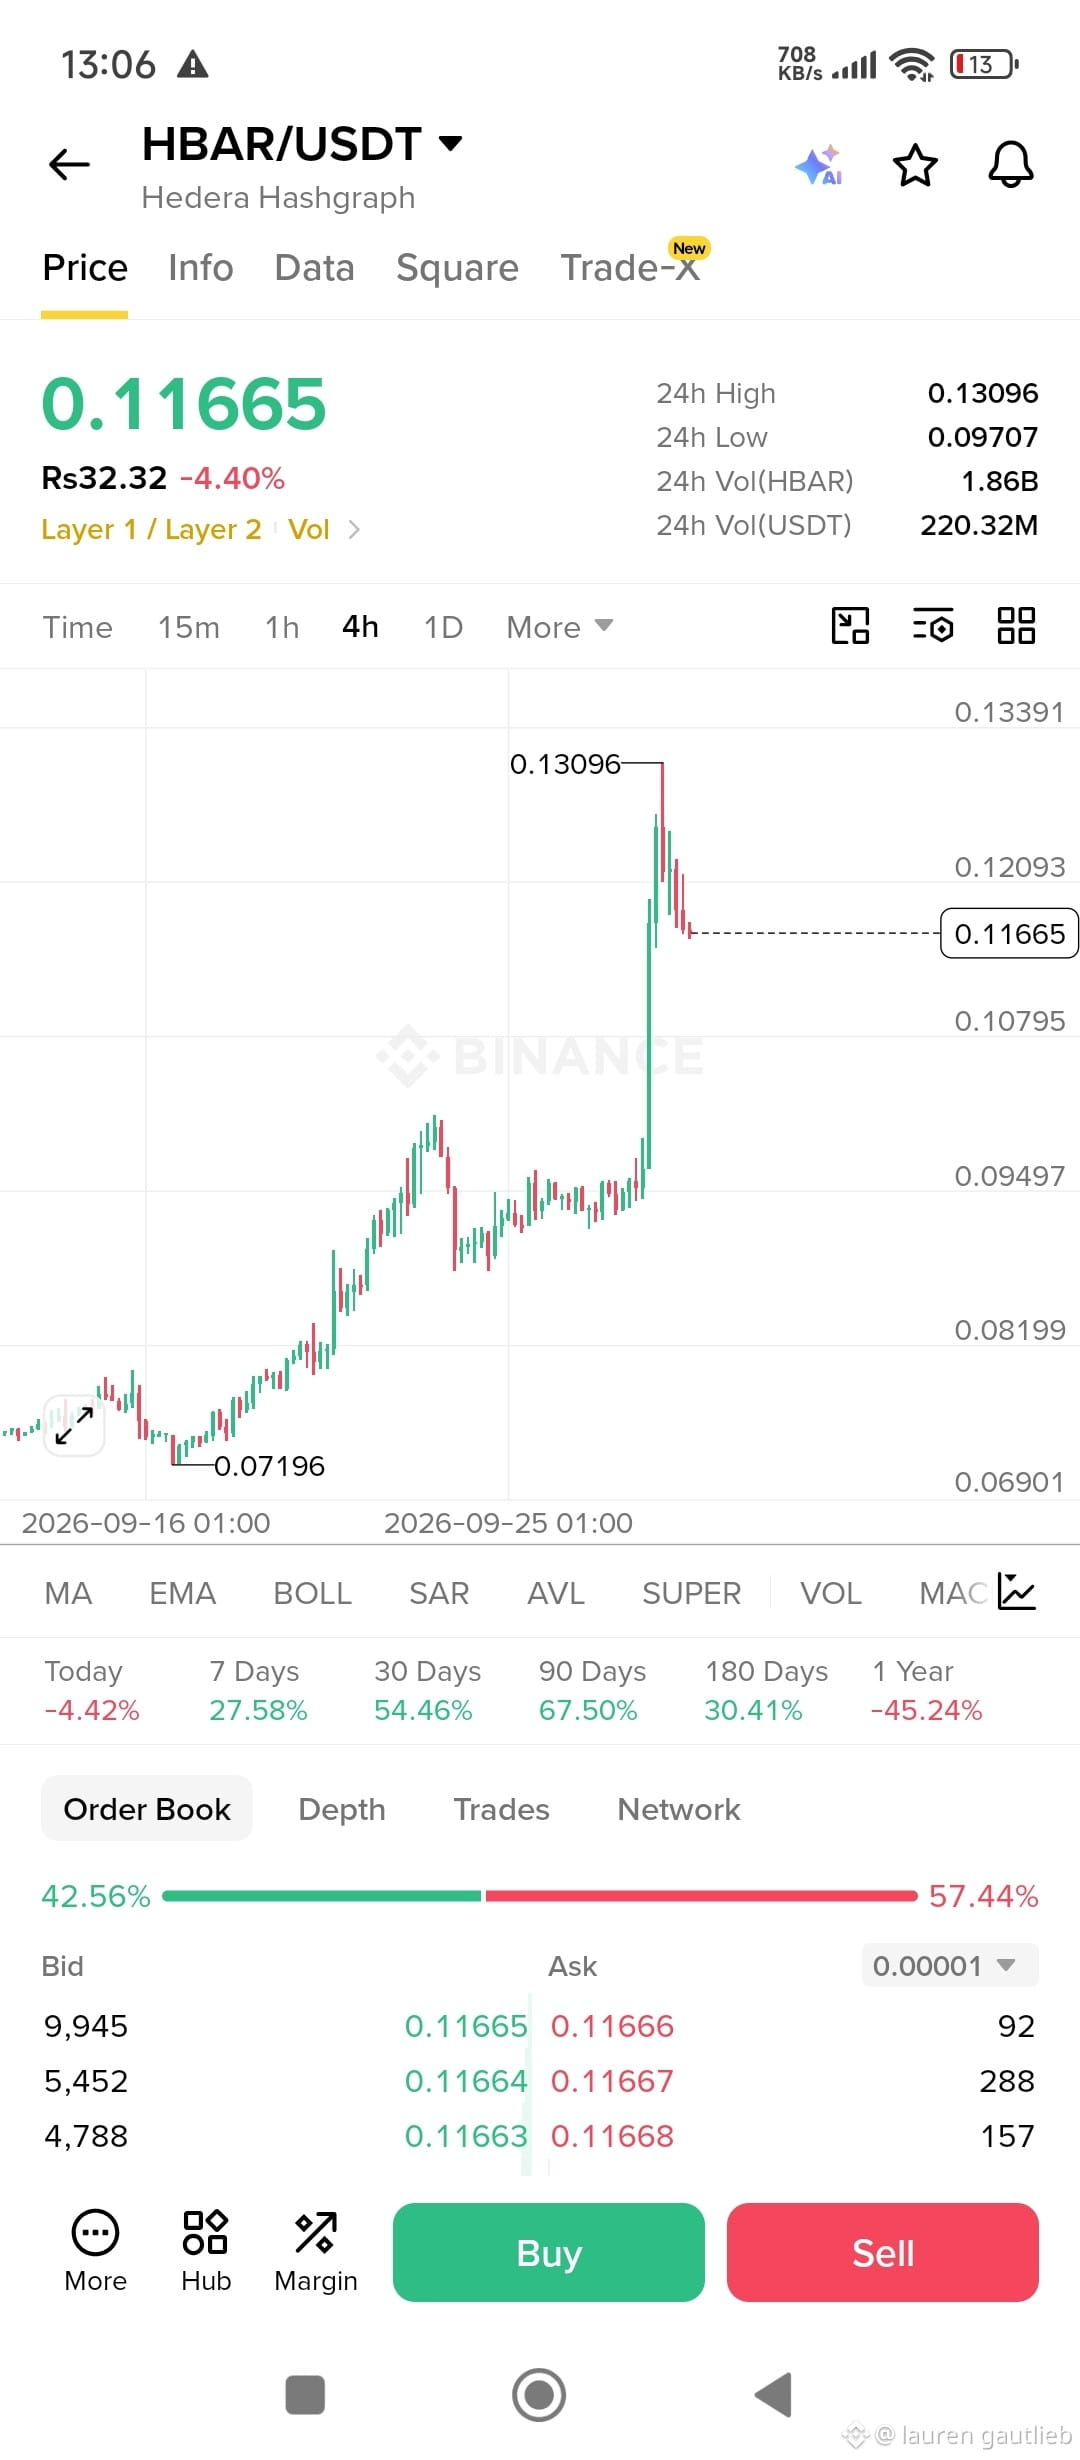
The interesting part is that $HBAR has already pushed into the $0.125 area, where recent Binance Square technical analysis identified resistance and a rejection. That analysis also identified $0.1155 and $0.1115 as nearby
supports.
Entry zone: $0.1235 – $0.1250
Stop-loss: $0.1290
Targets:
🎯 TP1: $0.1180
🎯 TP2: $0.1155
🎯 TP3: $0.1115
At an entry around $0.124, TP2 gives roughly 2:1 reward/risk, while TP3 is roughly 3:1.
Why am I watching the short?
HBAR has already made a very aggressive move.
When a coin moves this quickly, I don't want to chase the green candles.
Instead, I'm watching the $0.1235–$0.1250 area for signs that the momentum is slowing and sellers are stepping in.
If price reaches this zone and shows rejection, the short setup becomes interesting.
This is my technical-analysis scenario for educational purposes, not financial advice or a guarantee of future price movement. Crypto is highly volatile. Always do your own research and manage your risk.
#HBARPrice #CryptoTrading #BinanceSquareTalks #TechnicalAnalysis_Tickeron #crypto
30.5% pumped- $HBAR
The interesting part is that $HBAR has already pushed into the $0.125 area, where recent Binance Square technical analysis identified resistance and a rejection. That analysis also identified $0.1155 and $0.1115 as nearby
supports.
Entry zone: $0.1235 – $0.1250
Stop-loss: $0.1290
Targets:
🎯 TP1: $0.1180
🎯 TP2: $0.1155
🎯 TP3: $0.1115
At an entry around $0.124, TP2 gives roughly 2:1 reward/risk, while TP3 is roughly 3:1.
Why am I watching the short?
HBAR has already made a very aggressive move.
When a coin moves this quickly, I don't want to chase the green candles.
Instead, I'm watching the $0.1235–$0.1250 area for signs that the momentum is slowing and sellers are stepping in.
If price reaches this zone and shows rejection, the short setup becomes interesting.
This is my technical-analysis scenario for educational purposes, not financial advice or a guarantee of future price movement. Crypto is highly volatile. Always do your own research and manage your risk.
#HBARPrice #CryptoTrading #BinanceSquareTalks #TechnicalAnalysis_Tickeron #crypto
The interesting part is that $HBAR has already pushed into the $0.125 area, where recent Binance Square technical analysis identified resistance and a rejection. That analysis also identified $0.1155 and $0.1115 as nearby
supports.
Entry zone: $0.1235 – $0.1250
Stop-loss: $0.1290
Targets:
🎯 TP1: $0.1180
🎯 TP2: $0.1155
🎯 TP3: $0.1115
At an entry around $0.124, TP2 gives roughly 2:1 reward/risk, while TP3 is roughly 3:1.
Why am I watching the short?
HBAR has already made a very aggressive move.
When a coin moves this quickly, I don't want to chase the green candles.
Instead, I'm watching the $0.1235–$0.1250 area for signs that the momentum is slowing and sellers are stepping in.
If price reaches this zone and shows rejection, the short setup becomes interesting.
This is my technical-analysis scenario for educational purposes, not financial advice or a guarantee of future price movement. Crypto is highly volatile. Always do your own research and manage your risk.
#HBARPrice #CryptoTrading #BinanceSquareTalks #TechnicalAnalysis_Tickeron #crypto
102

·
--
Bullish
$HBAR
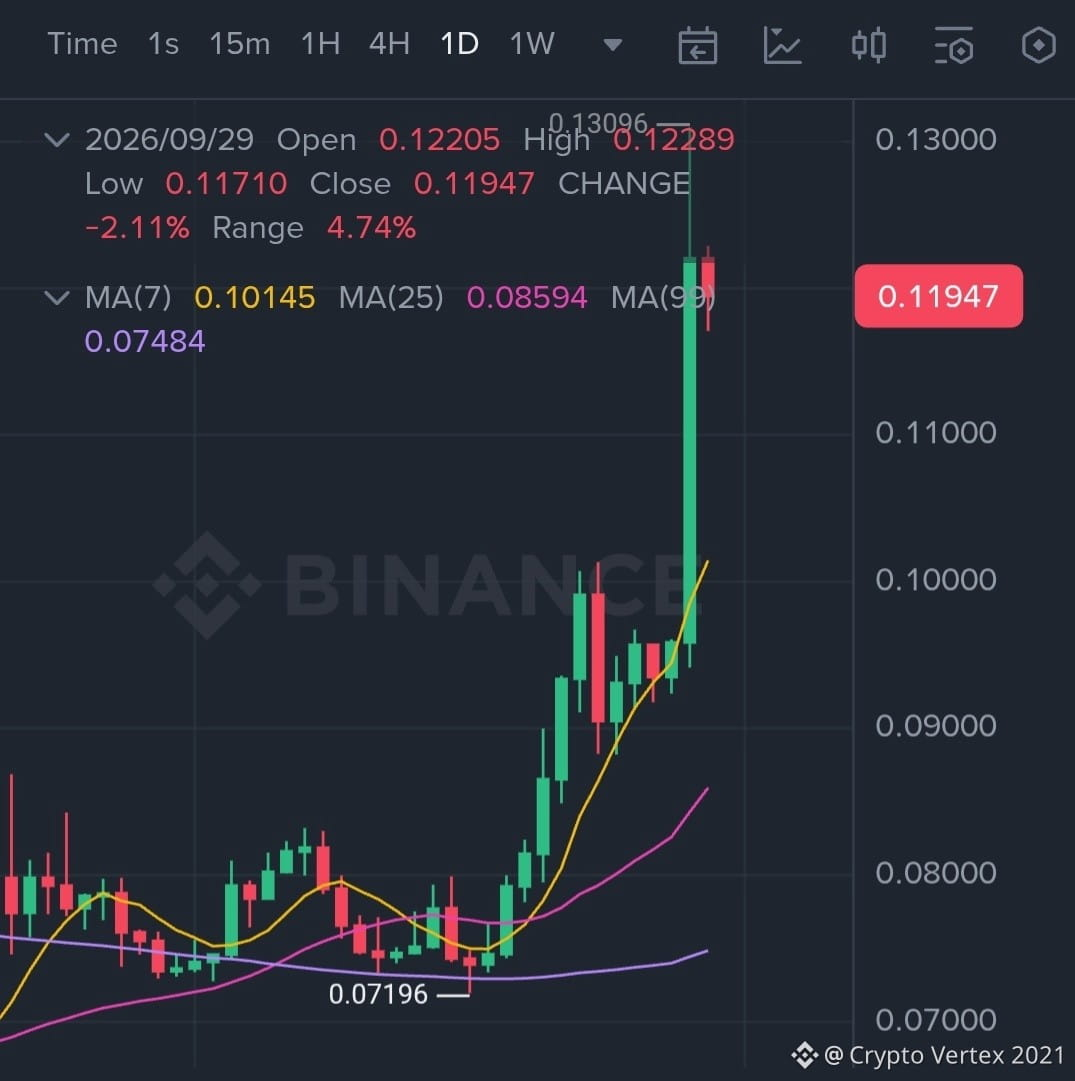
Spot plan
Entry Zone 1: $0.1180–$0.1210
Entry Zone 2: $0.1130–$0.1160
TP1: $0.1265
TP2: $0.1310
TP3: $0.1370
Invalidation/exit: sustained 1H close below $0.1130
Key confirmation: If HBAR reclaims $0.1265–$0.1310 with strong volume, that would indicate renewed upside momentum. If it loses $0.1130, wait rather than averaging aggressively.
⚠️ HBAR is already up sharply, so for spot trading I’d favor scaling into support rather than buying the full position at $0.12086.
{spot}(HBARUSDT)
#HBARPrice
#HBARUSDT
#HBAR_usdt
#HBAR/USDT
#HBAR/
$HBAR
Spot plan
Entry Zone 1: $0.1180–$0.1210
Entry Zone 2: $0.1130–$0.1160
TP1: $0.1265
TP2: $0.1310
TP3: $0.1370
Invalidation/exit: sustained 1H close below $0.1130
Key confirmation: If HBAR reclaims $0.1265–$0.1310 with strong volume, that would indicate renewed upside momentum. If it loses $0.1130, wait rather than averaging aggressively.
⚠️ HBAR is already up sharply, so for spot trading I’d favor scaling into support rather than buying the full position at $0.12086.
#HBARPrice
#HBARUSDT
#HBAR_usdt
#HBAR/USDT
#HBAR/
Spot plan
Entry Zone 1: $0.1180–$0.1210
Entry Zone 2: $0.1130–$0.1160
TP1: $0.1265
TP2: $0.1310
TP3: $0.1370
Invalidation/exit: sustained 1H close below $0.1130
Key confirmation: If HBAR reclaims $0.1265–$0.1310 with strong volume, that would indicate renewed upside momentum. If it loses $0.1130, wait rather than averaging aggressively.
⚠️ HBAR is already up sharply, so for spot trading I’d favor scaling into support rather than buying the full position at $0.12086.
#HBARPrice
#HBARUSDT
#HBAR_usdt
#HBAR/USDT
#HBAR/
93

·
--
$HBAR — Short Analysis
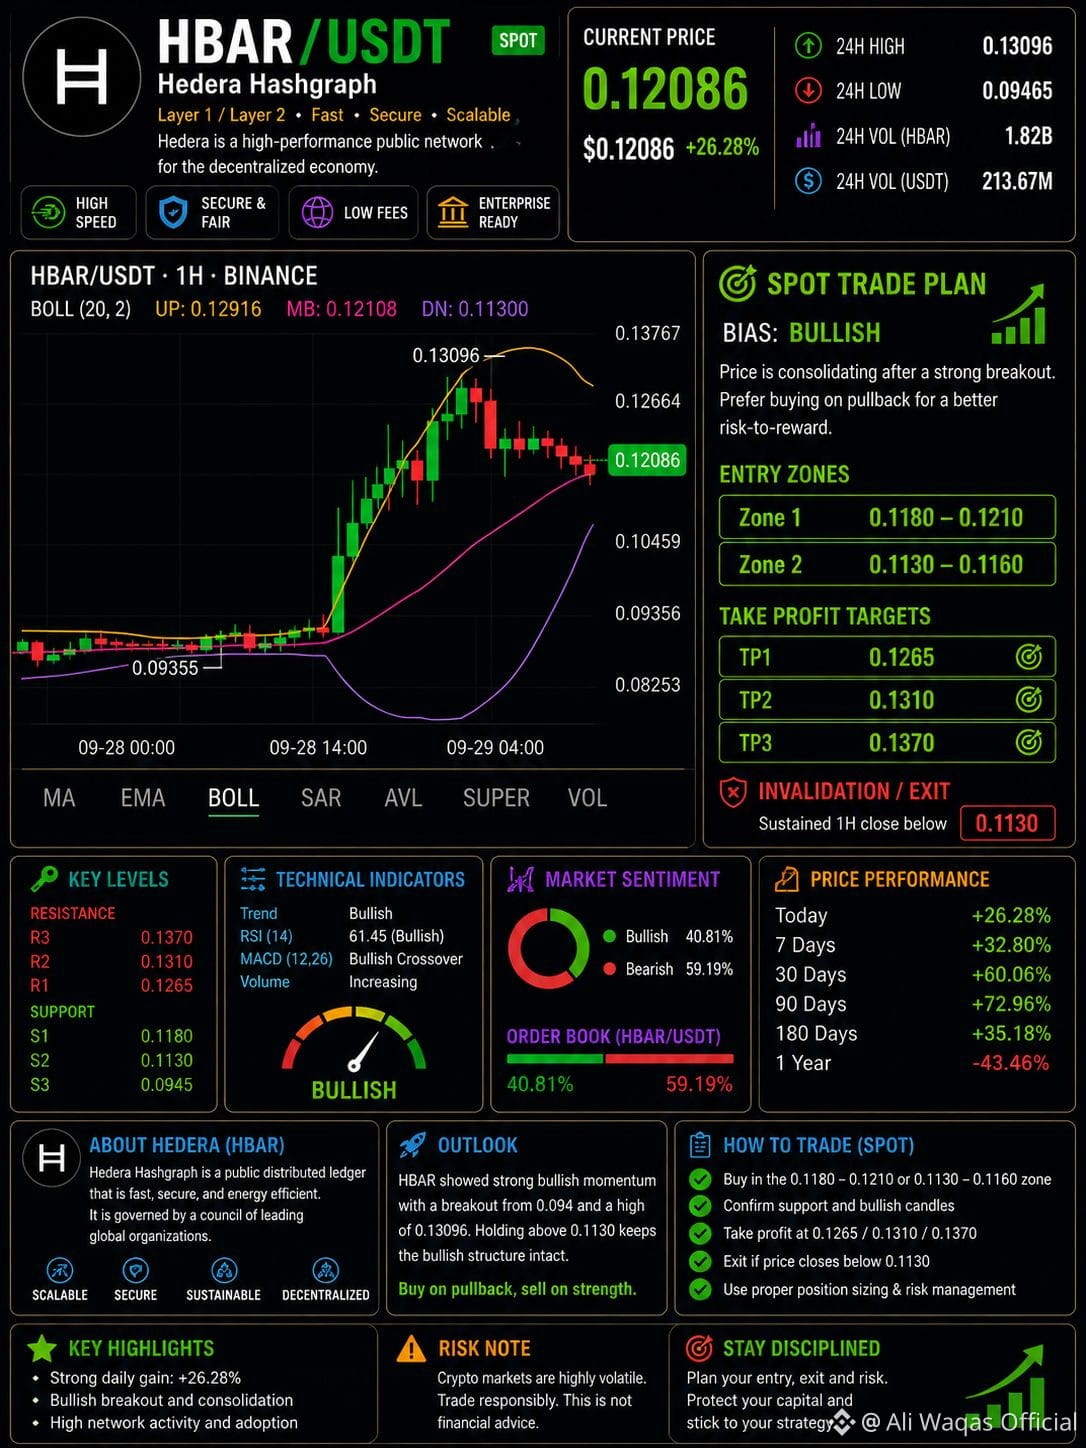
Current price: around $0.119. $HBAR has made a very strong move, rising roughly 26% in 24 hours, with today’s range around $0.094–$0.131.
* 📈 Trend: Strong bullish momentum
* 🟢 Support: $0.107–$0.110
* 🟢 Major support: ~$0.100
* 🔴 Resistance: $0.125–$0.130
* 🎯 Next upside area: ~$0.15 if $0.13 breaks convincingly
* ⚠️ Risk: RSI has moved into overbought territory after the sharp rally, so a pullback/consolidation is possible.
* 🚀 Catalysts: Recent IBM and BlackRock/Hedera developments have contributed to the surge.
Simple view: $HBAR momentum is currently strong, but after such a rapid pump, chasing the price carries higher pullback risk. Watch $0.107–$0.110 for support and $0.13 for breakout confirmation.
#HBARUSDT
#HBARPrice
#HBARUSD
#GoldFallsTo$4144
$HBAR — Short Analysis
Current price: around $0.119. $HBAR has made a very strong move, rising roughly 26% in 24 hours, with today’s range around $0.094–$0.131.
* 📈 Trend: Strong bullish momentum
* 🟢 Support: $0.107–$0.110
* 🟢 Major support: ~$0.100
* 🔴 Resistance: $0.125–$0.130
* 🎯 Next upside area: ~$0.15 if $0.13 breaks convincingly
* ⚠️ Risk: RSI has moved into overbought territory after the sharp rally, so a pullback/consolidation is possible.
* 🚀 Catalysts: Recent IBM and BlackRock/Hedera developments have contributed to the surge.
Simple view: $HBAR momentum is currently strong, but after such a rapid pump, chasing the price carries higher pullback risk. Watch $0.107–$0.110 for support and $0.13 for breakout confirmation.
#HBARUSDT
#HBARPrice
#HBARUSD
#GoldFallsTo$4144
Current price: around $0.119. $HBAR has made a very strong move, rising roughly 26% in 24 hours, with today’s range around $0.094–$0.131.
* 📈 Trend: Strong bullish momentum
* 🟢 Support: $0.107–$0.110
* 🟢 Major support: ~$0.100
* 🔴 Resistance: $0.125–$0.130
* 🎯 Next upside area: ~$0.15 if $0.13 breaks convincingly
* ⚠️ Risk: RSI has moved into overbought territory after the sharp rally, so a pullback/consolidation is possible.
* 🚀 Catalysts: Recent IBM and BlackRock/Hedera developments have contributed to the surge.
Simple view: $HBAR momentum is currently strong, but after such a rapid pump, chasing the price carries higher pullback risk. Watch $0.107–$0.110 for support and $0.13 for breakout confirmation.
#HBARUSDT
#HBARPrice
#HBARUSD
#GoldFallsTo$4144
285

{future}(HBARUSDT)
$HBAR
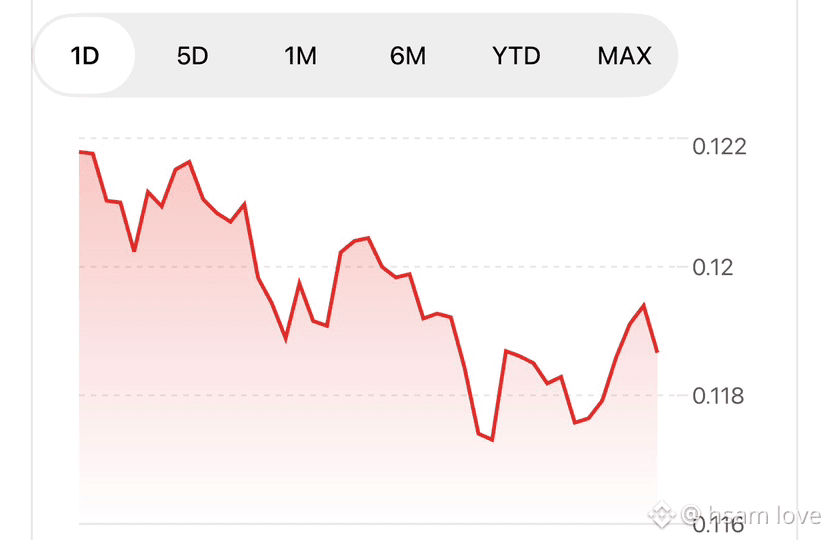
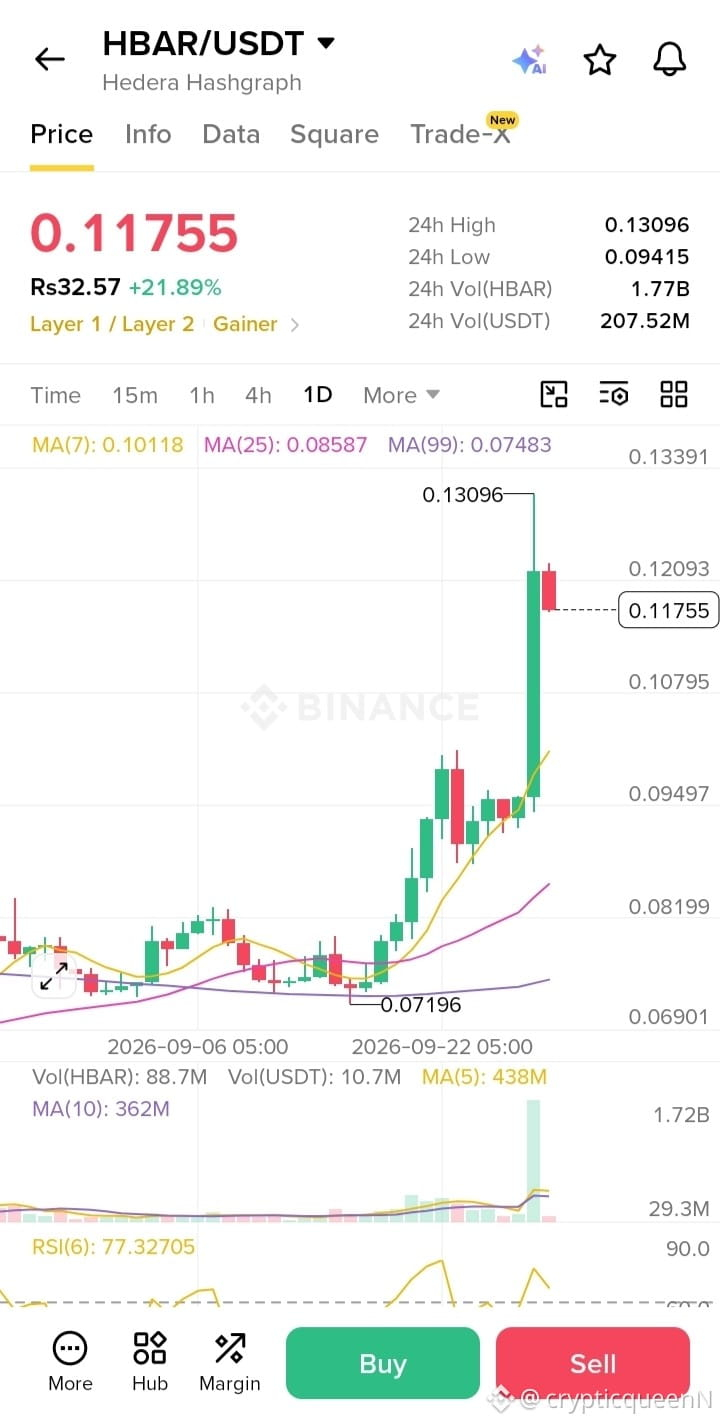
Hedera Hashgraph just ripped through key resistance, printing a high of $0.1309 on huge daily volume
#HBARPrice
#UKFCAWinsCourtOrderToRecover851400Pounds
$HBAR
Hedera Hashgraph just ripped through key resistance, printing a high of $0.1309 on huge daily volume
#HBARPrice
#UKFCAWinsCourtOrderToRecover851400Pounds
Hedera Hashgraph just ripped through key resistance, printing a high of $0.1309 on huge daily volume
#HBARPrice
#UKFCAWinsCourtOrderToRecover851400Pounds
102

·
--
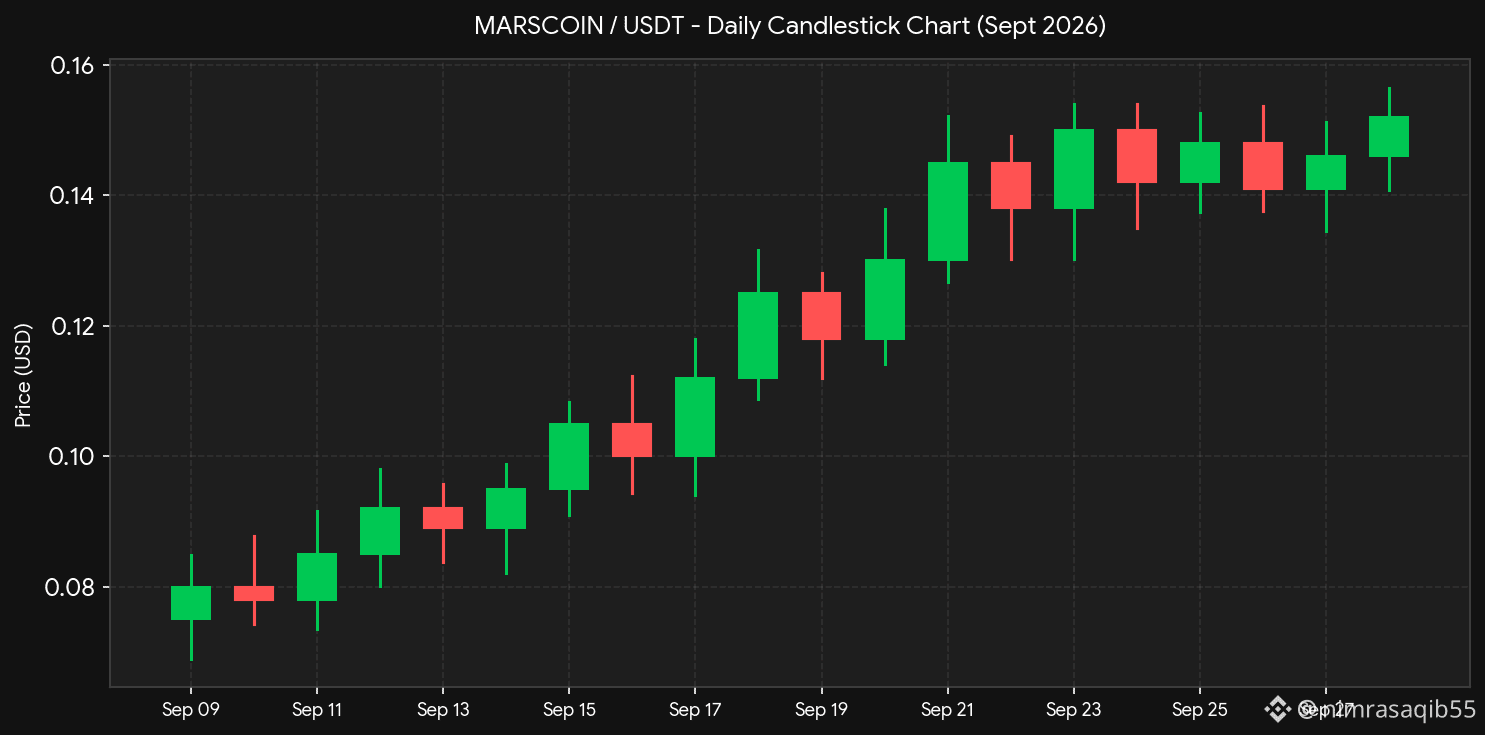
$HBAR is looking extremely constructive here, printing a clean series of higher highs and higher lows on the daily chart throughout September. After consolidating well above the critical $0.11 support flip, we've broken past the $0.14 psychological barrier. We are now testing the next major resistance cluster near $0.16; a convincing daily close above that level, backed by volume, sets a clear path toward the $0.19–$0.21 range. Keep stops tight below the recent breakout zone at $0.13.
#HBARPrice
{spot}(HBARUSDT)
$HBAR is looking extremely constructive here, printing a clean series of higher highs and higher lows on the daily chart throughout September. After consolidating well above the critical $0.11 support flip, we've broken past the $0.14 psychological barrier. We are now testing the next major resistance cluster near $0.16; a convincing daily close above that level, backed by volume, sets a clear path toward the $0.19–$0.21 range. Keep stops tight below the recent breakout zone at $0.13.
#HBARPrice
#HBARPrice
92


Article
HBAR: The Next Big Crypto Opportunity?Hedera ($HBAR) is attracting renewed attention as an enterprise-focused blockchain with growing network activity, institutional partnerships, and potential applications in payments, tokenization, identity, and verifiable AI infrastructure.
Current Market Overview
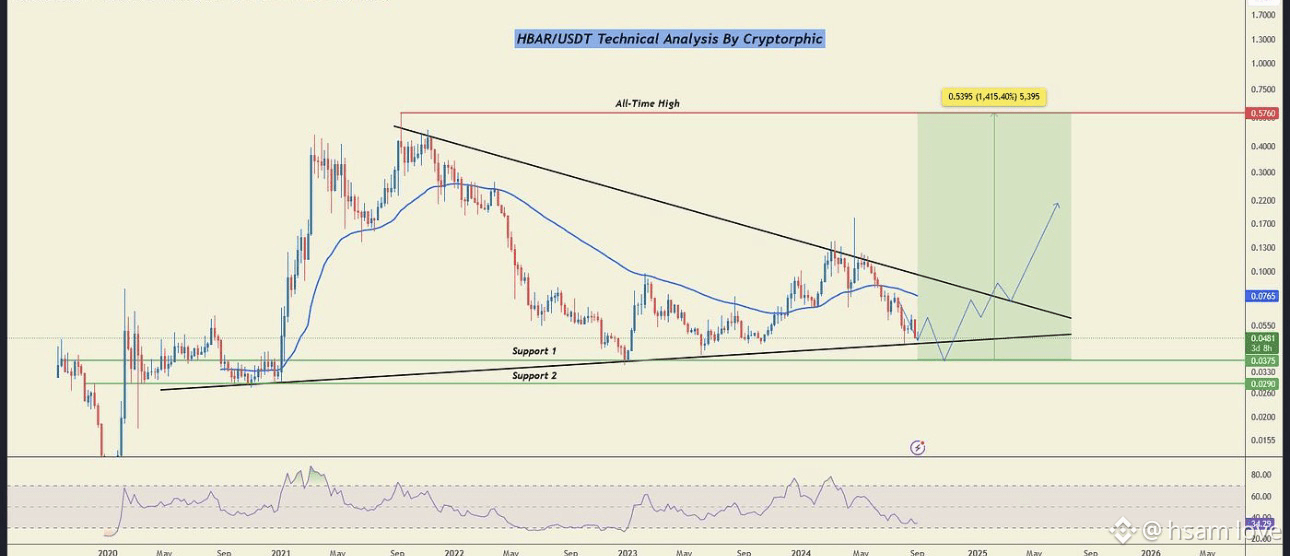
As of September 9, 2026, HBAR is trading around $0.0787, with a market capitalization of approximately $3.46 billion and around 43.83 billion HBAR in circulation.
HBAR remains significantly below its all-time high of approximately $0.56, reached in September 2021. At current levels, the token is roughly 86% below that historical peak.
Despite this long-term decline from its ATH, HBAR has shown positive performance during 2026, with the Messari analysis reporting approximately 21.82% year-to-date growth.
Strong Network Activity
One of the most encouraging developments is the growth in Hedera's network activity.
On September 3, Hedera processed approximately 593,000 unique transactions, representing its highest daily count in more than a month. The analysis also reported a 56% weekly increase in on-chain volume.
Growing transaction activity can be important for a long-term investment thesis because it indicates that the network is being used rather than relying entirely on speculative trading.
Enterprise Adoption
Hedera's strongest differentiator is its focus on enterprise and institutional use cases.
Several developments highlighted in the Messari analysis include:
WISeKey and SpaceDev joining the Hedera Governing Council.Taurus offering the Hedera technology stack to more than 40 banks.Hedera participating in Mastercard's crypto partner program.Increasing institutional interest through the spot HBAR ETF.Expansion into areas such as cybersecurity, identity, carbon tracking, and financial infrastructure.
If these partnerships translate into meaningful real-world usage, they could become an important long-term catalyst for HBAR.
Hedera Technology
Hedera uses the Hashgraph consensus algorithm rather than a traditional blockchain architecture.
The network is designed around several important characteristics:
High transaction throughputFast finalityLow transaction costsFair transaction orderingProof-of-Stake securityEVM compatibilityTokenization and smart-contract capabilities
Hedera also provides services for tokenization, consensus, and decentralized applications. Its growing focus on verifiable AI infrastructure could potentially create additional use cases as the AI and blockchain sectors increasingly overlap.
HBAR Tokenomics
HBAR has a maximum supply of 50 billion tokens, with approximately 43.8 billion currently circulating.
The relatively high circulating supply means that investors should continue monitoring future token releases and supply dynamics.
Controlled supply releases can create selling pressure if new tokens enter the market faster than demand grows. Therefore, network adoption and demand growth will remain important for HBAR's long-term valuation.
Technical Analysis
Several important technical levels were highlighted in the Messari analysis.
Support Levels
$0.0670–$0.0688: Immediate support zone$0.0651–$0.0660: Stronger support zone
A sustained breakdown below these areas could weaken the bullish setup.
Resistance Levels
$0.0690–$0.0705: Immediate resistance$0.0719: Important breakout confirmation level$0.177–$0.199: Major longer-term resistance zone
A daily close above $0.0719 was identified as an important technical confirmation for stronger bullish momentum.
Momentum Indicators
The technical picture is currently mixed rather than strongly bullish.
The analysis places the RSI around 48–50, indicating relatively neutral momentum.
The MACD has shown a recent bullish crossover, while Chaikin Money Flow around 0.11 suggests positive buying pressure.
However, the relatively low ADX indicates that trend strength remains weak. This means HBAR could continue trading sideways until stronger buying or selling pressure develops.
Potential Price Targets
The analysis identifies several potential levels if HBAR maintains bullish momentum:
$0.0840 — near-term upside target$0.1099 — medium-term target$0.1389 — higher resistance/target$0.1850 — important mid-term milestone~$0.21 — broader macro target
A move toward $0.70 would represent a much more aggressive scenario and would require a substantial expansion in market capitalization and demand. It should therefore be viewed as a highly speculative long-term possibility rather than a base-case prediction.
Bullish Factors
Several factors could support HBAR over the long term:
1. Enterprise Adoption
Hedera's institutional partnerships could increase real-world network usage.
2. Growing Network Activity
Increasing transaction counts and on-chain volume provide evidence of expanding activity.
3. Institutional Interest
ETF-related demand could potentially improve liquidity and institutional exposure.
4. AI Infrastructure
Hedera's focus on verifiable AI could open new applications beyond traditional blockchain use cases.
5. EVM Compatibility
Compatibility with Ethereum-based development can make it easier for developers to build or migrate applications to Hedera.
Key Risks
HBAR also carries significant risks.
Market Volatility: Cryptocurrency prices can move sharply in either direction.
Competition: Hedera competes with numerous blockchain networks offering smart contracts, tokenization, payments, and enterprise solutions.
Weak Trend Strength: The low ADX suggests that the current market trend is not particularly strong.
Token Supply: Investors should continue monitoring future HBAR releases and their potential effect on supply and price.
Distance From ATH: Although being far below its ATH can create perceived upside potential, it does not guarantee that HBAR will return to its previous high.
Long-Term Outlook
The long-term HBAR investment thesis is primarily based on utility rather than speculation.
If Hedera continues increasing enterprise adoption, network activity, institutional participation, tokenization use cases, and AI-related applications, demand for the network could potentially increase over time.
From a technical perspective, $0.0719 is an important level to watch. A sustained move above this area could strengthen the bullish structure, while failure to hold major support around $0.065–$0.068 would weaken the setup.
The larger targets around $0.1099, $0.1389, $0.1850, and $0.21 should be considered potential scenarios rather than guaranteed outcomes.
Final Verdict
HBAR presents an interesting long-term cryptocurrency thesis because Hedera combines enterprise partnerships, high-throughput technology, tokenization capabilities, EVM compatibility, and growing network activity.
However, HBAR remains a volatile crypto asset, and its future performance will depend heavily on actual adoption, market conditions, competition, token supply dynamics, and broader crypto liquidity.
For long-term investors, the key factors to monitor are network usage, institutional adoption, ETF flows, token releases, Bitcoin's market trend, and HBAR's ability to establish higher highs and higher lows.
Bottom line: HBAR has a potentially strong long-term fundamental story, but investors should treat price targets as scenarios—not guarantees—and use proper risk management before taking a position.
$HBAR
{spot}(HBARUSDT)
#HBARUSDT #HBARPrice #nextpump #NextCryptoMillionaire
HBAR: The Next Big Crypto Opportunity?
Hedera ($HBAR ) is attracting renewed attention as an enterprise-focused blockchain with growing network activity, institutional partnerships, and potential applications in payments, tokenization, identity, and verifiable AI infrastructure.
Current Market Overview
As of September 9, 2026, HBAR is trading around $0.0787, with a market capitalization of approximately $3.46 billion and around 43.83 billion HBAR in circulation.
HBAR remains significantly below its all-time high of approximately $0.56, reached in September 2021. At current levels, the token is roughly 86% below that historical peak.
Despite this long-term decline from its ATH, HBAR has shown positive performance during 2026, with the Messari analysis reporting approximately 21.82% year-to-date growth.
Strong Network Activity
One of the most encouraging developments is the growth in Hedera's network activity.
On September 3, Hedera processed approximately 593,000 unique transactions, representing its highest daily count in more than a month. The analysis also reported a 56% weekly increase in on-chain volume.
Growing transaction activity can be important for a long-term investment thesis because it indicates that the network is being used rather than relying entirely on speculative trading.
Enterprise Adoption
Hedera's strongest differentiator is its focus on enterprise and institutional use cases.
Several developments highlighted in the Messari analysis include:
WISeKey and SpaceDev joining the Hedera Governing Council.Taurus offering the Hedera technology stack to more than 40 banks.Hedera participating in Mastercard's crypto partner program.Increasing institutional interest through the spot HBAR ETF.Expansion into areas such as cybersecurity, identity, carbon tracking, and financial infrastructure.
If these partnerships translate into meaningful real-world usage, they could become an important long-term catalyst for HBAR.
Hedera Technology
Hedera uses the Hashgraph consensus algorithm rather than a traditional blockchain architecture.
The network is designed around several important characteristics:
High transaction throughputFast finalityLow transaction costsFair transaction orderingProof-of-Stake securityEVM compatibilityTokenization and smart-contract capabilities
Hedera also provides services for tokenization, consensus, and decentralized applications. Its growing focus on verifiable AI infrastructure could potentially create additional use cases as the AI and blockchain sectors increasingly overlap.
HBAR Tokenomics
HBAR has a maximum supply of 50 billion tokens, with approximately 43.8 billion currently circulating.
The relatively high circulating supply means that investors should continue monitoring future token releases and supply dynamics.
Controlled supply releases can create selling pressure if new tokens enter the market faster than demand grows. Therefore, network adoption and demand growth will remain important for HBAR's long-term valuation.
Technical Analysis
Several important technical levels were highlighted in the Messari analysis.
Support Levels
$0.0670–$0.0688: Immediate support zone$0.0651–$0.0660: Stronger support zone
A sustained breakdown below these areas could weaken the bullish setup.
Resistance Levels
$0.0690–$0.0705: Immediate resistance$0.0719: Important breakout confirmation level$0.177–$0.199: Major longer-term resistance zone
A daily close above $0.0719 was identified as an important technical confirmation for stronger bullish momentum.
Momentum Indicators
The technical picture is currently mixed rather than strongly bullish.
The analysis places the RSI around 48–50, indicating relatively neutral momentum.
The MACD has shown a recent bullish crossover, while Chaikin Money Flow around 0.11 suggests positive buying pressure.
However, the relatively low ADX indicates that trend strength remains weak. This means HBAR could continue trading sideways until stronger buying or selling pressure develops.
Potential Price Targets
The analysis identifies several potential levels if HBAR maintains bullish momentum:
$0.0840 — near-term upside target$0.1099 — medium-term target$0.1389 — higher resistance/target$0.1850 — important mid-term milestone~$0.21 — broader macro target
A move toward $0.70 would represent a much more aggressive scenario and would require a substantial expansion in market capitalization and demand. It should therefore be viewed as a highly speculative long-term possibility rather than a base-case prediction.
Bullish Factors
Several factors could support HBAR over the long term:
1. Enterprise Adoption
Hedera's institutional partnerships could increase real-world network usage.
2. Growing Network Activity
Increasing transaction counts and on-chain volume provide evidence of expanding activity.
3. Institutional Interest
ETF-related demand could potentially improve liquidity and institutional exposure.
4. AI Infrastructure
Hedera's focus on verifiable AI could open new applications beyond traditional blockchain use cases.
5. EVM Compatibility
Compatibility with Ethereum-based development can make it easier for developers to build or migrate applications to Hedera.
Key Risks
HBAR also carries significant risks.
Market Volatility: Cryptocurrency prices can move sharply in either direction.
Competition: Hedera competes with numerous blockchain networks offering smart contracts, tokenization, payments, and enterprise solutions.
Weak Trend Strength: The low ADX suggests that the current market trend is not particularly strong.
Token Supply: Investors should continue monitoring future HBAR releases and their potential effect on supply and price.
Distance From ATH: Although being far below its ATH can create perceived upside potential, it does not guarantee that HBAR will return to its previous high.
Long-Term Outlook
The long-term HBAR investment thesis is primarily based on utility rather than speculation.
If Hedera continues increasing enterprise adoption, network activity, institutional participation, tokenization use cases, and AI-related applications, demand for the network could potentially increase over time.
From a technical perspective, $0.0719 is an important level to watch. A sustained move above this area could strengthen the bullish structure, while failure to hold major support around $0.065–$0.068 would weaken the setup.
The larger targets around $0.1099, $0.1389, $0.1850, and $0.21 should be considered potential scenarios rather than guaranteed outcomes.
Final Verdict
HBAR presents an interesting long-term cryptocurrency thesis because Hedera combines enterprise partnerships, high-throughput technology, tokenization capabilities, EVM compatibility, and growing network activity.
However, HBAR remains a volatile crypto asset, and its future performance will depend heavily on actual adoption, market conditions, competition, token supply dynamics, and broader crypto liquidity.
For long-term investors, the key factors to monitor are network usage, institutional adoption, ETF flows, token releases, Bitcoin's market trend, and HBAR's ability to establish higher highs and higher lows.
Bottom line: HBAR has a potentially strong long-term fundamental story, but investors should treat price targets as scenarios—not guarantees—and use proper risk management before taking a position.
$HBAR
#HBARUSDT #HBARPrice #nextpump #NextCryptoMillionaire
Current Market Overview
As of September 9, 2026, HBAR is trading around $0.0787, with a market capitalization of approximately $3.46 billion and around 43.83 billion HBAR in circulation.
HBAR remains significantly below its all-time high of approximately $0.56, reached in September 2021. At current levels, the token is roughly 86% below that historical peak.
Despite this long-term decline from its ATH, HBAR has shown positive performance during 2026, with the Messari analysis reporting approximately 21.82% year-to-date growth.
Strong Network Activity
One of the most encouraging developments is the growth in Hedera's network activity.
On September 3, Hedera processed approximately 593,000 unique transactions, representing its highest daily count in more than a month. The analysis also reported a 56% weekly increase in on-chain volume.
Growing transaction activity can be important for a long-term investment thesis because it indicates that the network is being used rather than relying entirely on speculative trading.
Enterprise Adoption
Hedera's strongest differentiator is its focus on enterprise and institutional use cases.
Several developments highlighted in the Messari analysis include:
WISeKey and SpaceDev joining the Hedera Governing Council.Taurus offering the Hedera technology stack to more than 40 banks.Hedera participating in Mastercard's crypto partner program.Increasing institutional interest through the spot HBAR ETF.Expansion into areas such as cybersecurity, identity, carbon tracking, and financial infrastructure.
If these partnerships translate into meaningful real-world usage, they could become an important long-term catalyst for HBAR.
Hedera Technology
Hedera uses the Hashgraph consensus algorithm rather than a traditional blockchain architecture.
The network is designed around several important characteristics:
High transaction throughputFast finalityLow transaction costsFair transaction orderingProof-of-Stake securityEVM compatibilityTokenization and smart-contract capabilities
Hedera also provides services for tokenization, consensus, and decentralized applications. Its growing focus on verifiable AI infrastructure could potentially create additional use cases as the AI and blockchain sectors increasingly overlap.
HBAR Tokenomics
HBAR has a maximum supply of 50 billion tokens, with approximately 43.8 billion currently circulating.
The relatively high circulating supply means that investors should continue monitoring future token releases and supply dynamics.
Controlled supply releases can create selling pressure if new tokens enter the market faster than demand grows. Therefore, network adoption and demand growth will remain important for HBAR's long-term valuation.
Technical Analysis
Several important technical levels were highlighted in the Messari analysis.
Support Levels
$0.0670–$0.0688: Immediate support zone$0.0651–$0.0660: Stronger support zone
A sustained breakdown below these areas could weaken the bullish setup.
Resistance Levels
$0.0690–$0.0705: Immediate resistance$0.0719: Important breakout confirmation level$0.177–$0.199: Major longer-term resistance zone
A daily close above $0.0719 was identified as an important technical confirmation for stronger bullish momentum.
Momentum Indicators
The technical picture is currently mixed rather than strongly bullish.
The analysis places the RSI around 48–50, indicating relatively neutral momentum.
The MACD has shown a recent bullish crossover, while Chaikin Money Flow around 0.11 suggests positive buying pressure.
However, the relatively low ADX indicates that trend strength remains weak. This means HBAR could continue trading sideways until stronger buying or selling pressure develops.
Potential Price Targets
The analysis identifies several potential levels if HBAR maintains bullish momentum:
$0.0840 — near-term upside target$0.1099 — medium-term target$0.1389 — higher resistance/target$0.1850 — important mid-term milestone~$0.21 — broader macro target
A move toward $0.70 would represent a much more aggressive scenario and would require a substantial expansion in market capitalization and demand. It should therefore be viewed as a highly speculative long-term possibility rather than a base-case prediction.
Bullish Factors
Several factors could support HBAR over the long term:
1. Enterprise Adoption
Hedera's institutional partnerships could increase real-world network usage.
2. Growing Network Activity
Increasing transaction counts and on-chain volume provide evidence of expanding activity.
3. Institutional Interest
ETF-related demand could potentially improve liquidity and institutional exposure.
4. AI Infrastructure
Hedera's focus on verifiable AI could open new applications beyond traditional blockchain use cases.
5. EVM Compatibility
Compatibility with Ethereum-based development can make it easier for developers to build or migrate applications to Hedera.
Key Risks
HBAR also carries significant risks.
Market Volatility: Cryptocurrency prices can move sharply in either direction.
Competition: Hedera competes with numerous blockchain networks offering smart contracts, tokenization, payments, and enterprise solutions.
Weak Trend Strength: The low ADX suggests that the current market trend is not particularly strong.
Token Supply: Investors should continue monitoring future HBAR releases and their potential effect on supply and price.
Distance From ATH: Although being far below its ATH can create perceived upside potential, it does not guarantee that HBAR will return to its previous high.
Long-Term Outlook
The long-term HBAR investment thesis is primarily based on utility rather than speculation.
If Hedera continues increasing enterprise adoption, network activity, institutional participation, tokenization use cases, and AI-related applications, demand for the network could potentially increase over time.
From a technical perspective, $0.0719 is an important level to watch. A sustained move above this area could strengthen the bullish structure, while failure to hold major support around $0.065–$0.068 would weaken the setup.
The larger targets around $0.1099, $0.1389, $0.1850, and $0.21 should be considered potential scenarios rather than guaranteed outcomes.
Final Verdict
HBAR presents an interesting long-term cryptocurrency thesis because Hedera combines enterprise partnerships, high-throughput technology, tokenization capabilities, EVM compatibility, and growing network activity.
However, HBAR remains a volatile crypto asset, and its future performance will depend heavily on actual adoption, market conditions, competition, token supply dynamics, and broader crypto liquidity.
For long-term investors, the key factors to monitor are network usage, institutional adoption, ETF flows, token releases, Bitcoin's market trend, and HBAR's ability to establish higher highs and higher lows.
Bottom line: HBAR has a potentially strong long-term fundamental story, but investors should treat price targets as scenarios—not guarantees—and use proper risk management before taking a position.
$HBAR
#HBARUSDT #HBARPrice #nextpump #NextCryptoMillionaire
1
98

·
--
$HBAR
{future}(HBARUSDT)
🟩 LONG
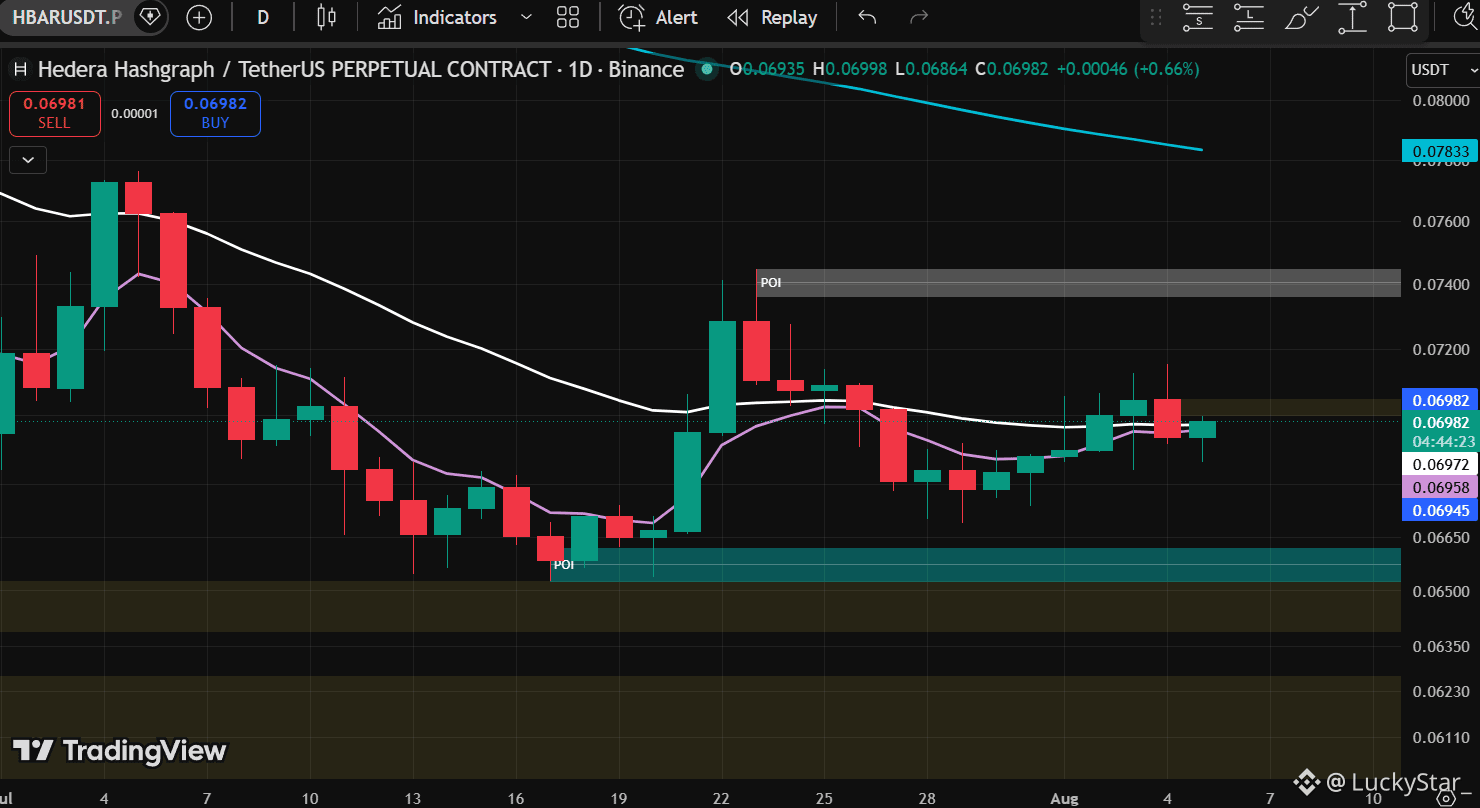
Entry: 0.0690–0.0700USDT
Stop-loss: 0.0660USDT
Take-profits:
1️⃣ 0.0725USDT
2️⃣ 0.0740USDT
3️⃣ 0.0780USDT
#hbar #HBARUSD #HBARPrice
$HBAR
🟩 LONG
Entry: 0.0690–0.0700USDT
Stop-loss: 0.0660USDT
Take-profits:
1️⃣ 0.0725USDT
2️⃣ 0.0740USDT
3️⃣ 0.0780USDT
#hbar #HBARUSD #HBARPrice
🟩 LONG
Entry: 0.0690–0.0700USDT
Stop-loss: 0.0660USDT
Take-profits:
1️⃣ 0.0725USDT
2️⃣ 0.0740USDT
3️⃣ 0.0780USDT
#hbar #HBARUSD #HBARPrice
51

·
--
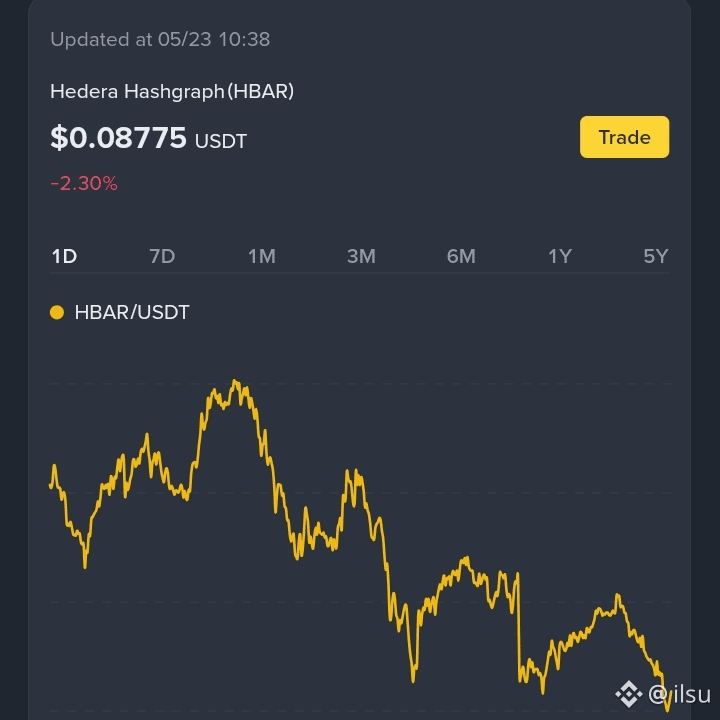
HBAR (HBAR/USDT) is trading at $0.08775 right now, down ~2.39% over the last 24h (open $0.08990).
24h range: low $0.08749 → high $0.09101.
$HBAR
{spot}(HBARUSDT)
#hbar #HBARUSD #HBARPrice
HBAR (HBAR/USDT) is trading at $0.08775 right now, down ~2.39% over the last 24h (open $0.08990).
24h range: low $0.08749 → high $0.09101.
$HBAR
#hbar #HBARUSD #HBARPrice
24h range: low $0.08749 → high $0.09101.
$HBAR
#hbar #HBARUSD #HBARPrice
105

$HBAR Outlook
Hedera (HBAR) remains one of the stronger enterprise-focused blockchain projects, backed by major organizations through the Hedera Governing Council.
Bullish Factors
Fast and low-cost transactions.
Growing enterprise adoption and real-world use cases.
Strong partnerships supporting long-term growth.
Bearish Factors
HBAR is still highly dependent on overall crypto market sentiment.
Competition from other smart-contract platforms remains intense.
Short-term price movements can be volatile.
Technical View
Support: Previous swing lows.
Resistance: Recent local highs.
Bias: 🟢 Moderately Bullish long term, 🟡 Neutral short term.
Summary
HBAR has solid fundamentals and enterprise backing, making it attractive for long-term investors. If the broader crypto market remains strong, HBAR could continue its recovery trend, but traders should watch key support levels closely.
#NEARRises22.2% #HBARPrice #TradebStocks
{spot}(HBARUSDT)
$HBAR Outlook
Hedera (HBAR) remains one of the stronger enterprise-focused blockchain projects, backed by major organizations through the Hedera Governing Council.
Bullish Factors
Fast and low-cost transactions.
Growing enterprise adoption and real-world use cases.
Strong partnerships supporting long-term growth.
Bearish Factors
HBAR is still highly dependent on overall crypto market sentiment.
Competition from other smart-contract platforms remains intense.
Short-term price movements can be volatile.
Technical View
Support: Previous swing lows.
Resistance: Recent local highs.
Bias: 🟢 Moderately Bullish long term, 🟡 Neutral short term.
Summary
HBAR has solid fundamentals and enterprise backing, making it attractive for long-term investors. If the broader crypto market remains strong, HBAR could continue its recovery trend, but traders should watch key support levels closely.
#NEARRises22.2% #HBARPrice #TradebStocks
Hedera (HBAR) remains one of the stronger enterprise-focused blockchain projects, backed by major organizations through the Hedera Governing Council.
Bullish Factors
Fast and low-cost transactions.
Growing enterprise adoption and real-world use cases.
Strong partnerships supporting long-term growth.
Bearish Factors
HBAR is still highly dependent on overall crypto market sentiment.
Competition from other smart-contract platforms remains intense.
Short-term price movements can be volatile.
Technical View
Support: Previous swing lows.
Resistance: Recent local highs.
Bias: 🟢 Moderately Bullish long term, 🟡 Neutral short term.
Summary
HBAR has solid fundamentals and enterprise backing, making it attractive for long-term investors. If the broader crypto market remains strong, HBAR could continue its recovery trend, but traders should watch key support levels closely.
#NEARRises22.2% #HBARPrice #TradebStocks

101

·
--
Bullish
📈 HBAR DAILY CHART UPDATE — BULLISH STRUCTURE STILL ACTIVE 📈
{spot}(HBARUSDT)
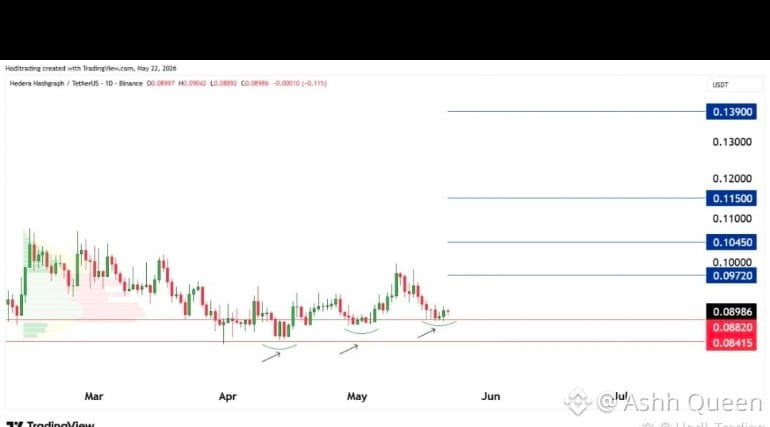
$HBAR continues to show strong price behavior on the daily time frame after successfully reaching the first projected target. The market structure remains positive as the coin keeps printing higher lows, which is usually a sign that buyers are still protecting the trend. As long as the price stays above the important support zone at $0.08820, the next major upside target remains near $0.09720.
📊 Key Trading Levels:
• Main Support Zone: $0.08820
• Strong Resistance Area: $0.09720
• Bullish Breakout Target: Above $0.10000
• Short-Term Entry Zone: Near support after confirmation
• Mid-Term Entry Zone: Above resistance breakout
• Protective Stop Loss: Below $0.08680
• Bearish Risk Area: Below $0.08820
From a technical perspective, HBAR is slowly building momentum while maintaining a healthy market structure. Buyers are stepping in during dips, which is helping the coin create stable higher lows on the daily chart. If the current support level continues holding, traders may see another strong push toward higher resistance zones in the coming sessions.
However, traders should also remain careful because losing the $0.08820 support level may weaken the bullish setup and trigger a correction move toward the $0.08415 area. This is why proper risk management is extremely important. Smart traders focus on confirmed entries, controlled leverage, and disciplined stop losses instead of emotional trades.
⚡ Professional Trading Strategy:
• Buy near support only after bullish confirmation
• Secure partial profits near resistance levels
• Use tight risk management during volatility
• Avoid chasing candles after sudden pumps
• Watch volume closely for breakout confirmation
HBAR is currently trading in an important technical zone where patience can create strong trading opportunities. If momentum continues building above support, the coin may continue its bullish recovery and attract fresh buying pressure across the market.
#HBARPrice #BitmineIncludedInRussell3000
📈 HBAR DAILY CHART UPDATE — BULLISH STRUCTURE STILL ACTIVE 📈
$HBAR continues to show strong price behavior on the daily time frame after successfully reaching the first projected target. The market structure remains positive as the coin keeps printing higher lows, which is usually a sign that buyers are still protecting the trend. As long as the price stays above the important support zone at $0.08820, the next major upside target remains near $0.09720.
📊 Key Trading Levels:
• Main Support Zone: $0.08820
• Strong Resistance Area: $0.09720
• Bullish Breakout Target: Above $0.10000
• Short-Term Entry Zone: Near support after confirmation
• Mid-Term Entry Zone: Above resistance breakout
• Protective Stop Loss: Below $0.08680
• Bearish Risk Area: Below $0.08820
From a technical perspective, HBAR is slowly building momentum while maintaining a healthy market structure. Buyers are stepping in during dips, which is helping the coin create stable higher lows on the daily chart. If the current support level continues holding, traders may see another strong push toward higher resistance zones in the coming sessions.
However, traders should also remain careful because losing the $0.08820 support level may weaken the bullish setup and trigger a correction move toward the $0.08415 area. This is why proper risk management is extremely important. Smart traders focus on confirmed entries, controlled leverage, and disciplined stop losses instead of emotional trades.
⚡ Professional Trading Strategy:
• Buy near support only after bullish confirmation
• Secure partial profits near resistance levels
• Use tight risk management during volatility
• Avoid chasing candles after sudden pumps
• Watch volume closely for breakout confirmation
HBAR is currently trading in an important technical zone where patience can create strong trading opportunities. If momentum continues building above support, the coin may continue its bullish recovery and attract fresh buying pressure across the market.
#HBARPrice #BitmineIncludedInRussell3000
$HBAR continues to show strong price behavior on the daily time frame after successfully reaching the first projected target. The market structure remains positive as the coin keeps printing higher lows, which is usually a sign that buyers are still protecting the trend. As long as the price stays above the important support zone at $0.08820, the next major upside target remains near $0.09720.
📊 Key Trading Levels:
• Main Support Zone: $0.08820
• Strong Resistance Area: $0.09720
• Bullish Breakout Target: Above $0.10000
• Short-Term Entry Zone: Near support after confirmation
• Mid-Term Entry Zone: Above resistance breakout
• Protective Stop Loss: Below $0.08680
• Bearish Risk Area: Below $0.08820
From a technical perspective, HBAR is slowly building momentum while maintaining a healthy market structure. Buyers are stepping in during dips, which is helping the coin create stable higher lows on the daily chart. If the current support level continues holding, traders may see another strong push toward higher resistance zones in the coming sessions.
However, traders should also remain careful because losing the $0.08820 support level may weaken the bullish setup and trigger a correction move toward the $0.08415 area. This is why proper risk management is extremely important. Smart traders focus on confirmed entries, controlled leverage, and disciplined stop losses instead of emotional trades.
⚡ Professional Trading Strategy:
• Buy near support only after bullish confirmation
• Secure partial profits near resistance levels
• Use tight risk management during volatility
• Avoid chasing candles after sudden pumps
• Watch volume closely for breakout confirmation
HBAR is currently trading in an important technical zone where patience can create strong trading opportunities. If momentum continues building above support, the coin may continue its bullish recovery and attract fresh buying pressure across the market.
#HBARPrice #BitmineIncludedInRussell3000
1
84

Article
🚀 HBAR may be in front of an opportunity that the market is still not pricing in.🚀 HBAR may be in front of an opportunity that the market is still not pricing in.
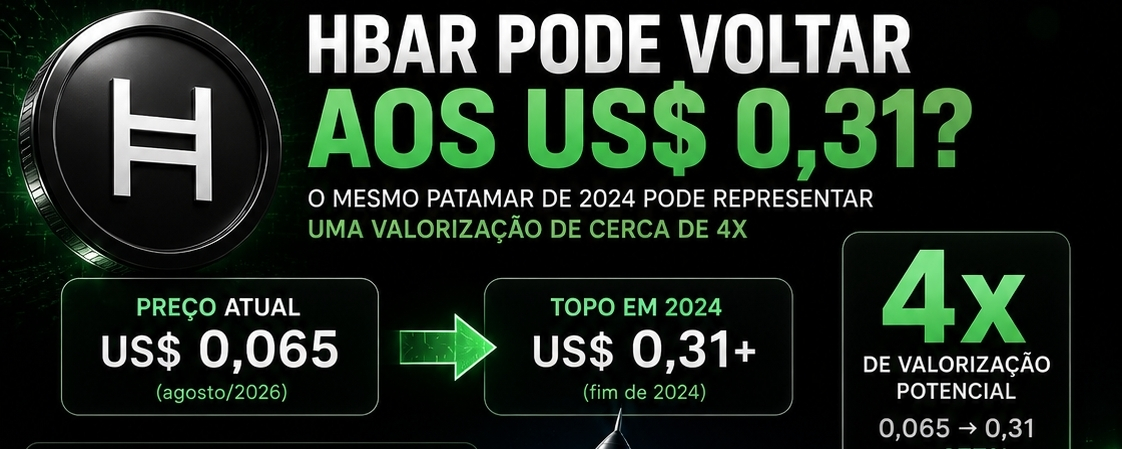
Today, the $HBAR trades near US$ 0.065, but there’s an important detail: at the end of 2024, the cryptocurrency reached above US$ 0.31. 📈
That is, if the asset simply returns to that level, we’d be talking about an appreciation of approximately 4x compared to the current price. 💰🔥
And there’s an important difference compared to that time. 👀
🏦 Hedera’s institutional adoption has advanced;
🚀 HBAR may be in front of an opportunity that the market is still not pricing in.
🚀 HBAR may be in front of an opportunity that the market is still not pricing in.
Today, the $HBAR trades near US$ 0.065, but there’s an important detail: at the end of 2024, the cryptocurrency reached above US$ 0.31. 📈
That is, if the asset simply returns to that level, we’d be talking about an appreciation of approximately 4x compared to the current price. 💰🔥
And there’s an important difference compared to that time. 👀
🏦 Hedera’s institutional adoption has advanced;
Today, the $HBAR trades near US$ 0.065, but there’s an important detail: at the end of 2024, the cryptocurrency reached above US$ 0.31. 📈
That is, if the asset simply returns to that level, we’d be talking about an appreciation of approximately 4x compared to the current price. 💰🔥
And there’s an important difference compared to that time. 👀
🏦 Hedera’s institutional adoption has advanced;
1
751
·
--
Bullish
🚀HBAR/USDTTachnicall Analysis: HBAR Ready for the Next Move? 📈
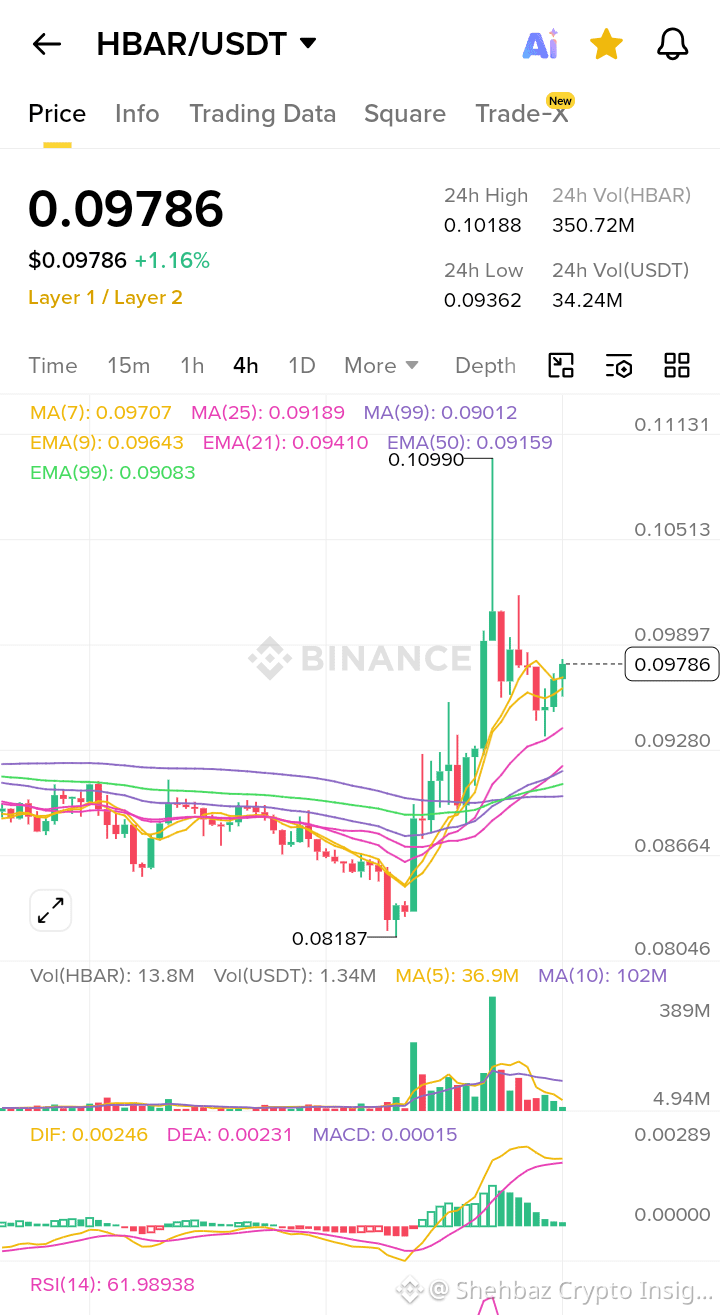
HBAR is showing strong bullish structure on the 4H chart, holding above key moving averages while buyers continue defending higher lows. 🔥
📍 Entry Zone: $0.0960 - $0.0980
🛑 Stop Loss: $0.0920
🎯 Targets:
✅ TP1: $0.1020
✅ TP2: $0.1060
✅ TP3: $0.1100
🟢 Support: $0.0960 | $0.0920 | $0.0890
🔴 Resistance: $0.1020 | $0.1060 | $0.1100
📊 Technical Outlook:
• Price remains above major EMAs and MAs
• MACD stays in bullish territory
• RSI around 62 signals healthy momentum
• A breakout above $0.1020 could open the door toward $0.11+
⚠️ Always manage risk and wait for confirmation before entering a trade.
💬 Question: Will HBAR break $0.102 and rally toward $0.11, or are we about to see a pullback first? 👇
#hbar #HBARPrice #TrumpIranTougherPeaceTerms #XRPLProposalBlocksFlashLoans
$HBAR
{spot}(HBARUSDT)
🚀HBAR/USDTTachnicall Analysis: HBAR Ready for the Next Move? 📈
HBAR is showing strong bullish structure on the 4H chart, holding above key moving averages while buyers continue defending higher lows. 🔥
📍 Entry Zone: $0.0960 - $0.0980
🛑 Stop Loss: $0.0920
🎯 Targets:
✅ TP1: $0.1020
✅ TP2: $0.1060
✅ TP3: $0.1100
🟢 Support: $0.0960 | $0.0920 | $0.0890
🔴 Resistance: $0.1020 | $0.1060 | $0.1100
📊 Technical Outlook:
• Price remains above major EMAs and MAs
• MACD stays in bullish territory
• RSI around 62 signals healthy momentum
• A breakout above $0.1020 could open the door toward $0.11+
⚠️ Always manage risk and wait for confirmation before entering a trade.
💬 Question: Will HBAR break $0.102 and rally toward $0.11, or are we about to see a pullback first? 👇
#hbar #HBARPrice #TrumpIranTougherPeaceTerms #XRPLProposalBlocksFlashLoans
$HBAR
HBAR is showing strong bullish structure on the 4H chart, holding above key moving averages while buyers continue defending higher lows. 🔥
📍 Entry Zone: $0.0960 - $0.0980
🛑 Stop Loss: $0.0920
🎯 Targets:
✅ TP1: $0.1020
✅ TP2: $0.1060
✅ TP3: $0.1100
🟢 Support: $0.0960 | $0.0920 | $0.0890
🔴 Resistance: $0.1020 | $0.1060 | $0.1100
📊 Technical Outlook:
• Price remains above major EMAs and MAs
• MACD stays in bullish territory
• RSI around 62 signals healthy momentum
• A breakout above $0.1020 could open the door toward $0.11+
⚠️ Always manage risk and wait for confirmation before entering a trade.
💬 Question: Will HBAR break $0.102 and rally toward $0.11, or are we about to see a pullback first? 👇
#hbar #HBARPrice #TrumpIranTougherPeaceTerms #XRPLProposalBlocksFlashLoans
$HBAR
1
182

·
--
HBARUSDT
🔥 Volume Spike +20.5x (30m)
1h changes
💵 Price: $0.0867 (+2.2%)
📊 Vol: +$18.5M (+558.2%)
💰 OI: +$639.4K (+2.1%)
⚖️ LSR: 0.75 (+0.0)
🤝 Trades: 147.5K (+625.1%)
$HBAR
{future}(HBARUSDT)
#HBARPrice #crypto #Binance #AsiaLeadsRegulatedCryptoAdoption USIranStrikesSinkBitcoinBelow$73000
HBARUSDT
🔥 Volume Spike +20.5x (30m)
1h changes
💵 Price: $0.0867 (+2.2%)
📊 Vol: +$18.5M (+558.2%)
💰 OI: +$639.4K (+2.1%)
⚖️ LSR: 0.75 (+0.0)
🤝 Trades: 147.5K (+625.1%)
$HBAR
#HBARPrice #crypto #Binance #AsiaLeadsRegulatedCryptoAdoption USIranStrikesSinkBitcoinBelow$73000
🔥 Volume Spike +20.5x (30m)
1h changes
💵 Price: $0.0867 (+2.2%)
📊 Vol: +$18.5M (+558.2%)
💰 OI: +$639.4K (+2.1%)
⚖️ LSR: 0.75 (+0.0)
🤝 Trades: 147.5K (+625.1%)
$HBAR
#HBARPrice #crypto #Binance #AsiaLeadsRegulatedCryptoAdoption USIranStrikesSinkBitcoinBelow$73000
119
·
--
$HBAR
{future}(HBARUSDT)
✅ Bullish Setup
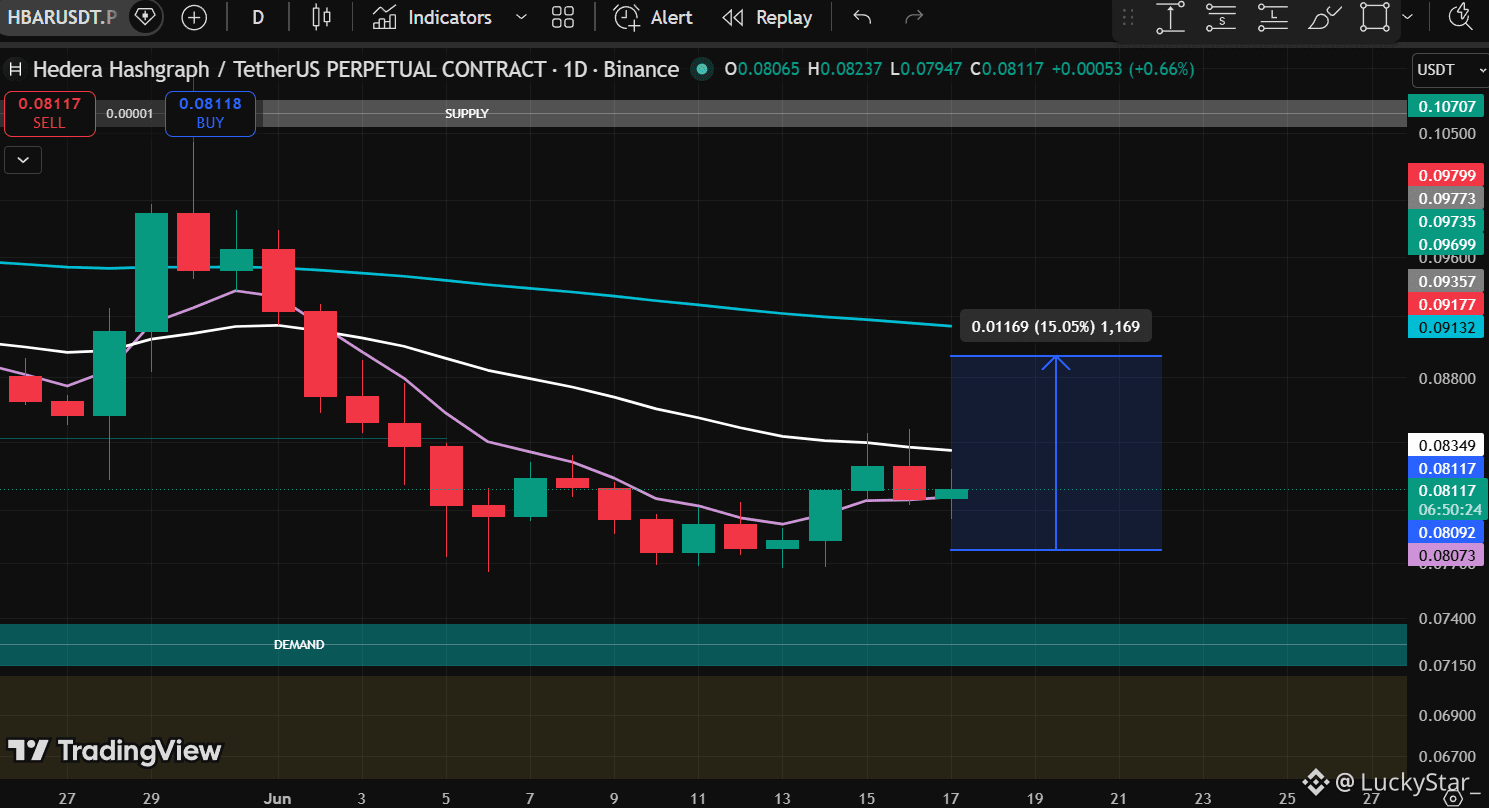
Entry: Near 0.0812 USDT after a bullish candle close above the short‑term MA.
Stop‑loss: Below 0.0800 USDT.
Take‑profit: First target — 0.0917 USDT
#HBARUSDT #HBARPrice #TechnicalAnalysiss
$HBAR
✅ Bullish Setup
Entry: Near 0.0812 USDT after a bullish candle close above the short‑term MA.
Stop‑loss: Below 0.0800 USDT.
Take‑profit: First target — 0.0917 USDT
#HBARUSDT #HBARPrice #TechnicalAnalysiss
✅ Bullish Setup
Entry: Near 0.0812 USDT after a bullish candle close above the short‑term MA.
Stop‑loss: Below 0.0800 USDT.
Take‑profit: First target — 0.0917 USDT
#HBARUSDT #HBARPrice #TechnicalAnalysiss
20

·
--
Bullish
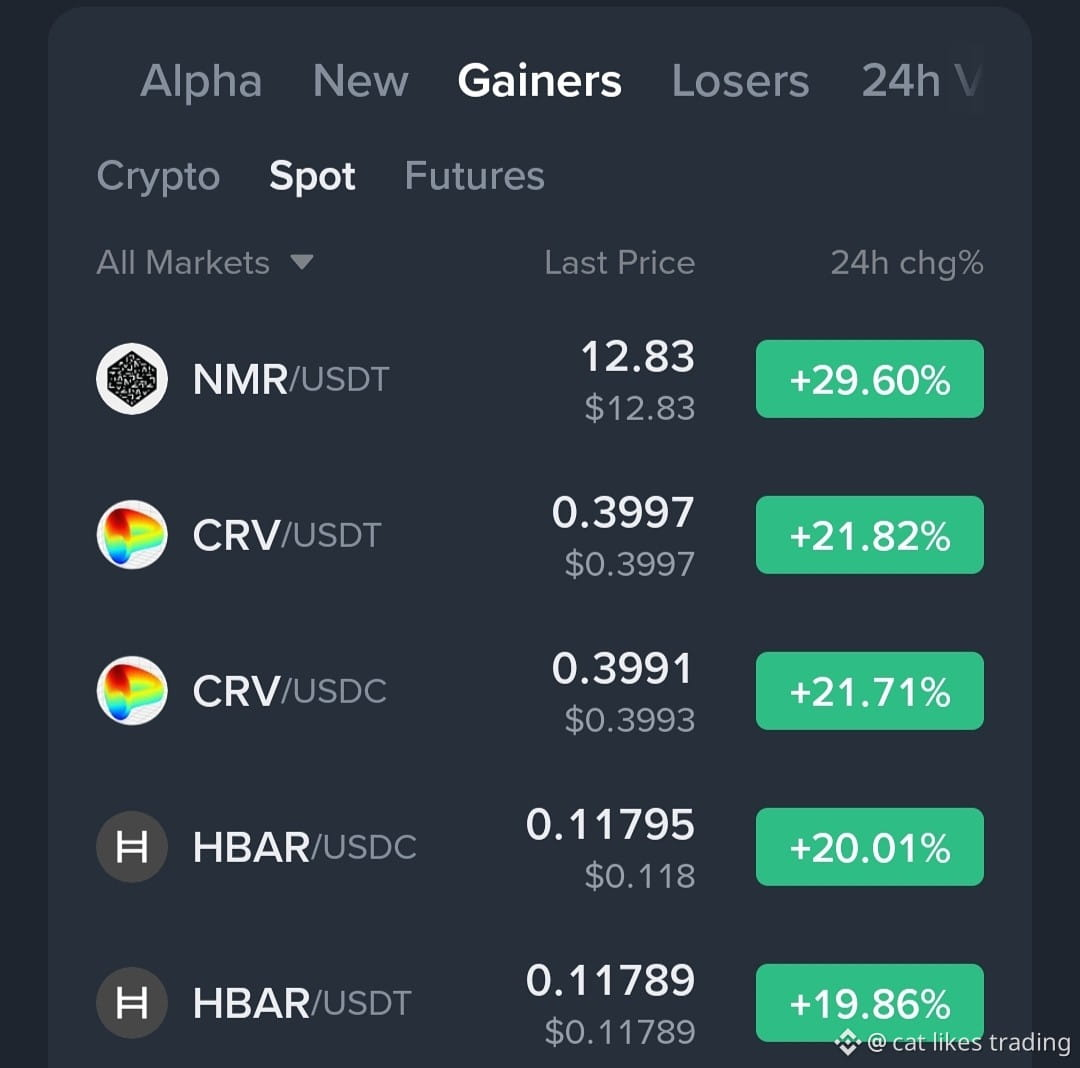
🔥 TODAY’S TOP SPOT GAINERS 🚀
The spot market is heating up! 📈🔥
🥇 $NMR — +29.60%
🥈 $CRV — +21.82%
🔥 HBAR — +20.01%
🔥 $HBAR — +19.86%
💰 Strong momentum across the board!
After these big pumps, volatility can stay high—watch for breakouts, pullbacks, and avoid FOMO entries.
Which one is your top watch today? 👀👇
#Binance #CRV/USDT #HBARPrice #CryptoTrading
🔥 TODAY’S TOP SPOT GAINERS 🚀
The spot market is heating up! 📈🔥
🥇 $NMR — +29.60%
🥈 $CRV — +21.82%
🔥 HBAR — +20.01%
🔥 $HBAR — +19.86%
💰 Strong momentum across the board!
After these big pumps, volatility can stay high—watch for breakouts, pullbacks, and avoid FOMO entries.
Which one is your top watch today? 👀👇
#Binance #CRV/USDT #HBARPrice #CryptoTrading
The spot market is heating up! 📈🔥
🥇 $NMR — +29.60%
🥈 $CRV — +21.82%
🔥 HBAR — +20.01%
🔥 $HBAR — +19.86%
💰 Strong momentum across the board!
After these big pumps, volatility can stay high—watch for breakouts, pullbacks, and avoid FOMO entries.
Which one is your top watch today? 👀👇
#Binance #CRV/USDT #HBARPrice #CryptoTrading
1
76

·
--
Bullish
30



Log in to explore more content
Join global crypto users on Binance Square
⚡️ Get latest and useful information about crypto.
💬 Trusted by the world’s largest crypto exchange.
👍 Discover real insights from verified creators.
Email / Phone number
Trending Topics
1
#MetaMaskExitsLidoValidatorsAfterSecurityIncident
4,670 views
222 Discussing
2
#MicronBeatsEarningsLiftsGuidance
6,987 views
223 Discussing
3
#CFTCSubmitsTwoEventContractRulesToWhiteHouse
7,461 views
225 Discussing
4
#BitcoinClears$85200
25,748 views
286 Discussing
5
#AltcoinSeasonIndexHoldsAbove60For5Days
128,761 views
1,681 Discussing
6
#USADPAdds90000JobsInSeptember
56,599 views
954 Discussing
7
#USCorePCEEasesTo3%InAugust
40,864 views
665 Discussing
8
#KospiPostsWorstQuarterSince2020
23,875 views
570 Discussing
9
#SECToClarifyOnChainFundraisingRules
59,941 views
775 Discussing
10
#UKFCAOpensCryptoFirmAuthorization
55,905 views
633 Discussing