
#ct
ct
319,836 views
3,124 Discussing
Hot
Latest

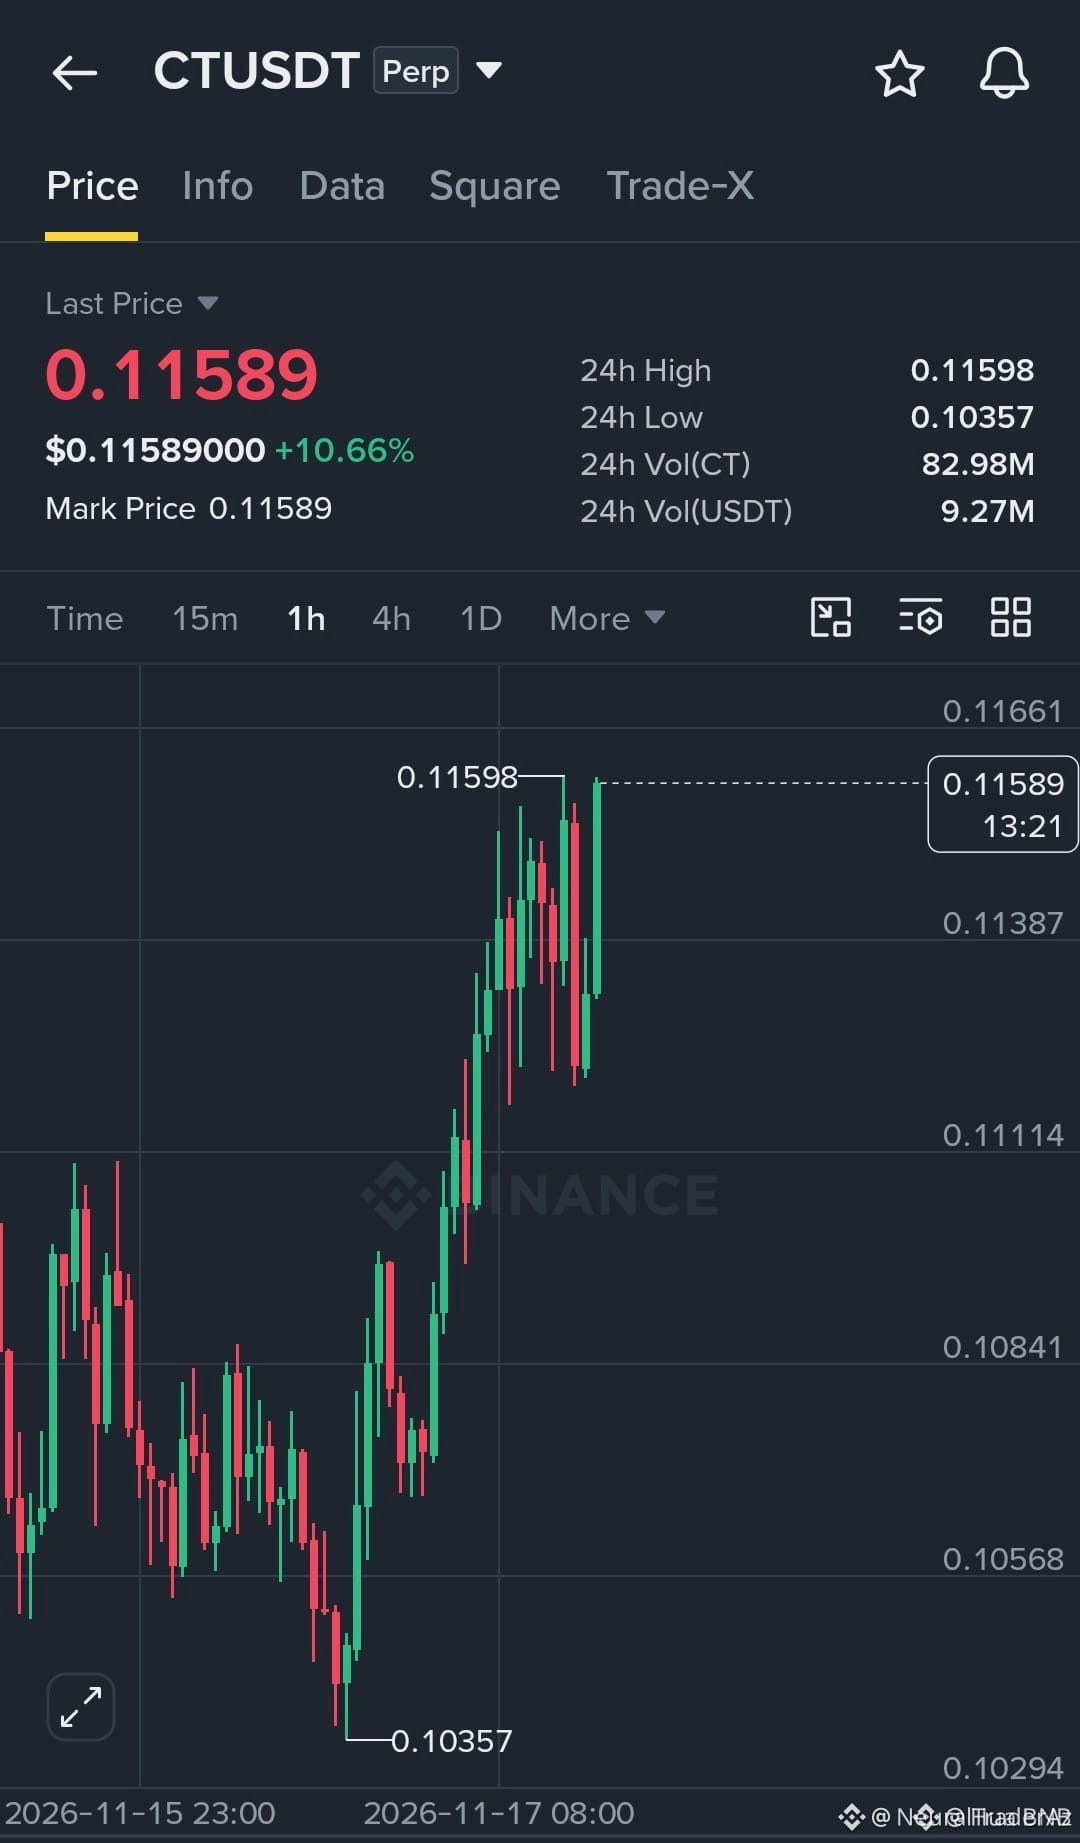
🚨 $CT APPROACHING STRUCTURAL RESISTANCE AFTER A CLEAN INSTITUTIONAL RECOVERY!
Entry: 0.11589 ⚡
Target: 0.1220 🚀
Smart money is leaning heavily into $CT as price sweeps the local range and builds aggressive higher lows on the 1H timeframe. Order flow shows sustained buying pressure absorbing supply right beneath the 0.1160 overhead barrier.
A clean acceptance above this liquidity cluster opens a frictionless path toward the higher distribution targets. Are you positioning ahead of the breakout or waiting for a retest of the 0.1130 demand shelf? 👇
⚠️ Not financial advice. Always manage your risk. 🛡️
🏷️ #CT #Breakout #Crypto #SmartMoney
🔥
🚨 $CT APPROACHING STRUCTURAL RESISTANCE AFTER A CLEAN INSTITUTIONAL RECOVERY!
Entry: 0.11589 ⚡
Target: 0.1220 🚀
Smart money is leaning heavily into $CT as price sweeps the local range and builds aggressive higher lows on the 1H timeframe. Order flow shows sustained buying pressure absorbing supply right beneath the 0.1160 overhead barrier.
A clean acceptance above this liquidity cluster opens a frictionless path toward the higher distribution targets. Are you positioning ahead of the breakout or waiting for a retest of the 0.1130 demand shelf? 👇
⚠️ Not financial advice. Always manage your risk. 🛡️
🏷️ #CT #Breakout #Crypto #SmartMoney
🔥
Entry: 0.11589 ⚡
Target: 0.1220 🚀
Smart money is leaning heavily into $CT as price sweeps the local range and builds aggressive higher lows on the 1H timeframe. Order flow shows sustained buying pressure absorbing supply right beneath the 0.1160 overhead barrier.
A clean acceptance above this liquidity cluster opens a frictionless path toward the higher distribution targets. Are you positioning ahead of the breakout or waiting for a retest of the 0.1130 demand shelf? 👇
⚠️ Not financial advice. Always manage your risk. 🛡️
🏷️ #CT #Breakout #Crypto #SmartMoney
🔥
11

·
--
Bullish
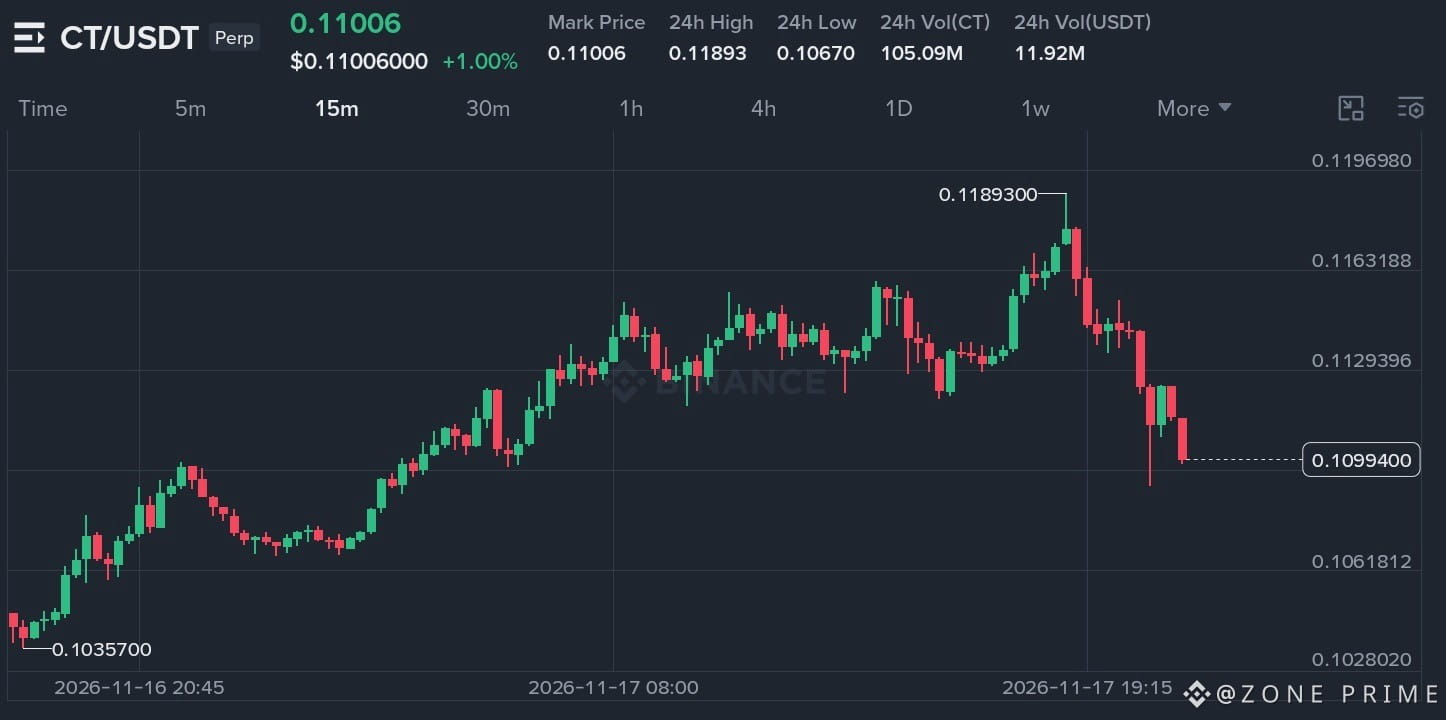
$CT /USDT — LONG SETUP
Entry: 0.10850 - 0.11010
TP1: 0.11300
TP2: 0.11600
TP3: 0.11893
Stop: 0.10600
$CT is pulling back into a major prior breakout shelf near 0.10950 following its sustained advance off the 0.10357 anchor low. Holding this critical demand pocket allows bulls to reload liquidity for a secondary push toward the 0.11893 peak.
#ct #ctusdt #crypto $CT
{future}(CTUSDT)
$CT /USDT — LONG SETUP
Entry: 0.10850 - 0.11010
TP1: 0.11300
TP2: 0.11600
TP3: 0.11893
Stop: 0.10600
$CT is pulling back into a major prior breakout shelf near 0.10950 following its sustained advance off the 0.10357 anchor low. Holding this critical demand pocket allows bulls to reload liquidity for a secondary push toward the 0.11893 peak.
#ct #ctusdt #crypto $CT
Entry: 0.10850 - 0.11010
TP1: 0.11300
TP2: 0.11600
TP3: 0.11893
Stop: 0.10600
$CT is pulling back into a major prior breakout shelf near 0.10950 following its sustained advance off the 0.10357 anchor low. Holding this critical demand pocket allows bulls to reload liquidity for a secondary push toward the 0.11893 peak.
#ct #ctusdt #crypto $CT
2
263

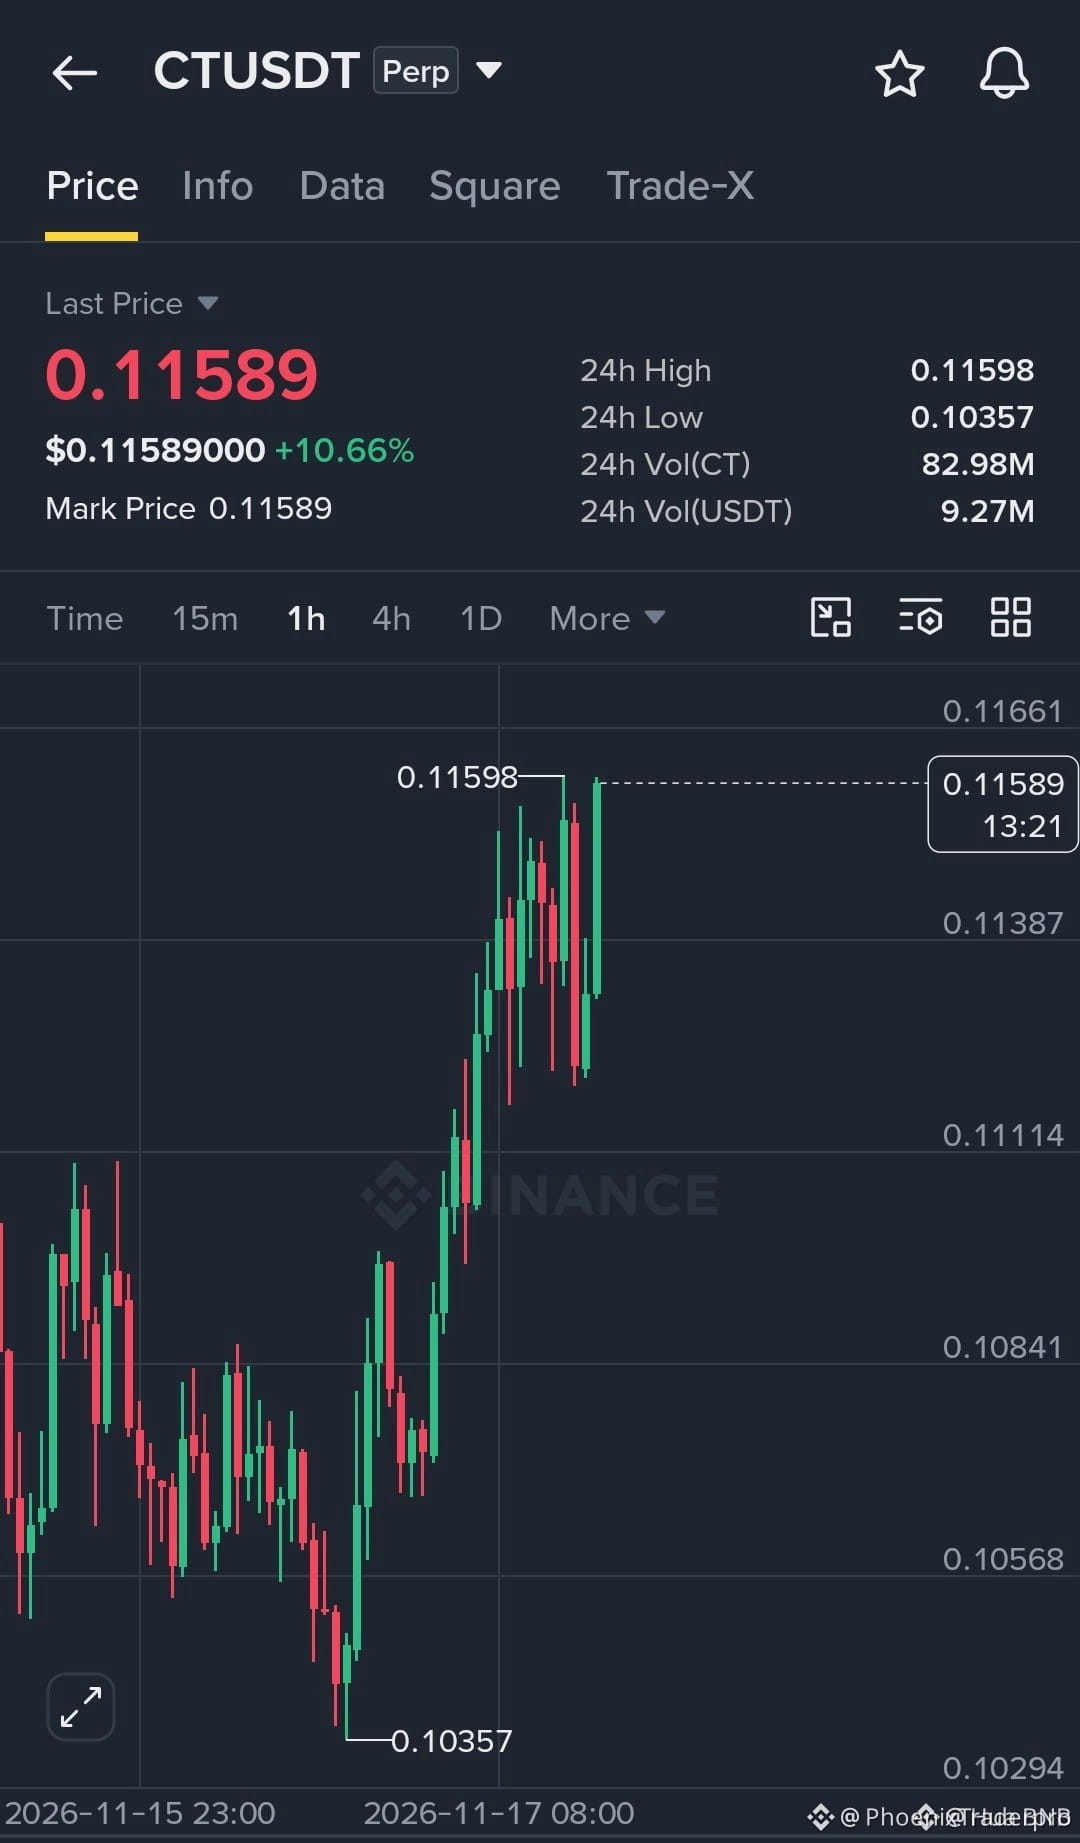
🚨 $CT BATTERING KEY RESISTANCE AS BUYING PRESSURE SURGES TOWARD A NEW LEG UP! 💥
Entry: 0.11589 ⚡
Target: 0.1220 🚀
Bulls are stepping in with serious muscle after a clean reclaim of the lower range, driving a 10 percent surge on heavy intraday volume. The 1H structure is painting textbook higher lows while price hammers directly against the 0.1160 ceiling. 📊
If buyers manage to swallow the remaining sell walls and flip this barrier into support, momentum opens a clear runway toward higher targets. ⚡
💬 Are you ready to catch the breakout confirmation or waiting for a dip back into support? 👇
⚠️ Not financial advice. Always manage your risk. 🛡️
🏷️ #CT #Breakout #Crypto #Momentum
🔥 💎
🚨 $CT BATTERING KEY RESISTANCE AS BUYING PRESSURE SURGES TOWARD A NEW LEG UP! 💥
Entry: 0.11589 ⚡
Target: 0.1220 🚀
Bulls are stepping in with serious muscle after a clean reclaim of the lower range, driving a 10 percent surge on heavy intraday volume. The 1H structure is painting textbook higher lows while price hammers directly against the 0.1160 ceiling. 📊
If buyers manage to swallow the remaining sell walls and flip this barrier into support, momentum opens a clear runway toward higher targets. ⚡
💬 Are you ready to catch the breakout confirmation or waiting for a dip back into support? 👇
⚠️ Not financial advice. Always manage your risk. 🛡️
🏷️ #CT #Breakout #Crypto #Momentum
🔥 💎
Entry: 0.11589 ⚡
Target: 0.1220 🚀
Bulls are stepping in with serious muscle after a clean reclaim of the lower range, driving a 10 percent surge on heavy intraday volume. The 1H structure is painting textbook higher lows while price hammers directly against the 0.1160 ceiling. 📊
If buyers manage to swallow the remaining sell walls and flip this barrier into support, momentum opens a clear runway toward higher targets. ⚡
💬 Are you ready to catch the breakout confirmation or waiting for a dip back into support? 👇
⚠️ Not financial advice. Always manage your risk. 🛡️
🏷️ #CT #Breakout #Crypto #Momentum
🔥 💎
7

·
--
Bullish
🚀 $CT (Concrete): Can It Hit $0.20 Today?
CT is trading around $0.1146 (+7.2%), showing signs of a bullish recovery.
📊 My LONG Setup:
- Entry: $0.110–$0.115
- TP1: $0.125
- TP2: $0.135
- TP3: $0.160
- Final Target: $0.200
- Stop Loss: $0.104
🔥 My View: A breakout above $0.129 with strong volume could open the door toward higher targets. I'm watching for confirmation before entering.
⚠️ $0.20 is an aggressive target, not guaranteed.
Can CT reach $0.20 today? What's your target?
#CT #Concrete #CryptoTrading #Binance $ARIA $PRL
🚀 $CT (Concrete): Can It Hit $0.20 Today?
CT is trading around $0.1146 (+7.2%), showing signs of a bullish recovery.
📊 My LONG Setup:
- Entry: $0.110–$0.115
- TP1: $0.125
- TP2: $0.135
- TP3: $0.160
- Final Target: $0.200
- Stop Loss: $0.104
🔥 My View: A breakout above $0.129 with strong volume could open the door toward higher targets. I'm watching for confirmation before entering.
⚠️ $0.20 is an aggressive target, not guaranteed.
Can CT reach $0.20 today? What's your target?
#CT #Concrete #CryptoTrading #Binance $ARIA $PRL
CT is trading around $0.1146 (+7.2%), showing signs of a bullish recovery.
📊 My LONG Setup:
- Entry: $0.110–$0.115
- TP1: $0.125
- TP2: $0.135
- TP3: $0.160
- Final Target: $0.200
- Stop Loss: $0.104
🔥 My View: A breakout above $0.129 with strong volume could open the door toward higher targets. I'm watching for confirmation before entering.
⚠️ $0.20 is an aggressive target, not guaranteed.
Can CT reach $0.20 today? What's your target?
#CT #Concrete #CryptoTrading #Binance $ARIA $PRL
504

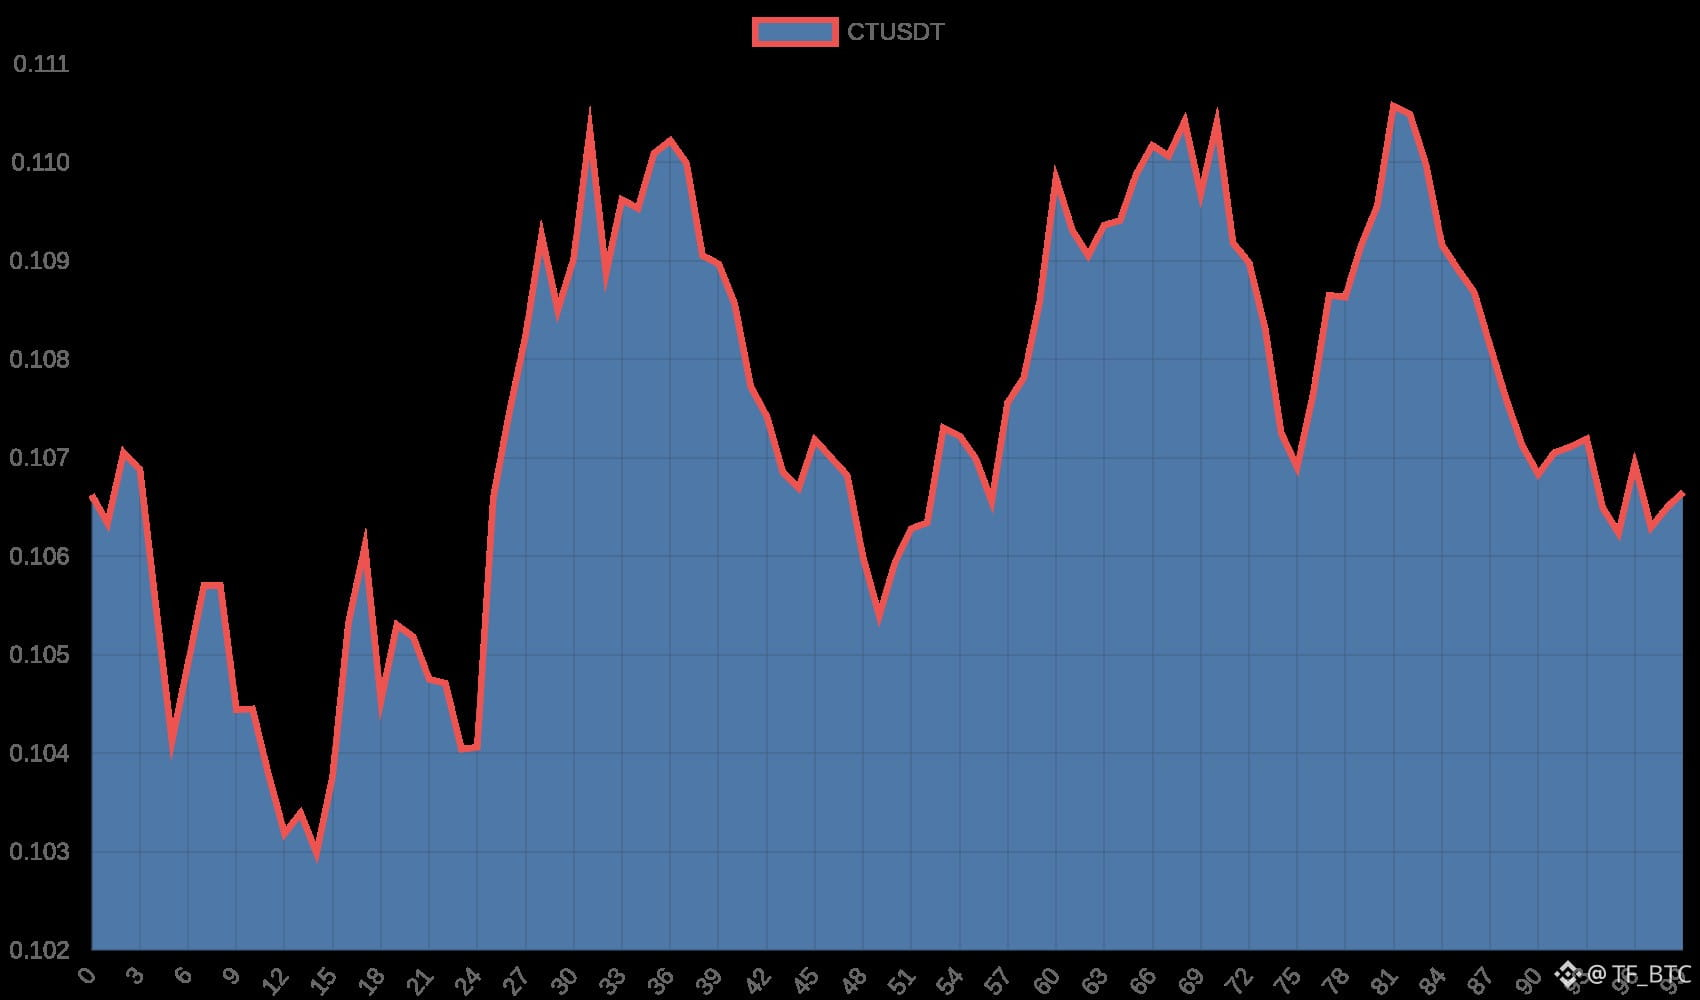

·
--
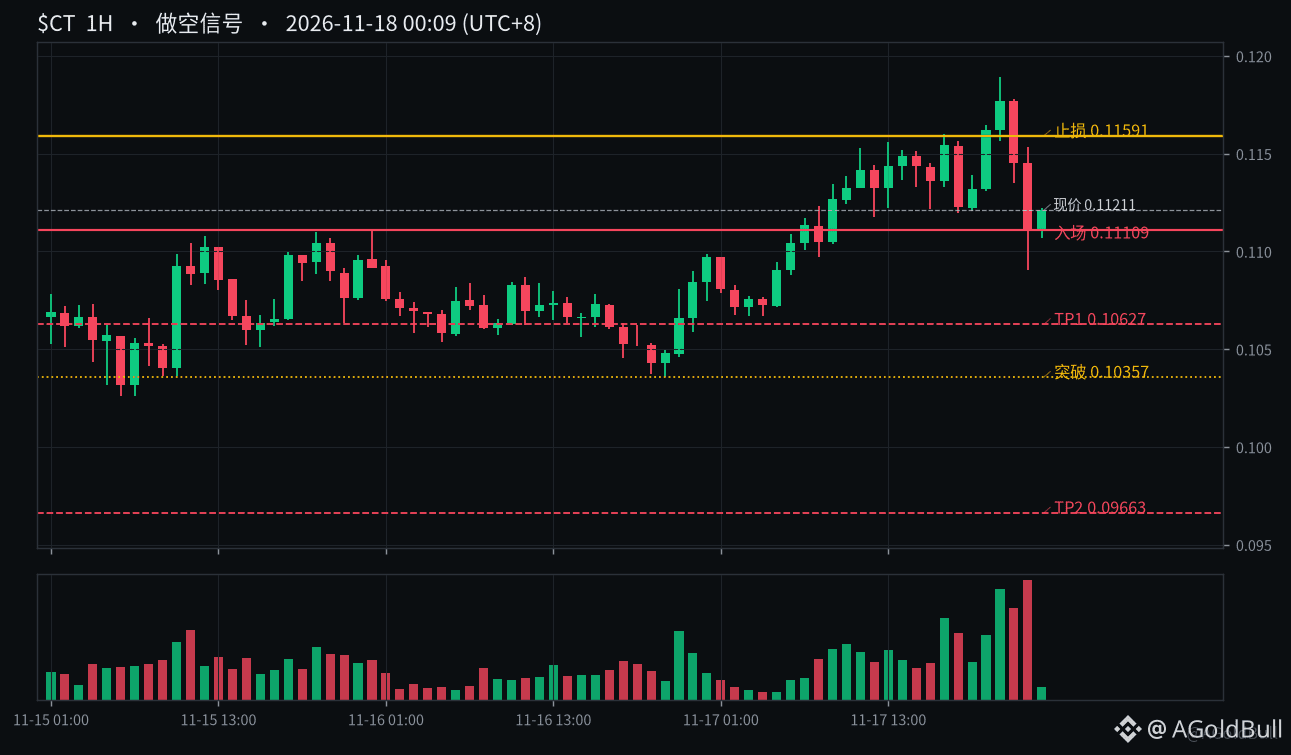
$CT 23:00 High 0.11533, closed at 0.11109, breaking below the breakout level of 0.11385. Volume was about 1.26 million U, roughly 3.05 times the average, with aggressive buying at 44.5%. Open interest in this coin fell by about 5.42%—a clear reduction in positions.
The buyers pushing the price up are already backing off, so I’m going short based on this breakdown.
Short entry price: 0.11109
Stop-loss price: 0.11591
Take-profit prices: TP1 0.10627, TP2 0.09663
Once TP1 is reached, I’ll move the stop-loss to the entry price. $CT The market cap is about 21.18 million. If the price climbs back above 0.11385 within an hour, I’ll close this trade.
#CT #山寨币 #Contract
This is not investment advice
$CT 23:00 High 0.11533, closed at 0.11109, breaking below the breakout level of 0.11385. Volume was about 1.26 million U, roughly 3.05 times the average, with aggressive buying at 44.5%. Open interest in this coin fell by about 5.42%—a clear reduction in positions.
The buyers pushing the price up are already backing off, so I’m going short based on this breakdown.
Short entry price: 0.11109
Stop-loss price: 0.11591
Take-profit prices: TP1 0.10627, TP2 0.09663
Once TP1 is reached, I’ll move the stop-loss to the entry price. $CT The market cap is about 21.18 million. If the price climbs back above 0.11385 within an hour, I’ll close this trade.
#CT #山寨币 #Contract
This is not investment advice
The buyers pushing the price up are already backing off, so I’m going short based on this breakdown.
Short entry price: 0.11109
Stop-loss price: 0.11591
Take-profit prices: TP1 0.10627, TP2 0.09663
Once TP1 is reached, I’ll move the stop-loss to the entry price. $CT The market cap is about 21.18 million. If the price climbs back above 0.11385 within an hour, I’ll close this trade.
#CT #山寨币 #Contract
This is not investment advice
170

·
--
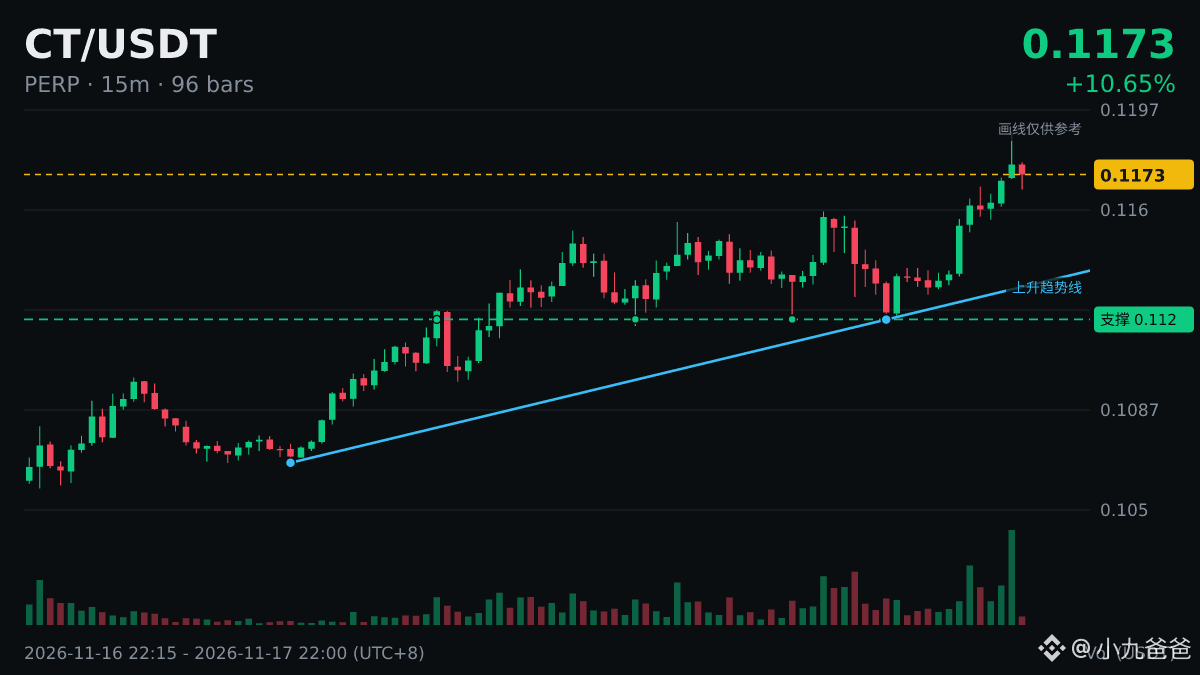
$CT hit a new 7-day high, with determined buying.
Current price: 0.1173, breaking above the previous high of 0.1165, with 24-hour trading volume of $10.59 million.
Short stop-loss orders tend to cluster near new highs, so holding above this level could trigger a short squeeze; however, beware of a pullback after the spike.
#CT
$CT hit a new 7-day high, with determined buying.
Current price: 0.1173, breaking above the previous high of 0.1165, with 24-hour trading volume of $10.59 million.
Short stop-loss orders tend to cluster near new highs, so holding above this level could trigger a short squeeze; however, beware of a pullback after the spike.
#CT
Current price: 0.1173, breaking above the previous high of 0.1165, with 24-hour trading volume of $10.59 million.
Short stop-loss orders tend to cluster near new highs, so holding above this level could trigger a short squeeze; however, beware of a pullback after the spike.
#CT
331

·
--
Just sharing: $CT has hit a new 7-day high at 0.1176. Its previous high was 0.1165.
Whenever a new high is reached, people on the Square always call the top. But strong coins often keep setting new highs after hitting one. I wouldn’t chase it here either; I’ll wait for a pullback that holds above the previous high before considering it.
Do you hold any related coins?
#CT
Just sharing: $CT has hit a new 7-day high at 0.1176. Its previous high was 0.1165.
Whenever a new high is reached, people on the Square always call the top. But strong coins often keep setting new highs after hitting one. I wouldn’t chase it here either; I’ll wait for a pullback that holds above the previous high before considering it.
Do you hold any related coins?
#CT
Whenever a new high is reached, people on the Square always call the top. But strong coins often keep setting new highs after hitting one. I wouldn’t chase it here either; I’ll wait for a pullback that holds above the previous high before considering it.
Do you hold any related coins?
#CT
9

·
--
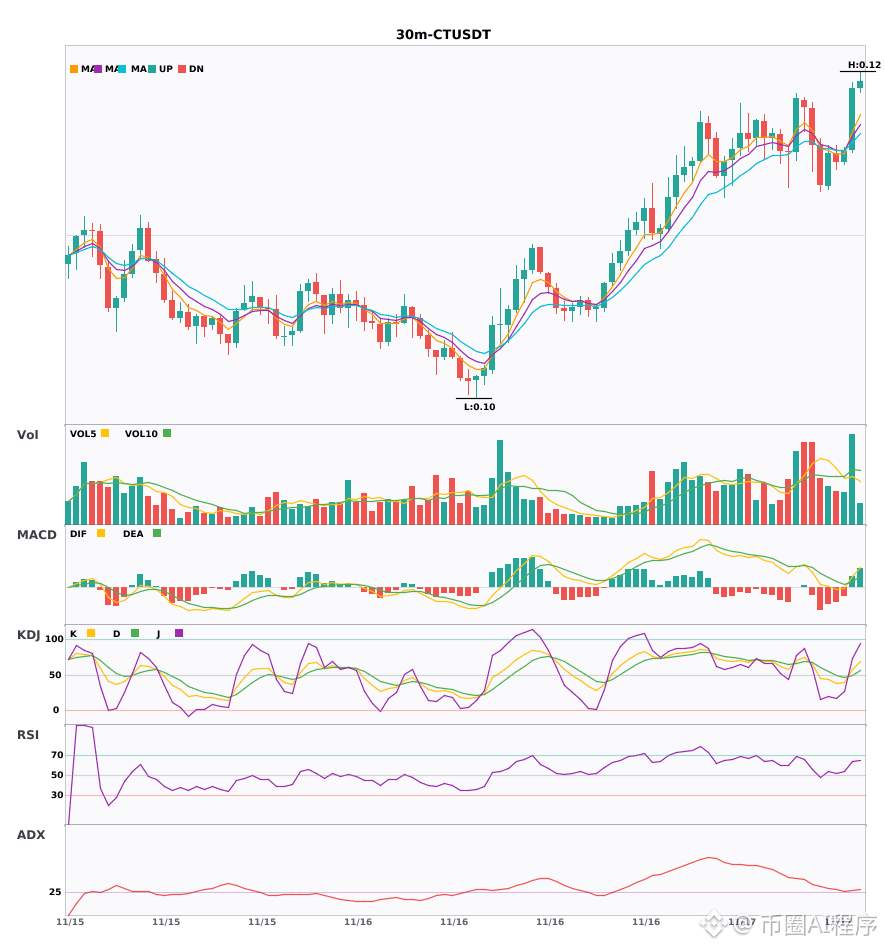
30-minute and 4-hour bullish confluence; trends for 2 coins have just been confirmed 🔥
════════════════════
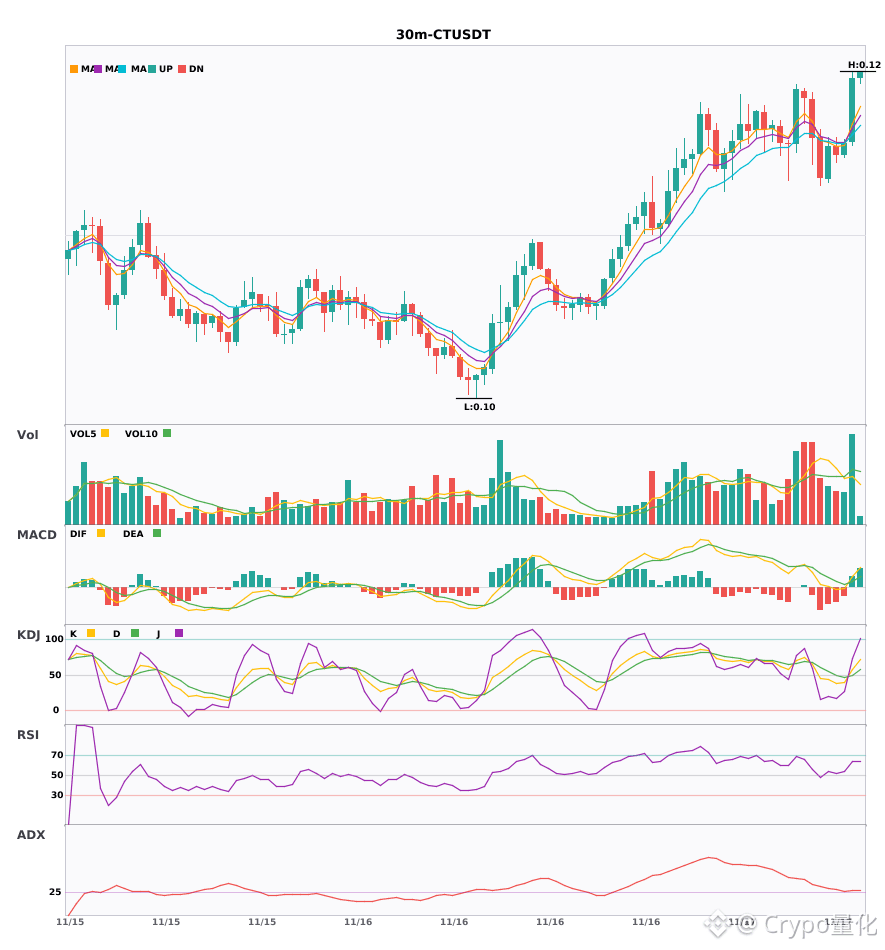
🔴 $CT 30-minute bullish signal
⚠️Technical analysis: 4-hour bullish trend + 30-minute entry confluence | MACD bullish crossover followed by rising volume and expanding red bars | Moving averages aligned bullishly and spreading upward | KDJ crossed above D without being overbought (57.8/49.9) | Volume increased 1.6x
════════════════════
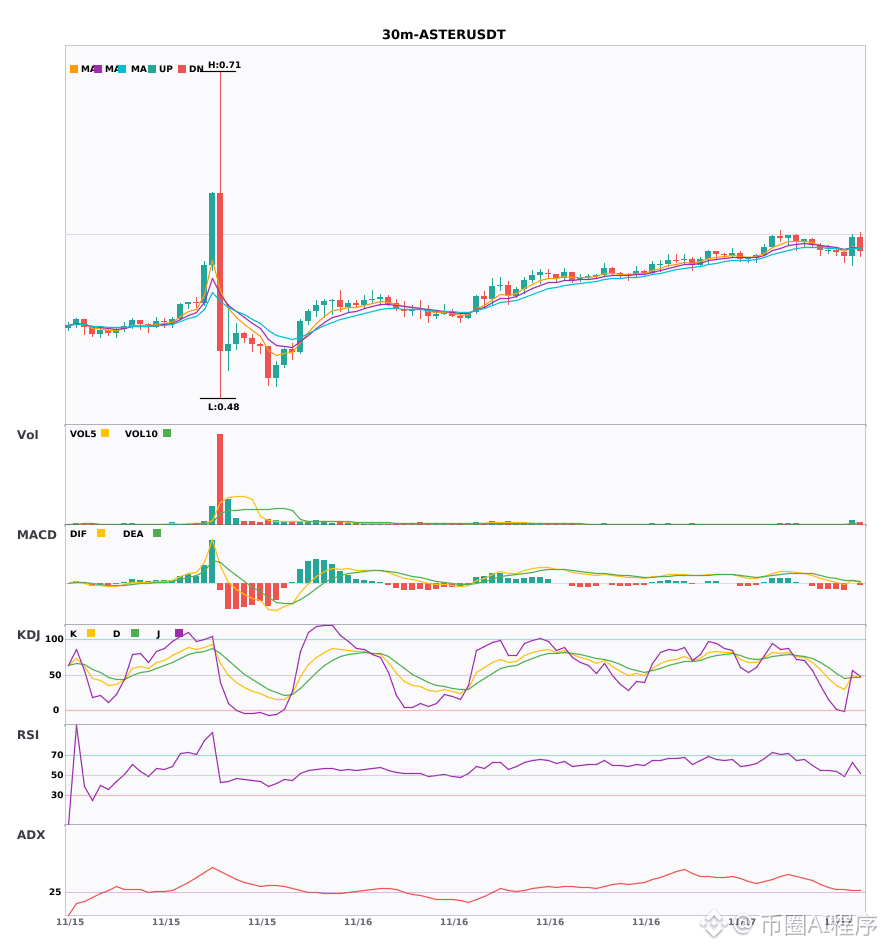
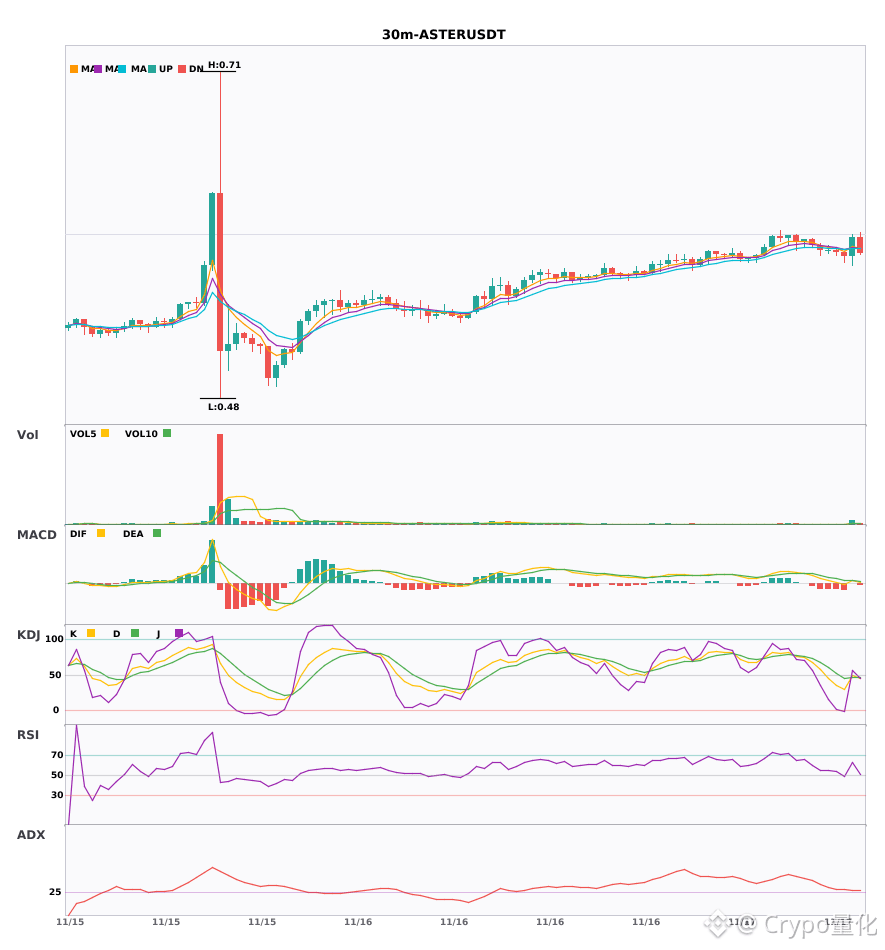
🔴 $ASTER 30-minute bullish signal
⚠️Technical analysis: 4-hour bullish confluence, 30-minute entry. After the MACD bullish crossover, volume rose and the red bars continued to expand; moving averages are aligned bullishly and spreading upward; KDJ's K line crossed above D without being overbought; volume surged 3.8x. Multiple timeframes align bullishly.
════════════════════
🔔 Follow for first-hand market updates 🔔
#多周期共振 #CT #ASTER
📌 When trading, pay attention to whether the candlestick patterns match
30-minute and 4-hour bullish confluence; trends for 2 coins have just been confirmed 🔥
════════════════════
🔴 $CT 30-minute bullish signal
⚠️Technical analysis: 4-hour bullish trend + 30-minute entry confluence | MACD bullish crossover followed by rising volume and expanding red bars | Moving averages aligned bullishly and spreading upward | KDJ crossed above D without being overbought (57.8/49.9) | Volume increased 1.6x
════════════════════
🔴 $ASTER 30-minute bullish signal
⚠️Technical analysis: 4-hour bullish confluence, 30-minute entry. After the MACD bullish crossover, volume rose and the red bars continued to expand; moving averages are aligned bullishly and spreading upward; KDJ's K line crossed above D without being overbought; volume surged 3.8x. Multiple timeframes align bullishly.
════════════════════
🔔 Follow for first-hand market updates 🔔
#多周期共振 #CT #ASTER
📌 When trading, pay attention to whether the candlestick patterns match
════════════════════
🔴 $CT 30-minute bullish signal
⚠️Technical analysis: 4-hour bullish trend + 30-minute entry confluence | MACD bullish crossover followed by rising volume and expanding red bars | Moving averages aligned bullishly and spreading upward | KDJ crossed above D without being overbought (57.8/49.9) | Volume increased 1.6x
════════════════════
🔴 $ASTER 30-minute bullish signal
⚠️Technical analysis: 4-hour bullish confluence, 30-minute entry. After the MACD bullish crossover, volume rose and the red bars continued to expand; moving averages are aligned bullishly and spreading upward; KDJ's K line crossed above D without being overbought; volume surged 3.8x. Multiple timeframes align bullishly.
════════════════════
🔔 Follow for first-hand market updates 🔔
#多周期共振 #CT #ASTER
📌 When trading, pay attention to whether the candlestick patterns match
8

30-minute timeframe bullish signal confluence: $CT/$CC/$ASTER
📈 $CT | 30-minute bullish signal
━━━━━━━━━━━━━━━━━━
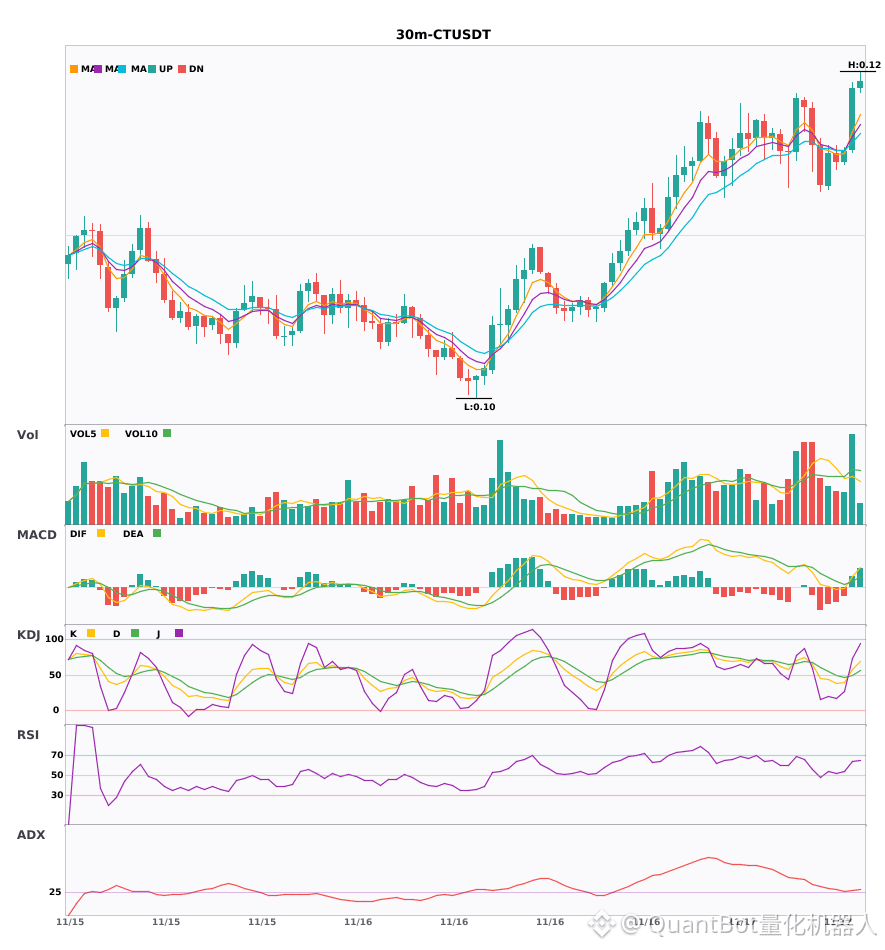
Technical analysis: ADX(28) trend established; MACD bullish crossover above zero; EMA5 crossed above EMA8; KDJ bullish crossover (K57.8/D49.9); volume increased 1.6x, indicating a bullish outlook.
Price change: 2.2400%
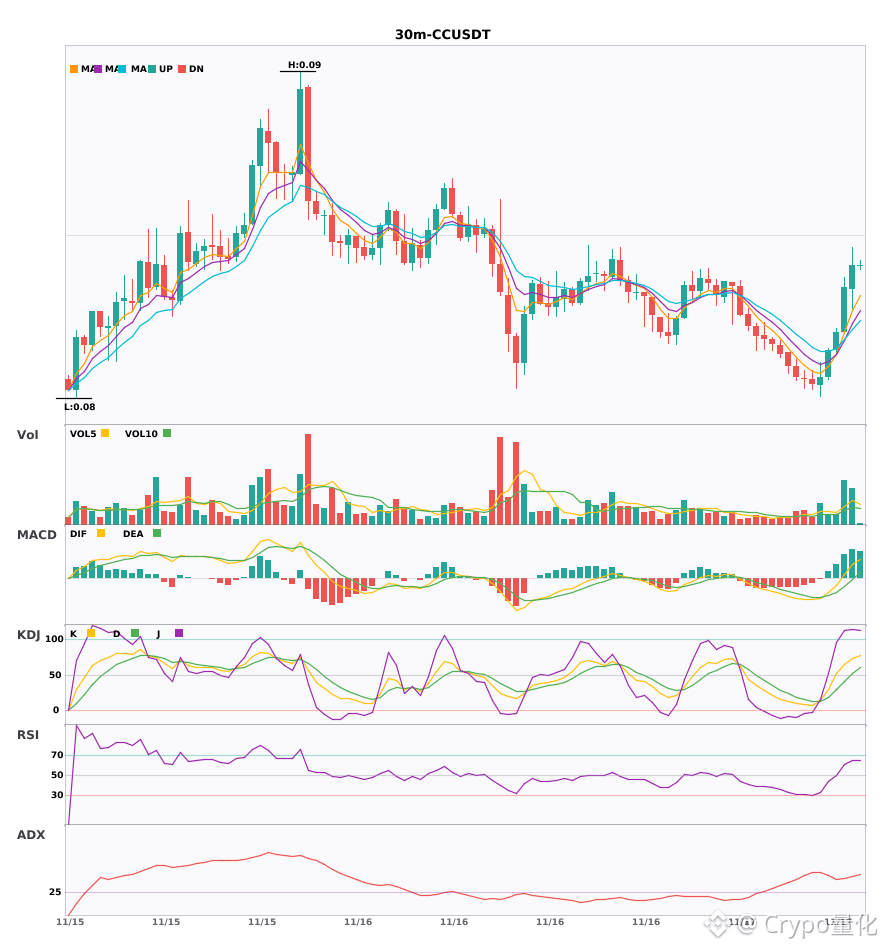
📈 $CC | 30-minute bullish signal
━━━━━━━━━━━━━━━━━━
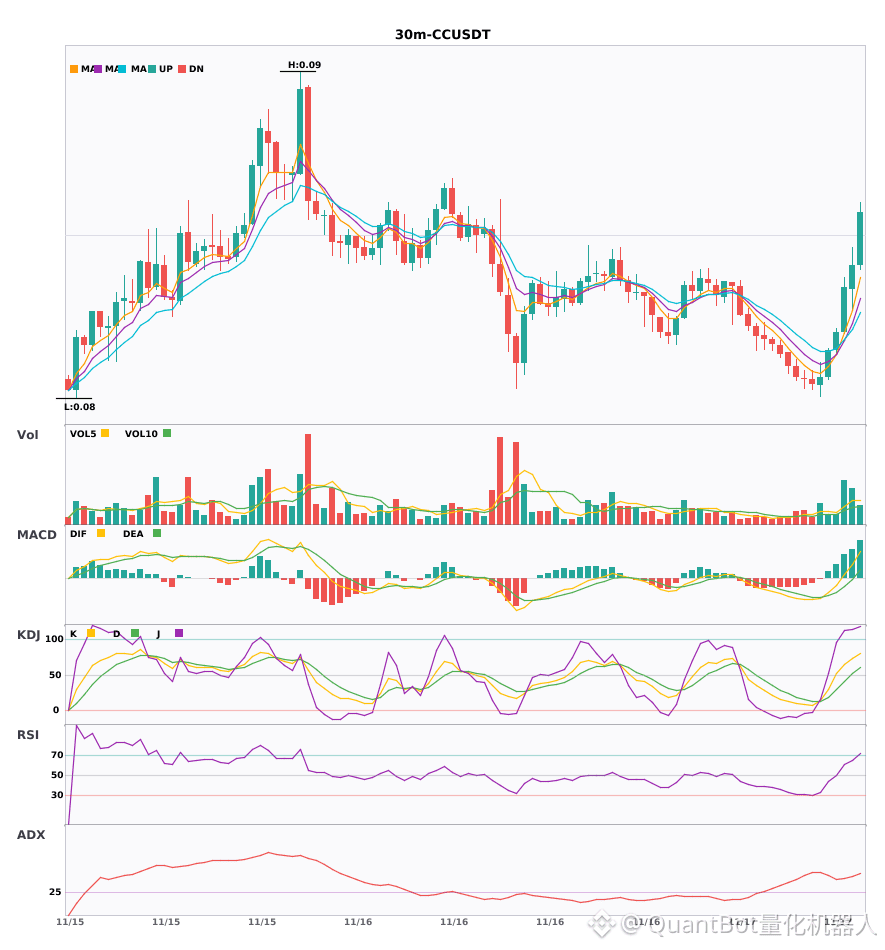
Technical analysis: ADX(45) shows a strong trend; MACD DIF crossed above the zero line, turning bullish; moving averages are converging ahead of a breakout; trading volume increased 3.1x.
Price change: 1.0900%
📈 $ASTER | 30-minute bullish signal
━━━━━━━━━━━━━━━━━━
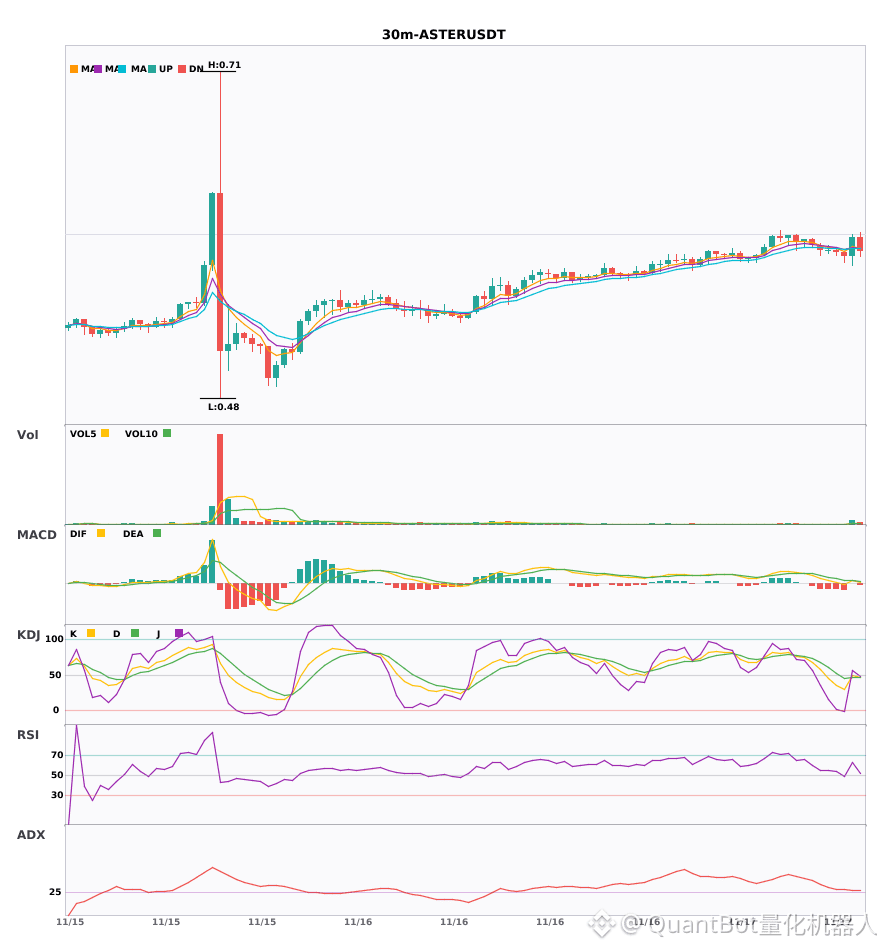
Technical analysis: ADX(28) trend established, suitable for participation; MACD DIF crossed above the zero line, turning bullish; EMA5 crossed above EMA8; KDJ bullish crossover (49.6/46.3); volume increased 3.8x.
Price change: 2.3800%
━━━━━━━━━━━━━━━━━━
#技术分析 #CT #CC #ASTER
📌 The above content is for reference only and does not constitute investment advice
30-minute timeframe bullish signal confluence: $CT /$CC /$ASTER
📈 $CT | 30-minute bullish signal
━━━━━━━━━━━━━━━━━━
Technical analysis: ADX(28) trend established; MACD bullish crossover above zero; EMA5 crossed above EMA8; KDJ bullish crossover (K57.8/D49.9); volume increased 1.6x, indicating a bullish outlook.
Price change: 2.2400%
📈 $CC | 30-minute bullish signal
━━━━━━━━━━━━━━━━━━
Technical analysis: ADX(45) shows a strong trend; MACD DIF crossed above the zero line, turning bullish; moving averages are converging ahead of a breakout; trading volume increased 3.1x.
Price change: 1.0900%
📈 $ASTER | 30-minute bullish signal
━━━━━━━━━━━━━━━━━━
Technical analysis: ADX(28) trend established, suitable for participation; MACD DIF crossed above the zero line, turning bullish; EMA5 crossed above EMA8; KDJ bullish crossover (49.6/46.3); volume increased 3.8x.
Price change: 2.3800%
━━━━━━━━━━━━━━━━━━
#技术分析 #CT #CC #ASTER
📌 The above content is for reference only and does not constitute investment advice
📈 $CT | 30-minute bullish signal
━━━━━━━━━━━━━━━━━━
Technical analysis: ADX(28) trend established; MACD bullish crossover above zero; EMA5 crossed above EMA8; KDJ bullish crossover (K57.8/D49.9); volume increased 1.6x, indicating a bullish outlook.
Price change: 2.2400%
📈 $CC | 30-minute bullish signal
━━━━━━━━━━━━━━━━━━
Technical analysis: ADX(45) shows a strong trend; MACD DIF crossed above the zero line, turning bullish; moving averages are converging ahead of a breakout; trading volume increased 3.1x.
Price change: 1.0900%
📈 $ASTER | 30-minute bullish signal
━━━━━━━━━━━━━━━━━━
Technical analysis: ADX(28) trend established, suitable for participation; MACD DIF crossed above the zero line, turning bullish; EMA5 crossed above EMA8; KDJ bullish crossover (49.6/46.3); volume increased 3.8x.
Price change: 2.3800%
━━━━━━━━━━━━━━━━━━
#技术分析 #CT #CC #ASTER
📌 The above content is for reference only and does not constitute investment advice
13

·
--
$CT/$CC/$ASTER 30 minutes, leaning bullish—short-term confluence offers a chance to get in 🔥
════════════════════
🔴 $CT 30-minute bullish signal
⚠️ Technical analysis: The trend is just getting started, so you can ride the move. MACD had a bullish crossover followed by increased volume, and the red bars are growing as bullish momentum builds. EMA5 just crossed above EMA8, and the moving averages are starting to turn upward. On KDJ, the K line crossed above the D line and is not yet in overbought territory, indicating a bullish short-term outlook. Volume also rose 1.6x, with good price-volume confirmation.
════════════════════
🔴 $CC 30-minute bullish signal
⚠️ Technical analysis: ADX is as high as 45, and the trend is already established. MACD had a bullish crossover followed by increased volume, and DIF crossed above the zero line—a clear bullish signal. The moving averages have just begun to fan upward after converging, and volume rose 3.1x. The bullish crossover is backed by higher volume, suggesting a bullish short-term outlook.
════════════════════
🔴 $ASTER 30-minute bullish signal
⚠️ Technical analysis: The ADX trend is just starting, so there may be an opportunity to participate. MACD has crossed bullishly on increased volume. The moving averages have just formed a bullish alignment. On KDJ, K crossed above D without reaching overbought territory. Volume surged 3.8x.
════════════════════
🔔 Follow to get market moves as they happen 🔔
#技术分析 #CT #CC #ASTER
📌 When trading, pay attention to whether the candlestick pattern confirms the setup.
$CT /$CC /$ASTER 30 minutes, leaning bullish—short-term confluence offers a chance to get in 🔥
════════════════════
🔴 $CT 30-minute bullish signal
⚠️ Technical analysis: The trend is just getting started, so you can ride the move. MACD had a bullish crossover followed by increased volume, and the red bars are growing as bullish momentum builds. EMA5 just crossed above EMA8, and the moving averages are starting to turn upward. On KDJ, the K line crossed above the D line and is not yet in overbought territory, indicating a bullish short-term outlook. Volume also rose 1.6x, with good price-volume confirmation.
════════════════════
🔴 $CC 30-minute bullish signal
⚠️ Technical analysis: ADX is as high as 45, and the trend is already established. MACD had a bullish crossover followed by increased volume, and DIF crossed above the zero line—a clear bullish signal. The moving averages have just begun to fan upward after converging, and volume rose 3.1x. The bullish crossover is backed by higher volume, suggesting a bullish short-term outlook.
════════════════════
🔴 $ASTER 30-minute bullish signal
⚠️ Technical analysis: The ADX trend is just starting, so there may be an opportunity to participate. MACD has crossed bullishly on increased volume. The moving averages have just formed a bullish alignment. On KDJ, K crossed above D without reaching overbought territory. Volume surged 3.8x.
════════════════════
🔔 Follow to get market moves as they happen 🔔
#技术分析 #CT #CC #ASTER
📌 When trading, pay attention to whether the candlestick pattern confirms the setup.
════════════════════
🔴 $CT 30-minute bullish signal
⚠️ Technical analysis: The trend is just getting started, so you can ride the move. MACD had a bullish crossover followed by increased volume, and the red bars are growing as bullish momentum builds. EMA5 just crossed above EMA8, and the moving averages are starting to turn upward. On KDJ, the K line crossed above the D line and is not yet in overbought territory, indicating a bullish short-term outlook. Volume also rose 1.6x, with good price-volume confirmation.
════════════════════
🔴 $CC 30-minute bullish signal
⚠️ Technical analysis: ADX is as high as 45, and the trend is already established. MACD had a bullish crossover followed by increased volume, and DIF crossed above the zero line—a clear bullish signal. The moving averages have just begun to fan upward after converging, and volume rose 3.1x. The bullish crossover is backed by higher volume, suggesting a bullish short-term outlook.
════════════════════
🔴 $ASTER 30-minute bullish signal
⚠️ Technical analysis: The ADX trend is just starting, so there may be an opportunity to participate. MACD has crossed bullishly on increased volume. The moving averages have just formed a bullish alignment. On KDJ, K crossed above D without reaching overbought territory. Volume surged 3.8x.
════════════════════
🔔 Follow to get market moves as they happen 🔔
#技术分析 #CT #CC #ASTER
📌 When trading, pay attention to whether the candlestick pattern confirms the setup.
4
·
--
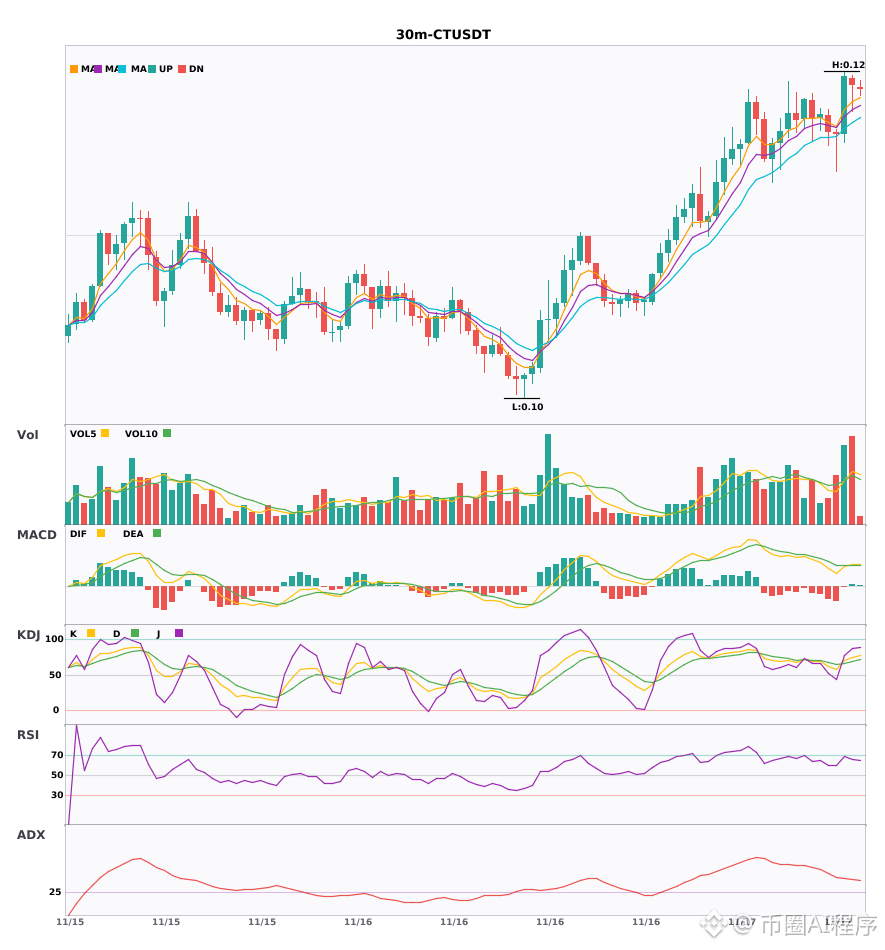
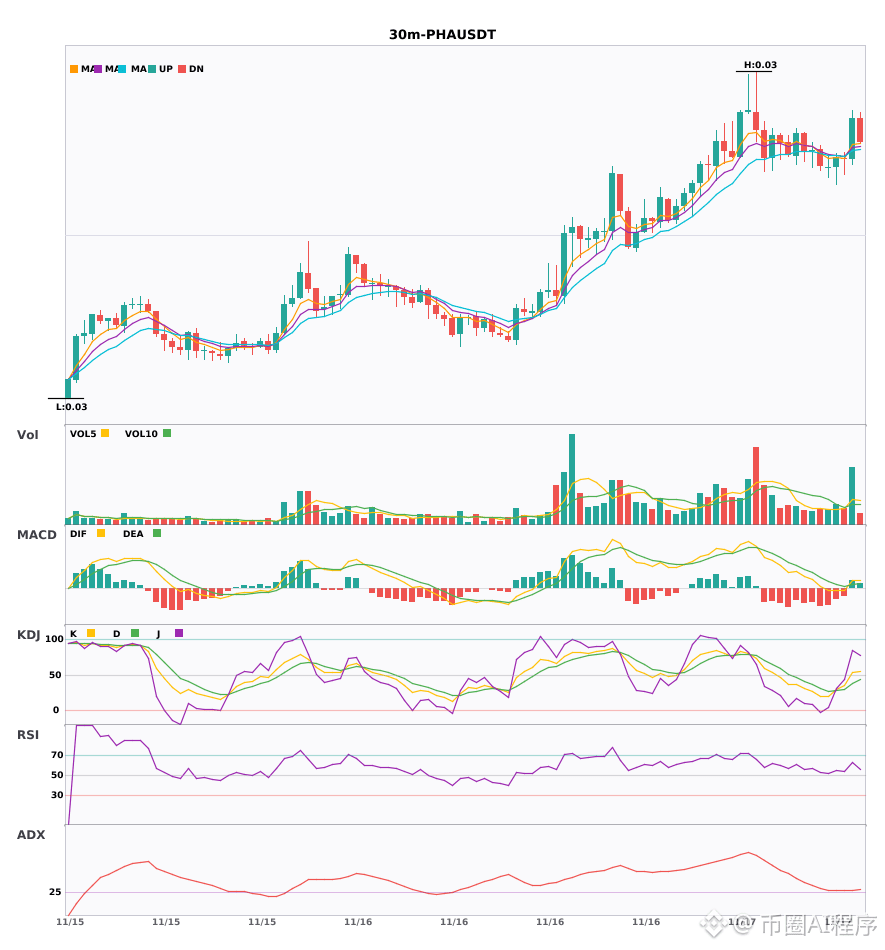
$ZEC $CT $PHA 30-minute charts diverging upward in the same direction; multi-timeframe confluence for a long 🔥
════════════════════
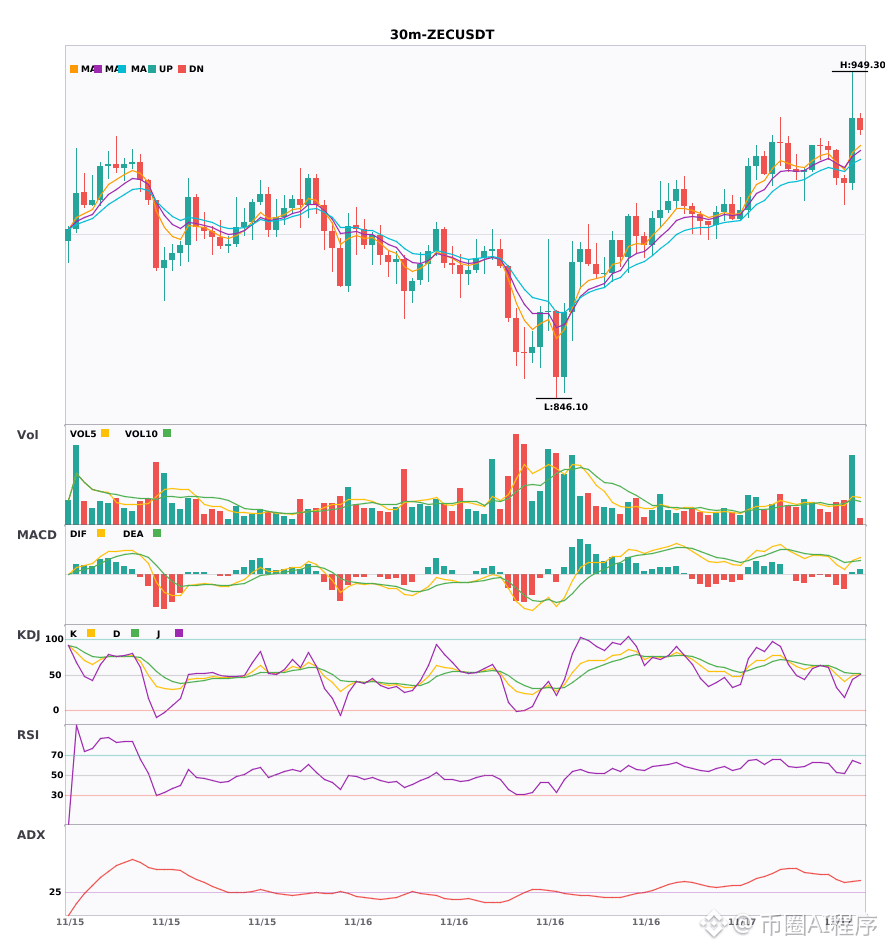
🔴 $ZEC 30-minute bullish signal
⚠️Technical analysis: Bullish confluence across the 4-hour and 30-minute timeframes! After a MACD golden cross on the 30-minute chart, volume expanded and the red histogram bars continued to grow. EMA5 crossed above EMA8, turning short-term bullish. Trading volume surged 2.7x, making the entry signal clear.
════════════════════
🔴 $CT 30-minute bullish signal
⚠️Technical analysis: Bullish confluence across the 4-hour and 30-minute timeframes: The 30-minute MACD golden cross is accompanied by steadily growing red histogram bars. The moving averages are in a bullish alignment and spreading upward. KDJ crossed above D without entering overbought territory, and volume expanded 1.8x. The confluence signal for a long is clear.
════════════════════
🔴 $PHA 30-minute bullish signal
⚠️Technical analysis: The 30-minute MACD golden cross came with increased volume, and the moving averages have just formed a bullish alignment. Trading volume surged 2.8x, confirmed by bullish confluence on the 4-hour chart. Multiple timeframes are aligned!
════════════════════
🔔 Follow for the latest market movements 🔔
#多周期共振 #ZEC #CT #PHA
📌 When trading, check whether the candlestick pattern aligns
$ZEC $CT $PHA 30-minute charts diverging upward in the same direction; multi-timeframe confluence for a long 🔥
════════════════════
🔴 $ZEC 30-minute bullish signal
⚠️Technical analysis: Bullish confluence across the 4-hour and 30-minute timeframes! After a MACD golden cross on the 30-minute chart, volume expanded and the red histogram bars continued to grow. EMA5 crossed above EMA8, turning short-term bullish. Trading volume surged 2.7x, making the entry signal clear.
════════════════════
🔴 $CT 30-minute bullish signal
⚠️Technical analysis: Bullish confluence across the 4-hour and 30-minute timeframes: The 30-minute MACD golden cross is accompanied by steadily growing red histogram bars. The moving averages are in a bullish alignment and spreading upward. KDJ crossed above D without entering overbought territory, and volume expanded 1.8x. The confluence signal for a long is clear.
════════════════════
🔴 $PHA 30-minute bullish signal
⚠️Technical analysis: The 30-minute MACD golden cross came with increased volume, and the moving averages have just formed a bullish alignment. Trading volume surged 2.8x, confirmed by bullish confluence on the 4-hour chart. Multiple timeframes are aligned!
════════════════════
🔔 Follow for the latest market movements 🔔
#多周期共振 #ZEC #CT #PHA
📌 When trading, check whether the candlestick pattern aligns
════════════════════
🔴 $ZEC 30-minute bullish signal
⚠️Technical analysis: Bullish confluence across the 4-hour and 30-minute timeframes! After a MACD golden cross on the 30-minute chart, volume expanded and the red histogram bars continued to grow. EMA5 crossed above EMA8, turning short-term bullish. Trading volume surged 2.7x, making the entry signal clear.
════════════════════
🔴 $CT 30-minute bullish signal
⚠️Technical analysis: Bullish confluence across the 4-hour and 30-minute timeframes: The 30-minute MACD golden cross is accompanied by steadily growing red histogram bars. The moving averages are in a bullish alignment and spreading upward. KDJ crossed above D without entering overbought territory, and volume expanded 1.8x. The confluence signal for a long is clear.
════════════════════
🔴 $PHA 30-minute bullish signal
⚠️Technical analysis: The 30-minute MACD golden cross came with increased volume, and the moving averages have just formed a bullish alignment. Trading volume surged 2.8x, confirmed by bullish confluence on the 4-hour chart. Multiple timeframes are aligned!
════════════════════
🔔 Follow for the latest market movements 🔔
#多周期共振 #ZEC #CT #PHA
📌 When trading, check whether the candlestick pattern aligns
12
·
--
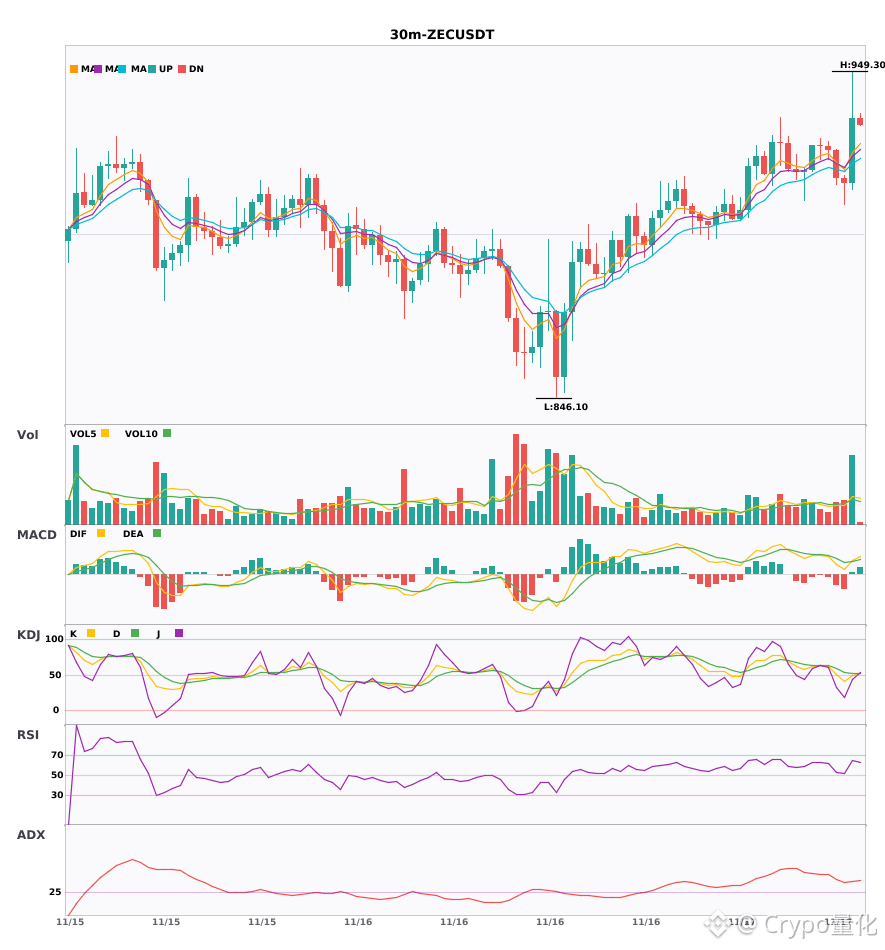
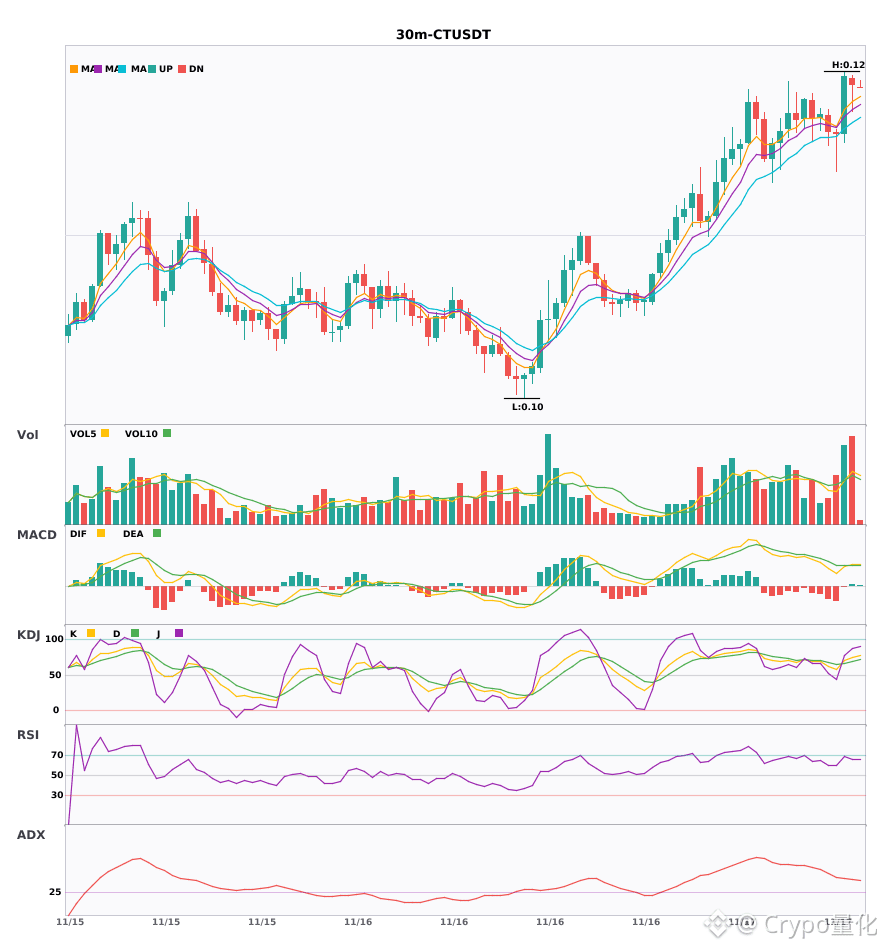
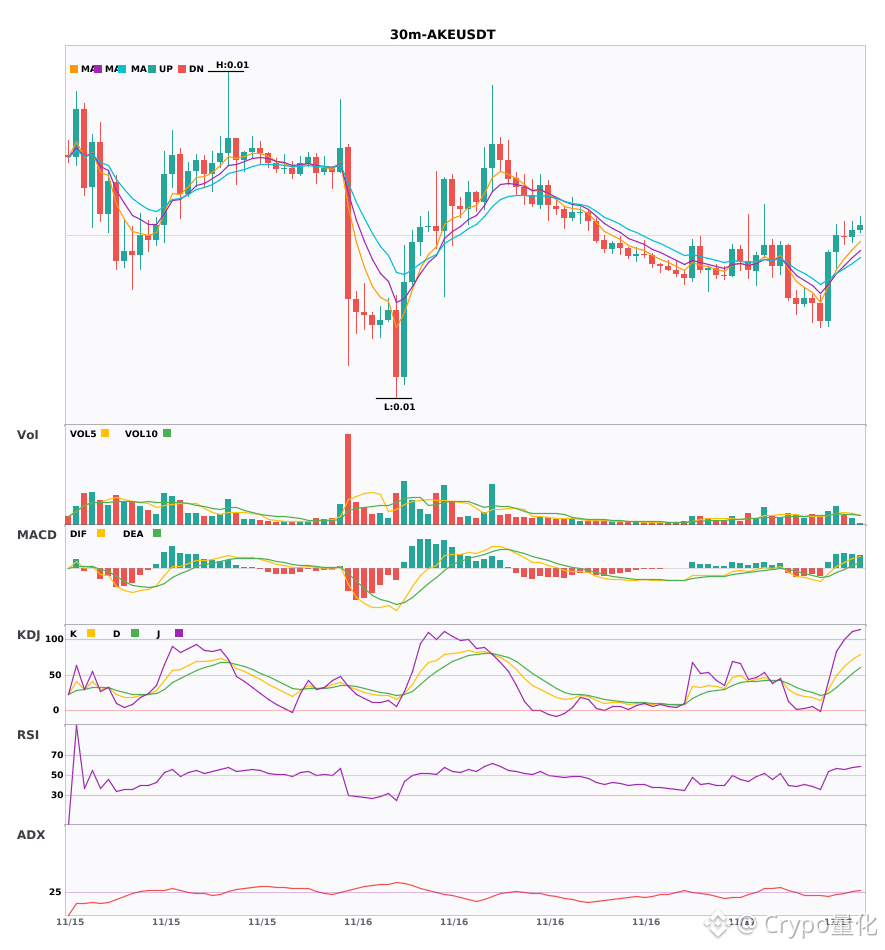
$ZEC/$CT/$AKE 30-minute golden cross with rising volume; short-term signals align for a long 🔥
════════════════════
🔴 $ZEC 30-minute bullish signal
⚠️Technical analysis: ADX 37, with a strong trend; MACD golden cross above zero, with the red bars continuing to grow; moving averages have just formed a bullish alignment; trading volume has surged 2.7x.
════════════════════
🔴 $CT 30-minute bullish signal
⚠️Technical analysis: ADX 37, clear trend|MACD golden cross with rising volume, red bars growing|Moving averages have just aligned bullishly and are trending up|K crossed above D, not overbought; strong momentum|Volume up 1.8x
════════════════════
🔴 $AKE 30-minute bullish signal
⚠️Technical analysis: ADX trend is just taking shape; after the MACD golden cross, the red bars are growing; moving averages are bullishly aligned and diverging upward; volume is up 1.7x—an opportunity to participate
════════════════════
🔔 Follow for first-hand market movement alerts 🔔
#技术分析 #ZEC #CT #AKE
📌 When trading, pay attention to whether the candlestick pattern meets the criteria
$ZEC /$CT /$AKE 30-minute golden cross with rising volume; short-term signals align for a long 🔥
════════════════════
🔴 $ZEC 30-minute bullish signal
⚠️Technical analysis: ADX 37, with a strong trend; MACD golden cross above zero, with the red bars continuing to grow; moving averages have just formed a bullish alignment; trading volume has surged 2.7x.
════════════════════
🔴 $CT 30-minute bullish signal
⚠️Technical analysis: ADX 37, clear trend|MACD golden cross with rising volume, red bars growing|Moving averages have just aligned bullishly and are trending up|K crossed above D, not overbought; strong momentum|Volume up 1.8x
════════════════════
🔴 $AKE 30-minute bullish signal
⚠️Technical analysis: ADX trend is just taking shape; after the MACD golden cross, the red bars are growing; moving averages are bullishly aligned and diverging upward; volume is up 1.7x—an opportunity to participate
════════════════════
🔔 Follow for first-hand market movement alerts 🔔
#技术分析 #ZEC #CT #AKE
📌 When trading, pay attention to whether the candlestick pattern meets the criteria
════════════════════
🔴 $ZEC 30-minute bullish signal
⚠️Technical analysis: ADX 37, with a strong trend; MACD golden cross above zero, with the red bars continuing to grow; moving averages have just formed a bullish alignment; trading volume has surged 2.7x.
════════════════════
🔴 $CT 30-minute bullish signal
⚠️Technical analysis: ADX 37, clear trend|MACD golden cross with rising volume, red bars growing|Moving averages have just aligned bullishly and are trending up|K crossed above D, not overbought; strong momentum|Volume up 1.8x
════════════════════
🔴 $AKE 30-minute bullish signal
⚠️Technical analysis: ADX trend is just taking shape; after the MACD golden cross, the red bars are growing; moving averages are bullishly aligned and diverging upward; volume is up 1.7x—an opportunity to participate
════════════════════
🔔 Follow for first-hand market movement alerts 🔔
#技术分析 #ZEC #CT #AKE
📌 When trading, pay attention to whether the candlestick pattern meets the criteria
25

·
--
$CT Reached a new 24-hour high: current price 0.1108, previous high 0.1099.
After the breakout, two key things to watch:
· Whether the previous high of 0.1099 turns from resistance into support (holds on a retest)
· Whether trading volume increased during the breakout; breakouts on low volume often turn out to be false breakouts
Where do you think it goes from here?
#CT
$CT Reached a new 24-hour high: current price 0.1108, previous high 0.1099.
After the breakout, two key things to watch:
· Whether the previous high of 0.1099 turns from resistance into support (holds on a retest)
· Whether trading volume increased during the breakout; breakouts on low volume often turn out to be false breakouts
Where do you think it goes from here?
#CT
After the breakout, two key things to watch:
· Whether the previous high of 0.1099 turns from resistance into support (holds on a retest)
· Whether trading volume increased during the breakout; breakouts on low volume often turn out to be false breakouts
Where do you think it goes from here?
#CT
3

·
--
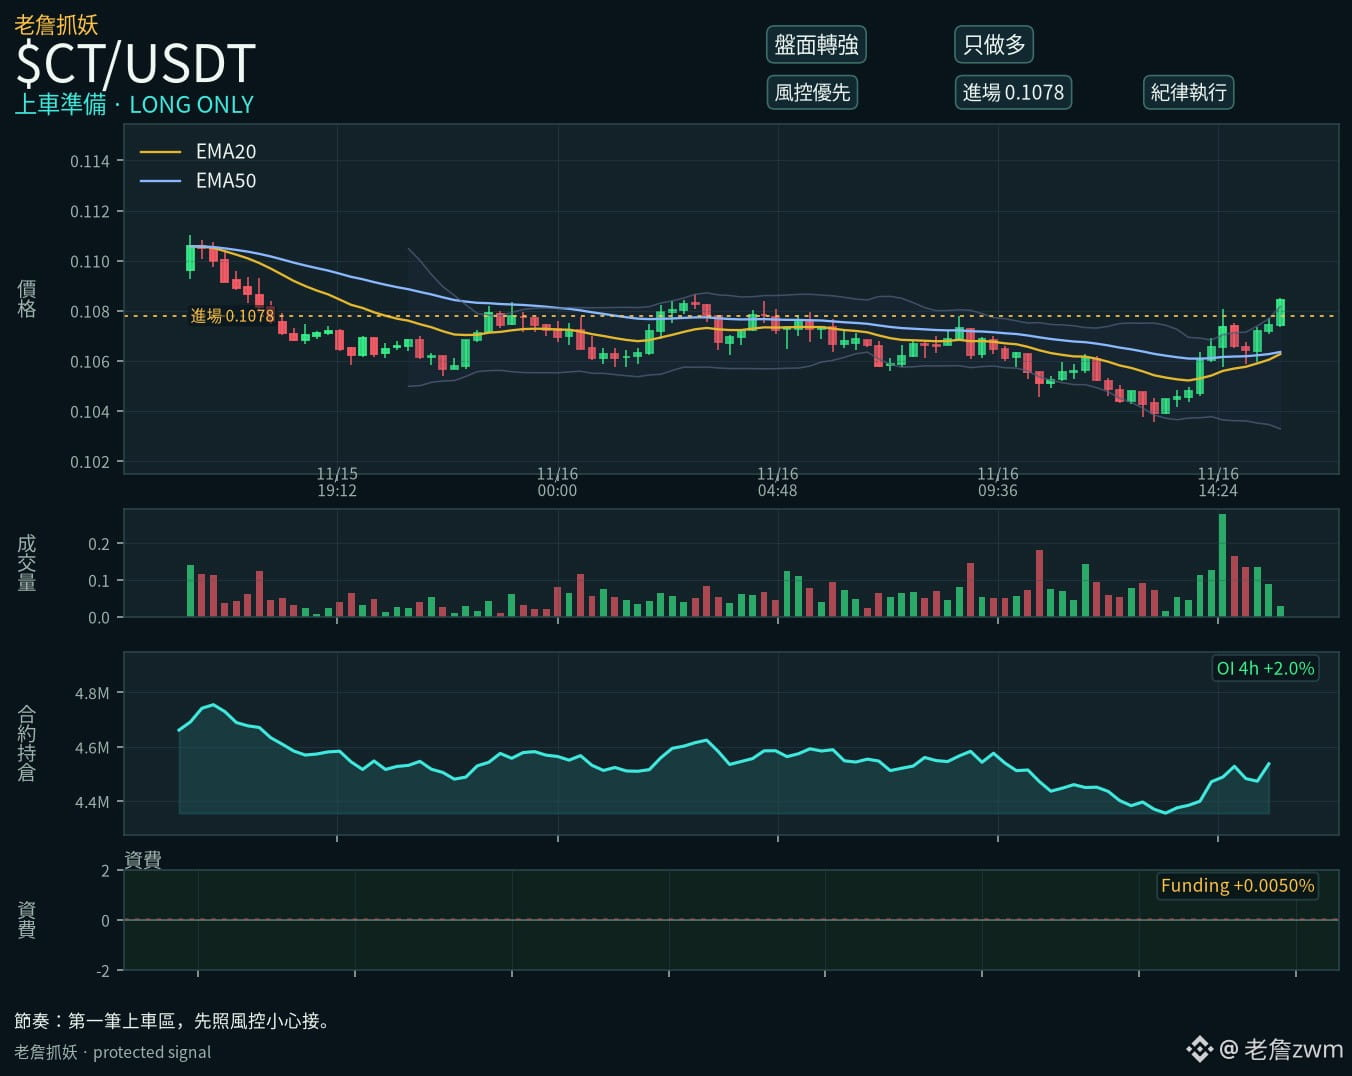
$CT Some people have started positioning early.
Open interest in futures is gradually increasing, and aggressive buy orders have consistently outweighed sell orders. The only caveat is that volume has been a bit erratic, and the price is already near recent highs.
Start with a small position and add if volume picks up. Exit if it falls below 0.09163; take 30% off the table at 0.1186.
#CT #山寨币 # Futures
$CT Some people have started positioning early.
Open interest in futures is gradually increasing, and aggressive buy orders have consistently outweighed sell orders. The only caveat is that volume has been a bit erratic, and the price is already near recent highs.
Start with a small position and add if volume picks up. Exit if it falls below 0.09163; take 30% off the table at 0.1186.
#CT #山寨币 # Futures
Open interest in futures is gradually increasing, and aggressive buy orders have consistently outweighed sell orders. The only caveat is that volume has been a bit erratic, and the price is already near recent highs.
Start with a small position and add if volume picks up. Exit if it falls below 0.09163; take 30% off the table at 0.1186.
#CT #山寨币 # Futures
51

📊 $CT Update
Price: 0.11050 USDT (+3.46% over 24h)
1h trend: bullish (EMA 9 / 21)
Price below EMA 50 on 4h
1h RSI: 59, fairly neutral
24h volume: $8.9M
Funding +0.0061% (longs pay shorts)
Open interest $4.6M (+1.52% over 24h)
A break above 0.11100 would pave the way higher.
#CT #Concrete #CryptoFutures
⚠️ DYOR — not financial advice. Leverage can wipe you out.
📊 $CT Update
Price: 0.11050 USDT (+3.46% over 24h)
1h trend: bullish (EMA 9 / 21)
Price below EMA 50 on 4h
1h RSI: 59, fairly neutral
24h volume: $8.9M
Funding +0.0061% (longs pay shorts)
Open interest $4.6M (+1.52% over 24h)
A break above 0.11100 would pave the way higher.
#CT #Concrete #CryptoFutures
⚠️ DYOR — not financial advice. Leverage can wipe you out.
Price: 0.11050 USDT (+3.46% over 24h)
1h trend: bullish (EMA 9 / 21)
Price below EMA 50 on 4h
1h RSI: 59, fairly neutral
24h volume: $8.9M
Funding +0.0061% (longs pay shorts)
Open interest $4.6M (+1.52% over 24h)
A break above 0.11100 would pave the way higher.
#CT #Concrete #CryptoFutures
⚠️ DYOR — not financial advice. Leverage can wipe you out.
23

·
--
🦈 $CT SWEEPING INTERNAL LIQUIDITY POI AS SMART MONEY ACCUMULATES QUIETLY ⚡
Entry: 0.11090 - 0.11156 ⚡
Target: 0.11385 🚀
Stop Loss: 0.10927 ⚠️
Price action on $CT is currently printing a textbook institutional retest inside a verified fair value gap. Smart money footprints indicate aggressive absorption at these lows while retail liquidity gets swept below previous session barriers. 📊
Momentum oscillators on the lower timeframes are resetting cleanly, leaving plenty of room for expansion toward our primary upside liquidity objective. 💡
💬 Are you positioning ahead of the breakout or waiting for confirmation above local resistance? 👇
⚠️ Not financial advice. Always manage your risk. 🛡️
🏷️ #CT #LongSetup #SmartMoney #Crypto
🔥 💎
🦈 $CT SWEEPING INTERNAL LIQUIDITY POI AS SMART MONEY ACCUMULATES QUIETLY ⚡
Entry: 0.11090 - 0.11156 ⚡
Target: 0.11385 🚀
Stop Loss: 0.10927 ⚠️
Price action on $CT is currently printing a textbook institutional retest inside a verified fair value gap. Smart money footprints indicate aggressive absorption at these lows while retail liquidity gets swept below previous session barriers. 📊
Momentum oscillators on the lower timeframes are resetting cleanly, leaving plenty of room for expansion toward our primary upside liquidity objective. 💡
💬 Are you positioning ahead of the breakout or waiting for confirmation above local resistance? 👇
⚠️ Not financial advice. Always manage your risk. 🛡️
🏷️ #CT #LongSetup #SmartMoney #Crypto
🔥 💎
Entry: 0.11090 - 0.11156 ⚡
Target: 0.11385 🚀
Stop Loss: 0.10927 ⚠️
Price action on $CT is currently printing a textbook institutional retest inside a verified fair value gap. Smart money footprints indicate aggressive absorption at these lows while retail liquidity gets swept below previous session barriers. 📊
Momentum oscillators on the lower timeframes are resetting cleanly, leaving plenty of room for expansion toward our primary upside liquidity objective. 💡
💬 Are you positioning ahead of the breakout or waiting for confirmation above local resistance? 👇
⚠️ Not financial advice. Always manage your risk. 🛡️
🏷️ #CT #LongSetup #SmartMoney #Crypto
🔥 💎
12
🟢 $CT IS RETAINING BID MOMENTUM AS BUYERS TIGHTEN THE COIL FOR A BREAKOUT! ⚡
Entry: 0.11090 - 0.11156 ⚡
Target: 0.11385 🚀
Stop Loss: 0.10927 ⚠️
Order flow shows aggressive passive absorption right inside this local demand pocket, signaling that smart money is quietly defending their territory from further downside pressure. 🌊 Volume profiles are starting to lean heavily toward the buy side as sellers exhaust their liquidity near the local lows. 📊
Patience is key while the order book clears out the remaining weak hands before the next expansion wave hits the tape. 💡 Are you scaling into this bid early or waiting for a confirmed candle close above resistance? 👇
⚠️ Not financial advice. Always manage your risk. 🛡️
🏷️ #CT #LongSetup #Momentum #Crypto #Breakout
🔥 💎
🟢 $CT IS RETAINING BID MOMENTUM AS BUYERS TIGHTEN THE COIL FOR A BREAKOUT! ⚡
Entry: 0.11090 - 0.11156 ⚡
Target: 0.11385 🚀
Stop Loss: 0.10927 ⚠️
Order flow shows aggressive passive absorption right inside this local demand pocket, signaling that smart money is quietly defending their territory from further downside pressure. 🌊 Volume profiles are starting to lean heavily toward the buy side as sellers exhaust their liquidity near the local lows. 📊
Patience is key while the order book clears out the remaining weak hands before the next expansion wave hits the tape. 💡 Are you scaling into this bid early or waiting for a confirmed candle close above resistance? 👇
⚠️ Not financial advice. Always manage your risk. 🛡️
🏷️ #CT #LongSetup #Momentum #Crypto #Breakout
🔥 💎
Entry: 0.11090 - 0.11156 ⚡
Target: 0.11385 🚀
Stop Loss: 0.10927 ⚠️
Order flow shows aggressive passive absorption right inside this local demand pocket, signaling that smart money is quietly defending their territory from further downside pressure. 🌊 Volume profiles are starting to lean heavily toward the buy side as sellers exhaust their liquidity near the local lows. 📊
Patience is key while the order book clears out the remaining weak hands before the next expansion wave hits the tape. 💡 Are you scaling into this bid early or waiting for a confirmed candle close above resistance? 👇
⚠️ Not financial advice. Always manage your risk. 🛡️
🏷️ #CT #LongSetup #Momentum #Crypto #Breakout
🔥 💎
20
Log in to explore more content
Join global crypto users on Binance Square
⚡️ Get latest and useful information about crypto.
💬 Trusted by the world’s largest crypto exchange.
👍 Discover real insights from verified creators.
Email / Phone number
Trending Topics
1
#NvidiaEarningsTonight:AIStocks’NextMove?
77,324 views
1,026 Discussing
2
#A Packed Week of Earnings and Data Tests Markets
125,875 views
624 Discussing
3
#AnthropicIPOTestsInvestorAppetiteForAI
280,266 views
2,699 Discussing
4
#NvidiaBoardNotConsideringHuang’sReturnasCEO
86,616 views
839 Discussing
5
#KOSPIFalls2.59%ToLowestCloseSinceFebruary
17,368 views
226 Discussing
6
#AnthropicClearedToListOnNasdaqAsANT
18,126 views
199 Discussing
7
#WhatInvestmentSignalsDo13FFilingsReveal?
46,261 views
593 Discussing
8
#TetherCapitalMakesStrategicInvestmentInStables
7,211 views
76 Discussing
9
#EvernorthRecords$505MImpairmentOnPreListingXRP
1,352 views
19 Discussing
10
#GoldmanSachsReports$1.22BInEtherETFHoldings
1,040 views
16 Discussing