
#bome
bome
81.4M views
46,166 Discussing
Hot
Latest

·
--
$BOME hit a new 24-hour high, with strong buying pressure.
Current price: 0.0005122, breaking above the previous high of 0.0005081. 24-hour trading volume: $600,000.
Short stop-loss orders tend to cluster near new highs, so holding above this level could trigger short covering. However, watch out for a pullback after the spike.
#BOME
Just use this as a reference—don't take it as gospel.
$BOME hit a new 24-hour high, with strong buying pressure.
Current price: 0.0005122, breaking above the previous high of 0.0005081. 24-hour trading volume: $600,000.
Short stop-loss orders tend to cluster near new highs, so holding above this level could trigger short covering. However, watch out for a pullback after the spike.
#BOME
Just use this as a reference—don't take it as gospel.
Current price: 0.0005122, breaking above the previous high of 0.0005081. 24-hour trading volume: $600,000.
Short stop-loss orders tend to cluster near new highs, so holding above this level could trigger short covering. However, watch out for a pullback after the spike.
#BOME
Just use this as a reference—don't take it as gospel.

·
--
Once everyone is talking about it, the entry point isn't as good.
$BOME Buying support has emerged near the lows.
There have been noticeably more aggressive buy orders than sell orders over the past hour, and the price is just above the low from two days ago.
The broader market conditions aren't great, though, and volume has been a bit inconsistent.
Keep it light—half a position is enough. Stop-loss: 0.0004177; first target: 0.0005405. Once it gets there, take 30% off the table.
#BOME
Once everyone is talking about it, the entry point isn't as good.
$BOME Buying support has emerged near the lows.
There have been noticeably more aggressive buy orders than sell orders over the past hour, and the price is just above the low from two days ago.
The broader market conditions aren't great, though, and volume has been a bit inconsistent.
Keep it light—half a position is enough. Stop-loss: 0.0004177; first target: 0.0005405. Once it gets there, take 30% off the table.
#BOME
$BOME Buying support has emerged near the lows.
There have been noticeably more aggressive buy orders than sell orders over the past hour, and the price is just above the low from two days ago.
The broader market conditions aren't great, though, and volume has been a bit inconsistent.
Keep it light—half a position is enough. Stop-loss: 0.0004177; first target: 0.0005405. Once it gets there, take 30% off the table.
#BOME
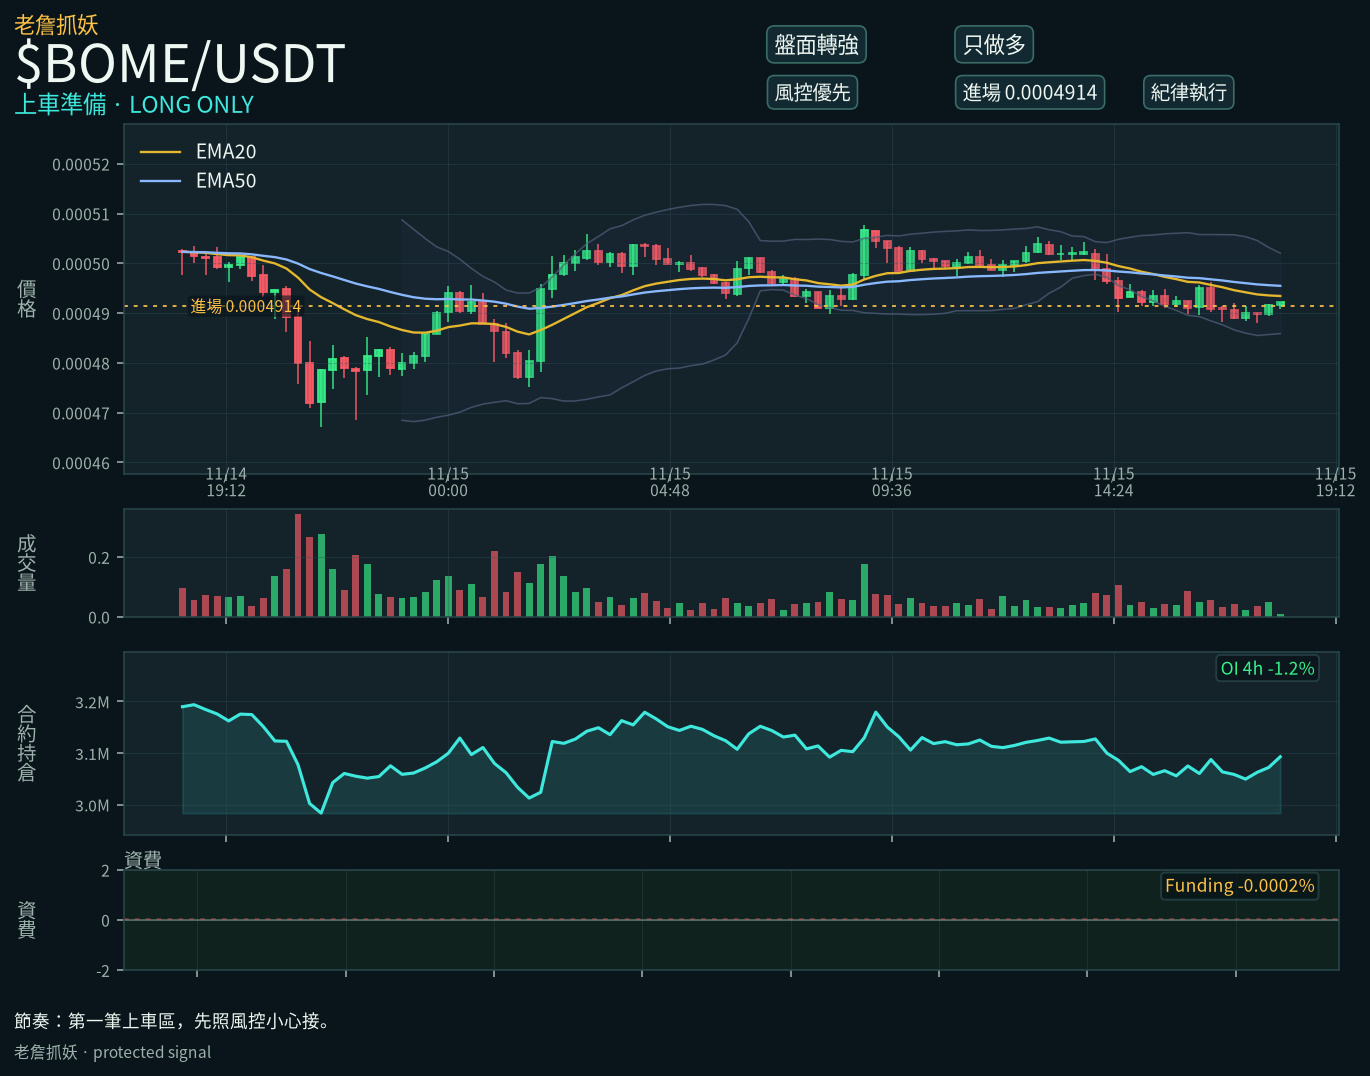
54

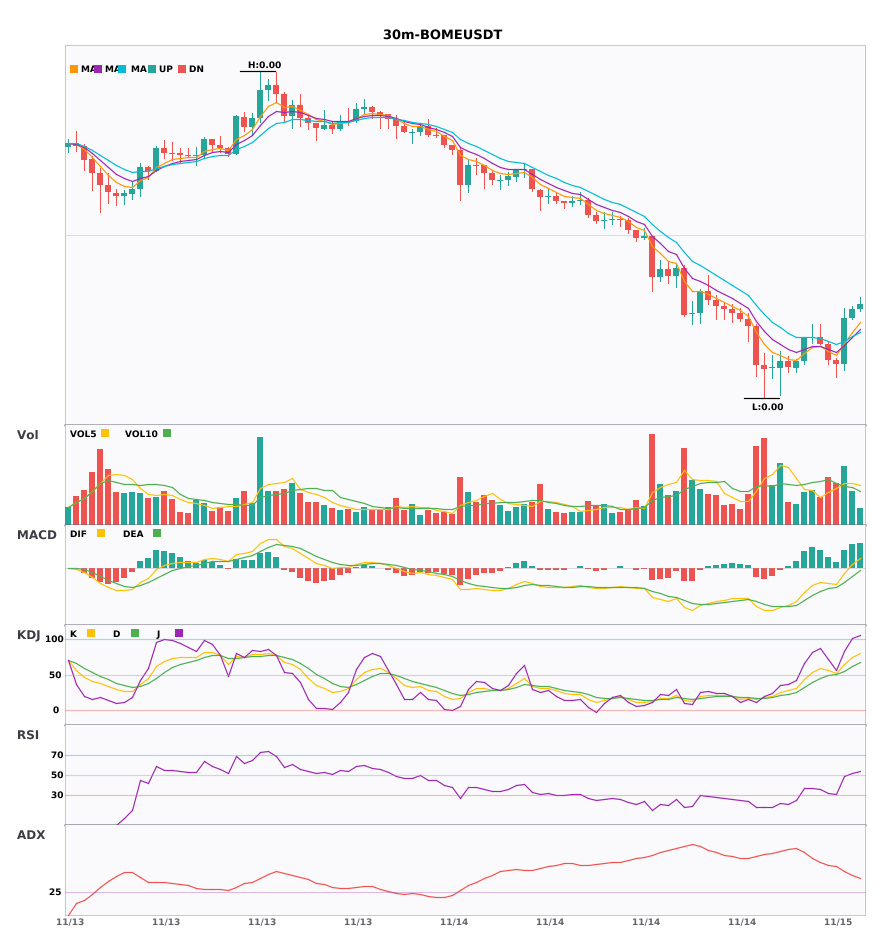
$BOME 30-minute technicals turn stronger, with short-term bullish signals
📈 $BOME | 30-minute bullish signal
━━━━━━━━━━━━━━━━━━
Technical analysis: ADX (41) shows a pronounced trend; the MACD DIF crossing above the zero line confirms a bullish reversal. Moving averages are converging as momentum builds, with a directional move approaching. KDJ is in the strong zone (K74.6/D61.6), with buyers in control. Trading volume has increased to 1.5 times its previous level.
Price change: 0.7000%
━━━━━━━━━━━━━━━━━━
#技术分析 #BOME
📌 The above is for reference only and does not constitute investment advice
$BOME 30-minute technicals turn stronger, with short-term bullish signals
📈 $BOME | 30-minute bullish signal
━━━━━━━━━━━━━━━━━━
Technical analysis: ADX (41) shows a pronounced trend; the MACD DIF crossing above the zero line confirms a bullish reversal. Moving averages are converging as momentum builds, with a directional move approaching. KDJ is in the strong zone (K74.6/D61.6), with buyers in control. Trading volume has increased to 1.5 times its previous level.
Price change: 0.7000%
━━━━━━━━━━━━━━━━━━
#技术分析 #BOME
📌 The above is for reference only and does not constitute investment advice
📈 $BOME | 30-minute bullish signal
━━━━━━━━━━━━━━━━━━
Technical analysis: ADX (41) shows a pronounced trend; the MACD DIF crossing above the zero line confirms a bullish reversal. Moving averages are converging as momentum builds, with a directional move approaching. KDJ is in the strong zone (K74.6/D61.6), with buyers in control. Trading volume has increased to 1.5 times its previous level.
Price change: 0.7000%
━━━━━━━━━━━━━━━━━━
#技术分析 #BOME
📌 The above is for reference only and does not constitute investment advice
25

·
--
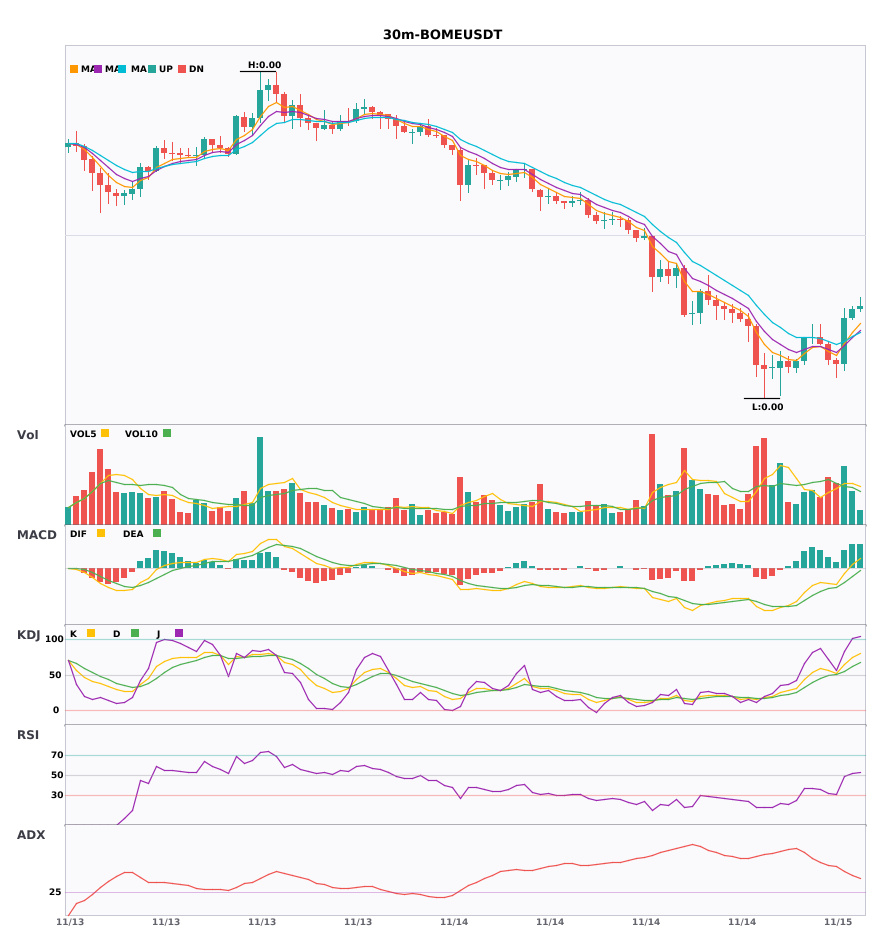
$BOME 30-minute bullish alignment and golden cross on rising volume—the short-term opportunity is here 🔥
════════════════════
🔴 $BOME 30-minute bullish signal
⚠️Technical analysis: ADX 41, trend is fairly strong | MACD golden cross on rising volume, crossed above the zero line and turned bullish | Moving averages are converging and about to diverge | K crossed above D, not yet overbought | Volume increased 1.5x
════════════════════
🔔 Follow for first-hand market updates 🔔
#技术分析 #BOME
📌 When trading, pay attention to whether the candlestick pattern confirms the signal
$BOME 30-minute bullish alignment and golden cross on rising volume—the short-term opportunity is here 🔥
════════════════════
🔴 $BOME 30-minute bullish signal
⚠️Technical analysis: ADX 41, trend is fairly strong | MACD golden cross on rising volume, crossed above the zero line and turned bullish | Moving averages are converging and about to diverge | K crossed above D, not yet overbought | Volume increased 1.5x
════════════════════
🔔 Follow for first-hand market updates 🔔
#技术分析 #BOME
📌 When trading, pay attention to whether the candlestick pattern confirms the signal
════════════════════
🔴 $BOME 30-minute bullish signal
⚠️Technical analysis: ADX 41, trend is fairly strong | MACD golden cross on rising volume, crossed above the zero line and turned bullish | Moving averages are converging and about to diverge | K crossed above D, not yet overbought | Volume increased 1.5x
════════════════════
🔔 Follow for first-hand market updates 🔔
#技术分析 #BOME
📌 When trading, pay attention to whether the candlestick pattern confirms the signal
8

·
--
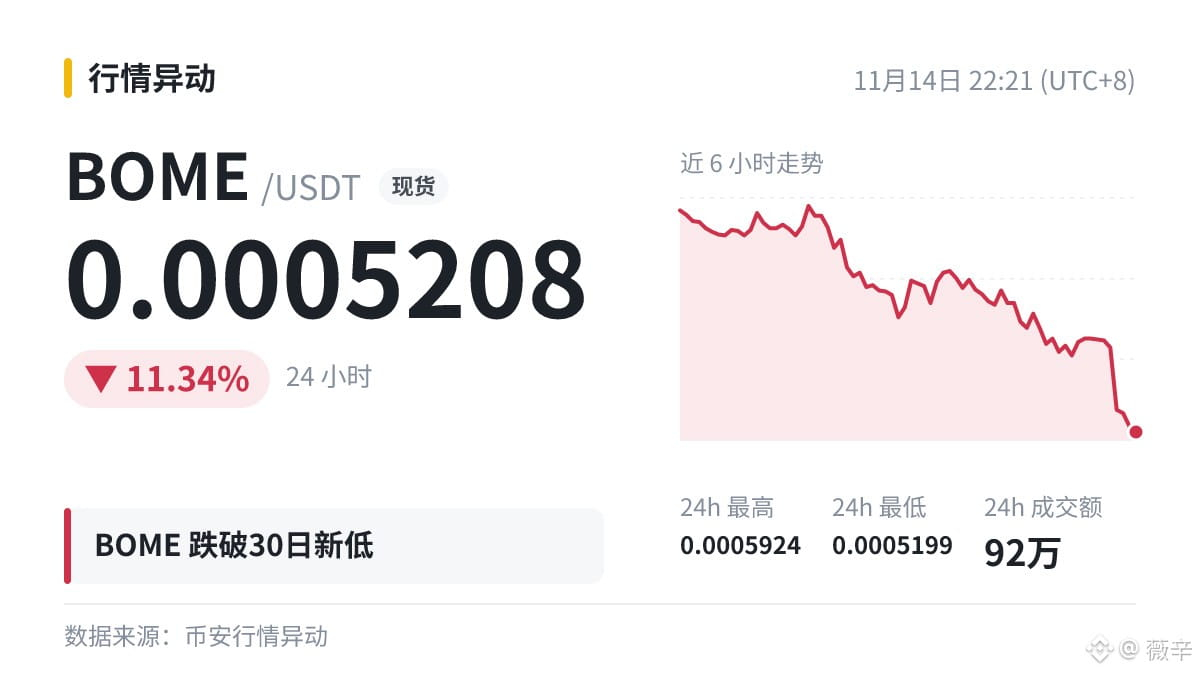
🥶 $BOME hits a new 30-day low of 0.0005208, breaking below the previous low of 0.0005273.
Risk is beginning to unwind. After a sharp drop, whether it can hold steady is far more important than how high it rebounds. How do you usually handle flash crashes?
#BOME
🥶 $BOME hits a new 30-day low of 0.0005208, breaking below the previous low of 0.0005273.
Risk is beginning to unwind. After a sharp drop, whether it can hold steady is far more important than how high it rebounds. How do you usually handle flash crashes?
#BOME
Risk is beginning to unwind. After a sharp drop, whether it can hold steady is far more important than how high it rebounds. How do you usually handle flash crashes?
#BOME
6

·
--
🐻 $BOME sets a new 30-day low at 0.0005208, breaking below the previous low of 0.0005273.
It’s pulled back again. After a sharp drop, whether it can hold steady matters more than how high the rebound goes. Will you reduce your position when the rebound comes?
#BOME
🐻 $BOME sets a new 30-day low at 0.0005208, breaking below the previous low of 0.0005273.
It’s pulled back again. After a sharp drop, whether it can hold steady matters more than how high the rebound goes. Will you reduce your position when the rebound comes?
#BOME
It’s pulled back again. After a sharp drop, whether it can hold steady matters more than how high the rebound goes. Will you reduce your position when the rebound comes?
#BOME
14

·
--
$BOME
{future}(BOMEUSDT)
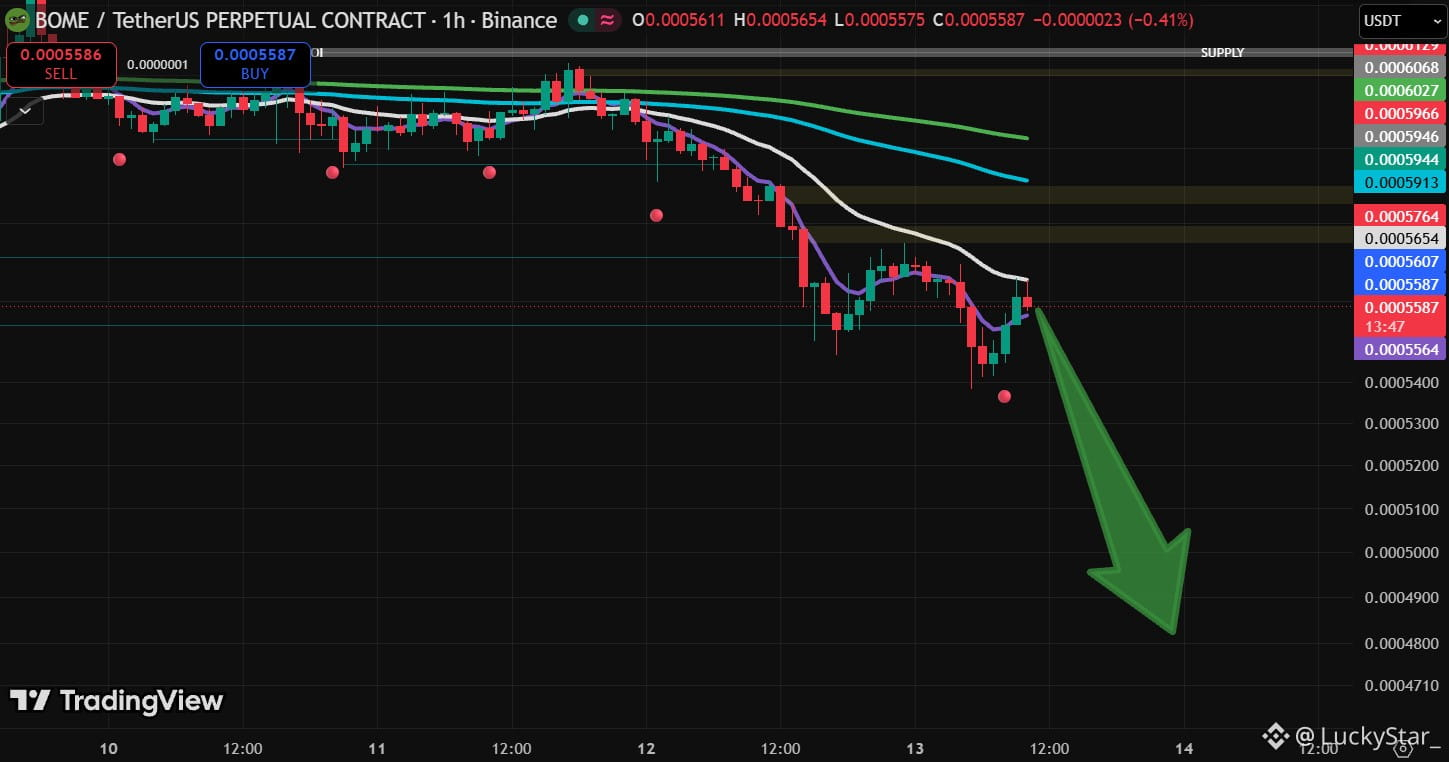
📉 I am currently closely monitoring the possibility of opening a SHORT position.
Buyers are gradually losing control, while sellers are beginning to exert more pressure on the price.
#BOME🔥🔥🔥 #BOME #BOMEUpdate
$BOME
📉 I am currently closely monitoring the possibility of opening a SHORT position.
Buyers are gradually losing control, while sellers are beginning to exert more pressure on the price.
#BOME🔥🔥🔥 #BOME #BOMEUpdate
📉 I am currently closely monitoring the possibility of opening a SHORT position.
Buyers are gradually losing control, while sellers are beginning to exert more pressure on the price.
#BOME🔥🔥🔥 #BOME #BOMEUpdate
49

·
--
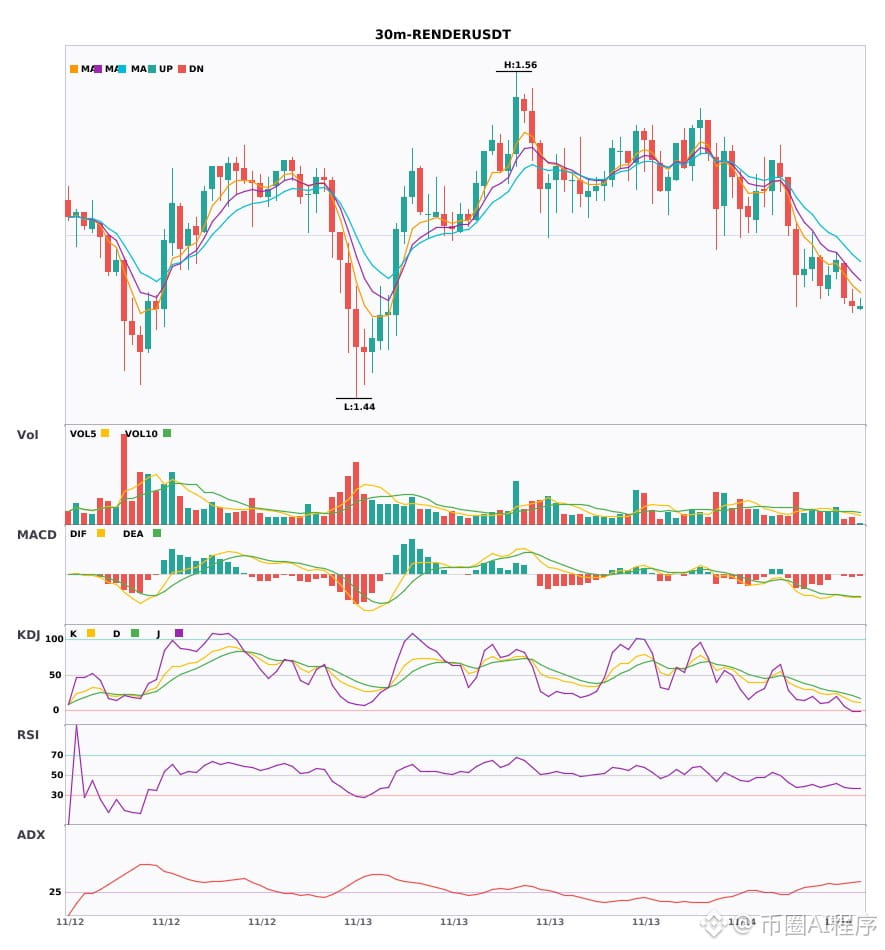
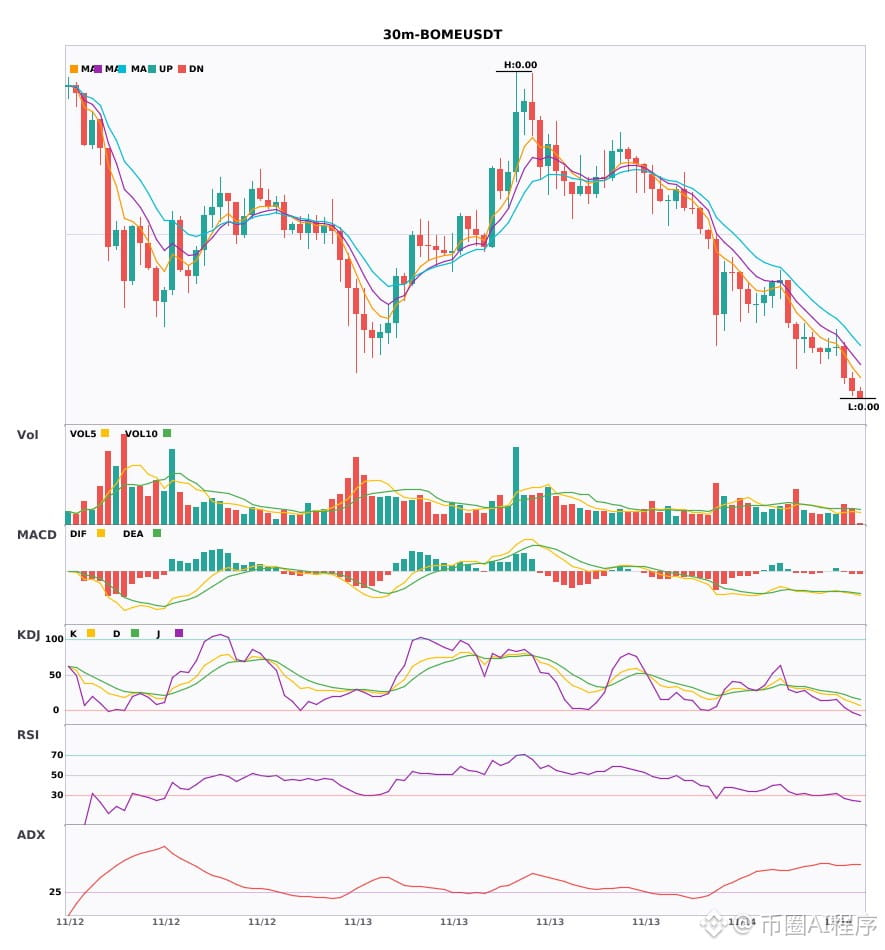
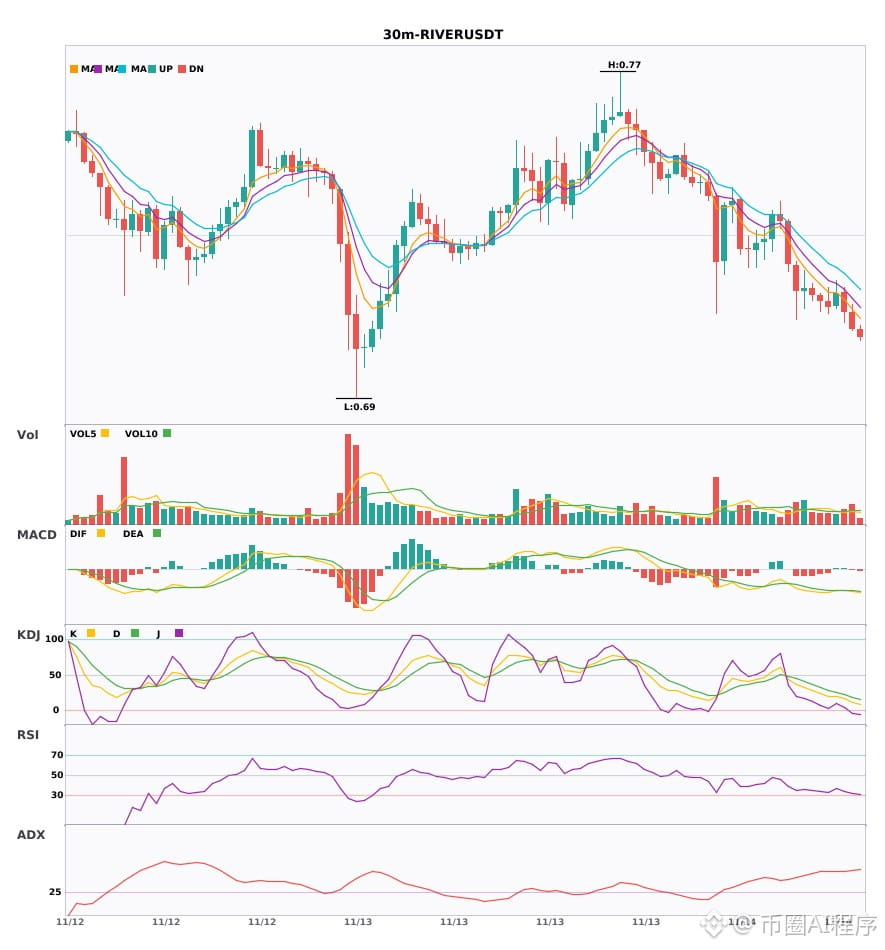
$RENDER $BOME $RIVER 30 minutes and 4 hours turn bearish at the same time—the short-side confluence is here 🔥
════════════════════
🟢 $RENDER 30-minute bearish signal
⚠️Technical analysis: 4-hour bearish trend + 30-minute confluence confirmed. After the MACD death cross, the green bars continue to grow; moving averages are bearishly aligned and diverging downward; KDJ is probing lower in weak territory; volume is 1.3 times higher.
════════════════════
🟢 $BOME 30-minute bearish signal
⚠️Technical analysis: 4-hour bearish trend + 30-minute entry confluence! The MACD death cross's green bars are growing; moving averages are bearishly aligned and diverging downward; KDJ is probing lower in weak territory without reaching oversold levels. Bears have the upper hand.
════════════════════
🟢 $RIVER 30-minute bearish signal
⚠️Technical analysis: 4-hour and 30-minute bearish confluence confirmed. On the 30-minute chart, the MACD has made a death cross below zero and the green bars are growing; moving averages are bearishly aligned and pointing downward; KDJ has entered oversold territory, so beware of a rebound.
════════════════════
🔔 Follow for first-hand market updates 🔔
#多周期共振 #RENDER #BOME #RIVER
📌 When trading, pay attention to whether the candlestick pattern confirms the setup
$RENDER $BOME $RIVER 30 minutes and 4 hours turn bearish at the same time—the short-side confluence is here 🔥
════════════════════
🟢 $RENDER 30-minute bearish signal
⚠️Technical analysis: 4-hour bearish trend + 30-minute confluence confirmed. After the MACD death cross, the green bars continue to grow; moving averages are bearishly aligned and diverging downward; KDJ is probing lower in weak territory; volume is 1.3 times higher.
════════════════════
🟢 $BOME 30-minute bearish signal
⚠️Technical analysis: 4-hour bearish trend + 30-minute entry confluence! The MACD death cross's green bars are growing; moving averages are bearishly aligned and diverging downward; KDJ is probing lower in weak territory without reaching oversold levels. Bears have the upper hand.
════════════════════
🟢 $RIVER 30-minute bearish signal
⚠️Technical analysis: 4-hour and 30-minute bearish confluence confirmed. On the 30-minute chart, the MACD has made a death cross below zero and the green bars are growing; moving averages are bearishly aligned and pointing downward; KDJ has entered oversold territory, so beware of a rebound.
════════════════════
🔔 Follow for first-hand market updates 🔔
#多周期共振 #RENDER #BOME #RIVER
📌 When trading, pay attention to whether the candlestick pattern confirms the setup
════════════════════
🟢 $RENDER 30-minute bearish signal
⚠️Technical analysis: 4-hour bearish trend + 30-minute confluence confirmed. After the MACD death cross, the green bars continue to grow; moving averages are bearishly aligned and diverging downward; KDJ is probing lower in weak territory; volume is 1.3 times higher.
════════════════════
🟢 $BOME 30-minute bearish signal
⚠️Technical analysis: 4-hour bearish trend + 30-minute entry confluence! The MACD death cross's green bars are growing; moving averages are bearishly aligned and diverging downward; KDJ is probing lower in weak territory without reaching oversold levels. Bears have the upper hand.
════════════════════
🟢 $RIVER 30-minute bearish signal
⚠️Technical analysis: 4-hour and 30-minute bearish confluence confirmed. On the 30-minute chart, the MACD has made a death cross below zero and the green bars are growing; moving averages are bearishly aligned and pointing downward; KDJ has entered oversold territory, so beware of a rebound.
════════════════════
🔔 Follow for first-hand market updates 🔔
#多周期共振 #RENDER #BOME #RIVER
📌 When trading, pay attention to whether the candlestick pattern confirms the setup
16

·
--
$BOME fell below the 24-hour low: current price 0.0005364, previous low 0.0005391.
After the breakdown, watch two things:
· Whether the previous low of 0.0005391 turns from support into resistance (price fails to rebound above it)
· Whether trading volume increased during the breakdown; a break on low volume may be a false breakdown
Do you think the market has overreacted in pricing this in?
#BOME
Just my personal opinion; I may not be right. Please consider it rationally.
$BOME fell below the 24-hour low: current price 0.0005364, previous low 0.0005391.
After the breakdown, watch two things:
· Whether the previous low of 0.0005391 turns from support into resistance (price fails to rebound above it)
· Whether trading volume increased during the breakdown; a break on low volume may be a false breakdown
Do you think the market has overreacted in pricing this in?
#BOME
Just my personal opinion; I may not be right. Please consider it rationally.
After the breakdown, watch two things:
· Whether the previous low of 0.0005391 turns from support into resistance (price fails to rebound above it)
· Whether trading volume increased during the breakdown; a break on low volume may be a false breakdown
Do you think the market has overreacted in pricing this in?
#BOME
Just my personal opinion; I may not be right. Please consider it rationally.
275

·
--
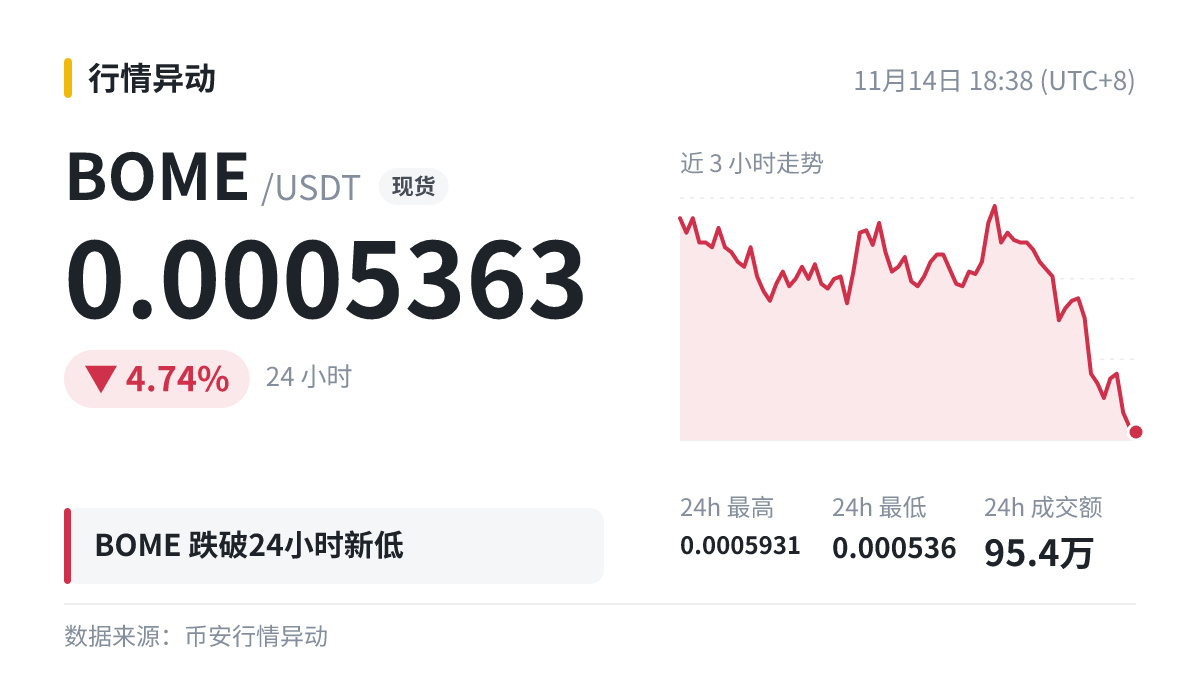
🐋 $BOME hit a new 24-hour low; selling pressure isn't over yet.
Current price: 0.0005363, breaking below the previous low of 0.0005391. 24-hour trading volume: $954,000.
There are often many long-position stop-losses clustered below the previous low. Breaking below it could trigger a cascade of liquidations; watch for large buyers stepping in at lower levels.
#BOME
🐋 $BOME hit a new 24-hour low; selling pressure isn't over yet.
Current price: 0.0005363, breaking below the previous low of 0.0005391. 24-hour trading volume: $954,000.
There are often many long-position stop-losses clustered below the previous low. Breaking below it could trigger a cascade of liquidations; watch for large buyers stepping in at lower levels.
#BOME
Current price: 0.0005363, breaking below the previous low of 0.0005391. 24-hour trading volume: $954,000.
There are often many long-position stop-losses clustered below the previous low. Breaking below it could trigger a cascade of liquidations; watch for large buyers stepping in at lower levels.
#BOME
6
·
--
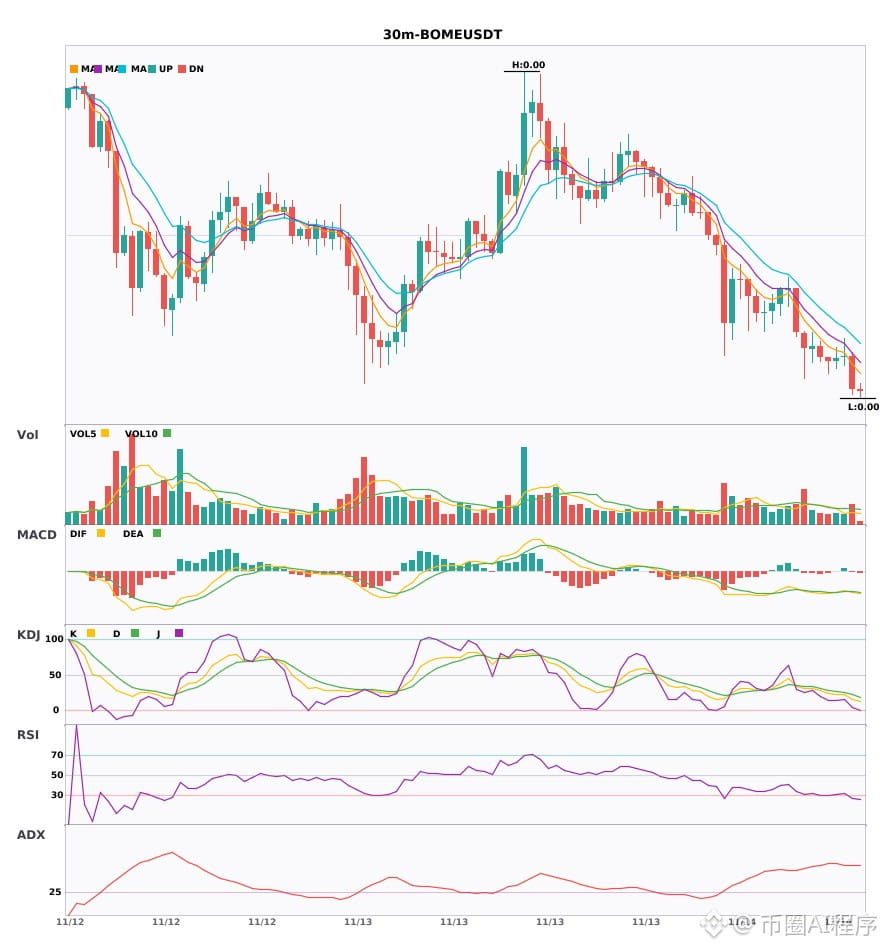
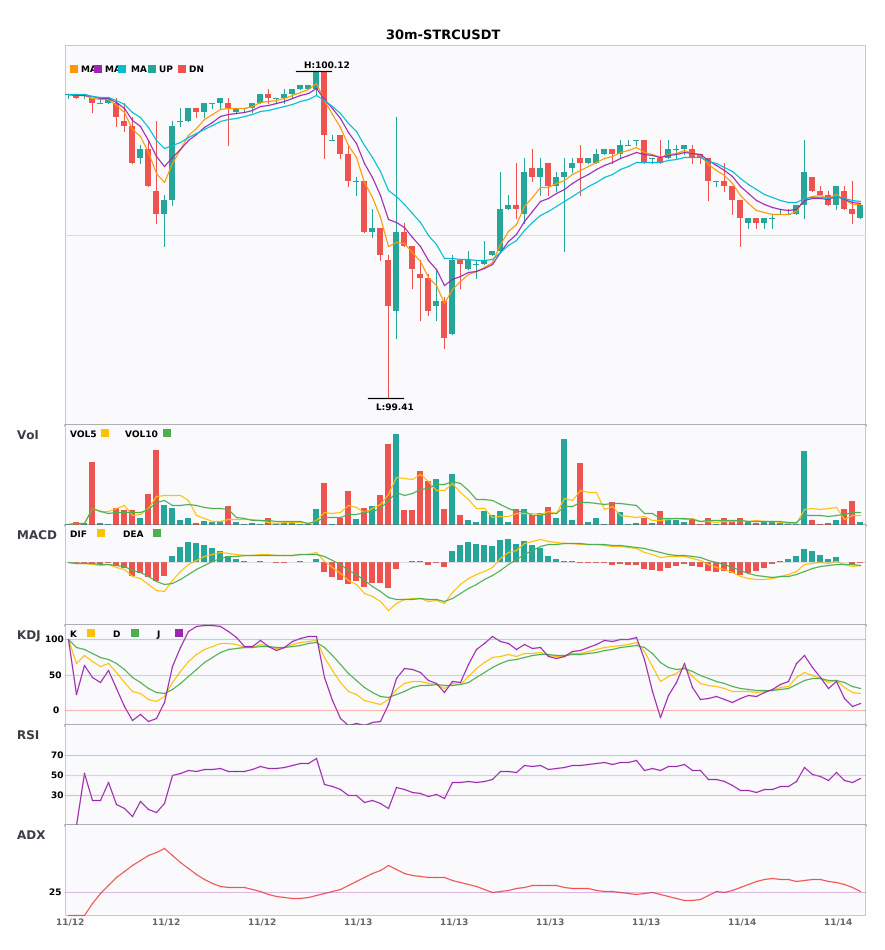
30-minute weakness, 4-hour bearish confirmation, $BOME $STRC multi-timeframe bearish confluence 🔥
════════════════════
🟢 $BOME 30-minute bearish signal
⚠️Technical analysis: 4-hour bearish trend confirmed, with a confluence of 30-minute entry signals! MACD turns down with expanding volume after a bullish crossover; the green bars continue to grow. Moving averages are bearishly aligned and diverging downward. KDJ is at a low level but not oversold. Bears have the upper hand, and volume is 1.2 times normal. The 4-hour and 30-minute bearish confluence is confirmed.
════════════════════
🟢 $STRC 30-minute bearish signal
⚠️Technical analysis: 4-hour bearish trend plus 30-minute bearish confluence confirmed! The 30-minute MACD falls below the zero line and turns bearish; the moving averages have just formed a bearish alignment, and KDJ is weak, with K crossing below D. Follow the trend with short positions.
════════════════════
🔔 Follow to get the latest market movements 🔔
#多周期共振 #BOME #STRC
📌 When trading, pay attention to whether the candlestick pattern matches
30-minute weakness, 4-hour bearish confirmation, $BOME $STRC multi-timeframe bearish confluence 🔥
════════════════════
🟢 $BOME 30-minute bearish signal
⚠️Technical analysis: 4-hour bearish trend confirmed, with a confluence of 30-minute entry signals! MACD turns down with expanding volume after a bullish crossover; the green bars continue to grow. Moving averages are bearishly aligned and diverging downward. KDJ is at a low level but not oversold. Bears have the upper hand, and volume is 1.2 times normal. The 4-hour and 30-minute bearish confluence is confirmed.
════════════════════
🟢 $STRC 30-minute bearish signal
⚠️Technical analysis: 4-hour bearish trend plus 30-minute bearish confluence confirmed! The 30-minute MACD falls below the zero line and turns bearish; the moving averages have just formed a bearish alignment, and KDJ is weak, with K crossing below D. Follow the trend with short positions.
════════════════════
🔔 Follow to get the latest market movements 🔔
#多周期共振 #BOME #STRC
📌 When trading, pay attention to whether the candlestick pattern matches
════════════════════
🟢 $BOME 30-minute bearish signal
⚠️Technical analysis: 4-hour bearish trend confirmed, with a confluence of 30-minute entry signals! MACD turns down with expanding volume after a bullish crossover; the green bars continue to grow. Moving averages are bearishly aligned and diverging downward. KDJ is at a low level but not oversold. Bears have the upper hand, and volume is 1.2 times normal. The 4-hour and 30-minute bearish confluence is confirmed.
════════════════════
🟢 $STRC 30-minute bearish signal
⚠️Technical analysis: 4-hour bearish trend plus 30-minute bearish confluence confirmed! The 30-minute MACD falls below the zero line and turns bearish; the moving averages have just formed a bearish alignment, and KDJ is weak, with K crossing below D. Follow the trend with short positions.
════════════════════
🔔 Follow to get the latest market movements 🔔
#多周期共振 #BOME #STRC
📌 When trading, pay attention to whether the candlestick pattern matches
10

·
--
$BOME at $0.000564: does 4h RSI at 37 mean bounce zone, or is this meme still bleeding lower? 🤔
Down 7.77% today, with the last 4h down 6.5%. Price sits below the 20d and 50d MAs, while longs are still paying 0.001% funding. Not a great setup.
I’d watch $0.000600. Reclaim it and I get interested. Rejection keeps me sidelined. $BNB is holding up better, making this weakness stand out. Volume is $1.20M, just 1.2x the 20d average. 👀
$0.000600 hold or break, which side are you on? 🔥
#BOME #Altcoin #Trading
$BOME at $0.000564: does 4h RSI at 37 mean bounce zone, or is this meme still bleeding lower? 🤔
Down 7.77% today, with the last 4h down 6.5%. Price sits below the 20d and 50d MAs, while longs are still paying 0.001% funding. Not a great setup.
I’d watch $0.000600. Reclaim it and I get interested. Rejection keeps me sidelined. $BNB is holding up better, making this weakness stand out. Volume is $1.20M, just 1.2x the 20d average. 👀
$0.000600 hold or break, which side are you on? 🔥
#BOME #Altcoin #Trading
Down 7.77% today, with the last 4h down 6.5%. Price sits below the 20d and 50d MAs, while longs are still paying 0.001% funding. Not a great setup.
I’d watch $0.000600. Reclaim it and I get interested. Rejection keeps me sidelined. $BNB is holding up better, making this weakness stand out. Volume is $1.20M, just 1.2x the 20d average. 👀
$0.000600 hold or break, which side are you on? 🔥
#BOME #Altcoin #Trading
15

·
--
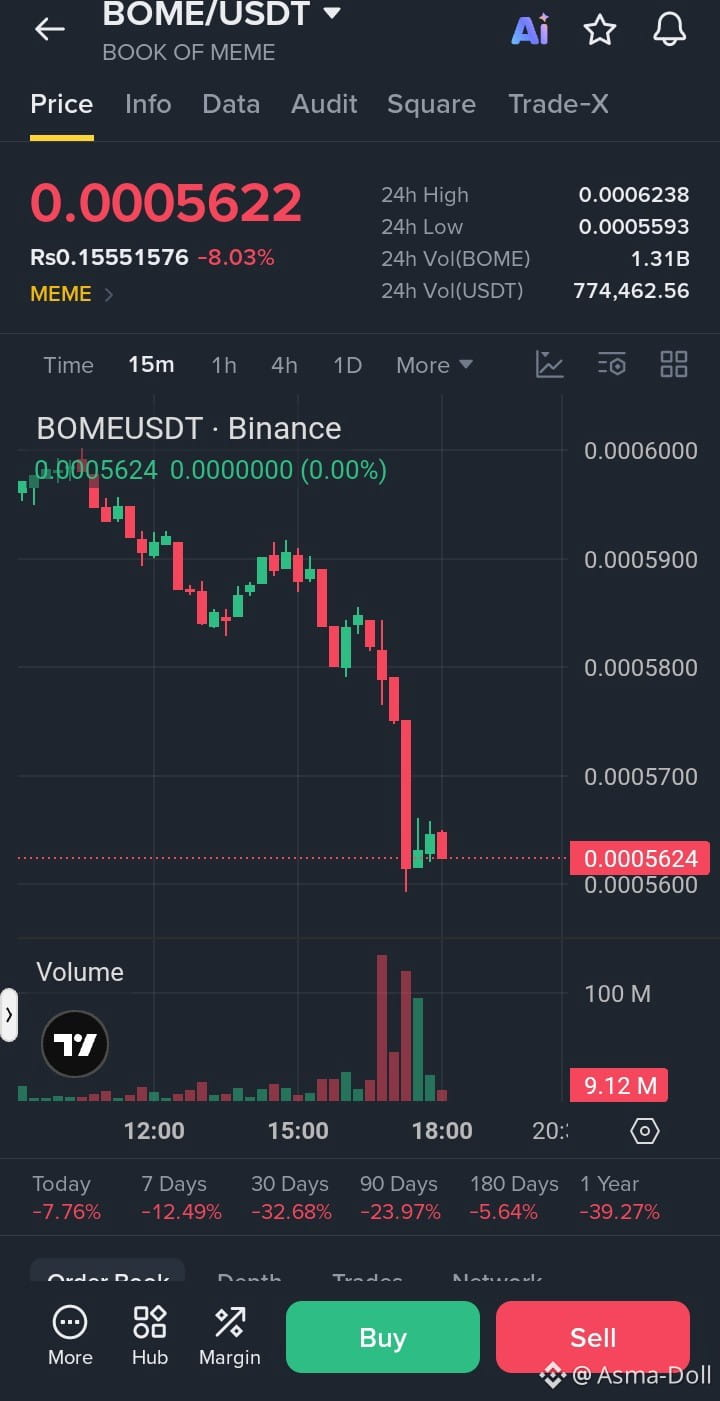
$BOME /USDT – Binance Futures Short Signal

BOOK OF MEME (BOME)
### 0.0005622
-8.03% (24h)
Trade Plan
* Direction: SHORT 📉
* Entry: 0.0005650 – 0.0005750
* Stop Loss: 0.0005900
Take Profit Targets
| Target | Price |
| ------ | --------- |
| TP1 | 0.0005500 |
| TP2 | 0.0005350 |
| TP3 | 0.0005150 |
Trade here $BOME
{future}(BOMEUSDT)
Technical Analysis
* Strong bearish momentum with an 8% daily decline.
* Price trading close to the 24h low (0.0005593).
* 7-day performance: -12.49%.
* 30-day performance: -32.68%.
* Weak buying pressure suggests further downside risk.
* Breakdown below 0.0005590 may accelerate selling.
Confirmation
* Wait for a clean 15m candle close below 0.0005590.
* Retest rejection confirms stronger short momentum.
* Avoid chasing if price drops without a retest.
Risk-to-Reward (approx.)
* TP1: 1:0.8
* TP2: 1:1.6
* TP3: 1:2.7
Risk: High volatility
Use controlled leverage and risk only what you can afford to lose. These are indicative levels based on your supplied snapshot, not verified live prices.
#BOME #BOMEUSDT #BinanceFutures #CryptoShort #TradingSignals
$BOME /USDT – Binance Futures Short Signal

BOOK OF MEME (BOME)
### 0.0005622
-8.03% (24h)
Trade Plan
* Direction: SHORT 📉
* Entry: 0.0005650 – 0.0005750
* Stop Loss: 0.0005900
Take Profit Targets
| Target | Price |
| ------ | --------- |
| TP1 | 0.0005500 |
| TP2 | 0.0005350 |
| TP3 | 0.0005150 |
Trade here $BOME
Technical Analysis
* Strong bearish momentum with an 8% daily decline.
* Price trading close to the 24h low (0.0005593).
* 7-day performance: -12.49%.
* 30-day performance: -32.68%.
* Weak buying pressure suggests further downside risk.
* Breakdown below 0.0005590 may accelerate selling.
Confirmation
* Wait for a clean 15m candle close below 0.0005590.
* Retest rejection confirms stronger short momentum.
* Avoid chasing if price drops without a retest.
Risk-to-Reward (approx.)
* TP1: 1:0.8
* TP2: 1:1.6
* TP3: 1:2.7
Risk: High volatility
Use controlled leverage and risk only what you can afford to lose. These are indicative levels based on your supplied snapshot, not verified live prices.
#BOME #BOMEUSDT #BinanceFutures #CryptoShort #TradingSignals

BOOK OF MEME (BOME)
### 0.0005622
-8.03% (24h)
Trade Plan
* Direction: SHORT 📉
* Entry: 0.0005650 – 0.0005750
* Stop Loss: 0.0005900
Take Profit Targets
| Target | Price |
| ------ | --------- |
| TP1 | 0.0005500 |
| TP2 | 0.0005350 |
| TP3 | 0.0005150 |
Trade here $BOME
Technical Analysis
* Strong bearish momentum with an 8% daily decline.
* Price trading close to the 24h low (0.0005593).
* 7-day performance: -12.49%.
* 30-day performance: -32.68%.
* Weak buying pressure suggests further downside risk.
* Breakdown below 0.0005590 may accelerate selling.
Confirmation
* Wait for a clean 15m candle close below 0.0005590.
* Retest rejection confirms stronger short momentum.
* Avoid chasing if price drops without a retest.
Risk-to-Reward (approx.)
* TP1: 1:0.8
* TP2: 1:1.6
* TP3: 1:2.7
Risk: High volatility
Use controlled leverage and risk only what you can afford to lose. These are indicative levels based on your supplied snapshot, not verified live prices.
#BOME #BOMEUSDT #BinanceFutures #CryptoShort #TradingSignals
1
48

👑QueenBee🐝
BOME TRUE MATHS 🐝👑
FROM $0.000598 → $0.03 = 50.17x
Market Cap at $0.03: $2.07 BILLION
Max Supply: 69 BILLION
No hype, just numbers. Do the maths. 💛
Do you think it is possible?
#BOME #BookOfMeme #CryptoMaths
👑QueenBee🐝
BOME TRUE MATHS 🐝👑
FROM $0.000598 → $0.03 = 50.17x
Market Cap at $0.03: $2.07 BILLION
Max Supply: 69 BILLION
No hype, just numbers. Do the maths. 💛
Do you think it is possible?
#BOME #BookOfMeme #CryptoMaths
BOME TRUE MATHS 🐝👑
FROM $0.000598 → $0.03 = 50.17x
Market Cap at $0.03: $2.07 BILLION
Max Supply: 69 BILLION
No hype, just numbers. Do the maths. 💛
Do you think it is possible?
#BOME #BookOfMeme #CryptoMaths

1
3
1.2k
·
--
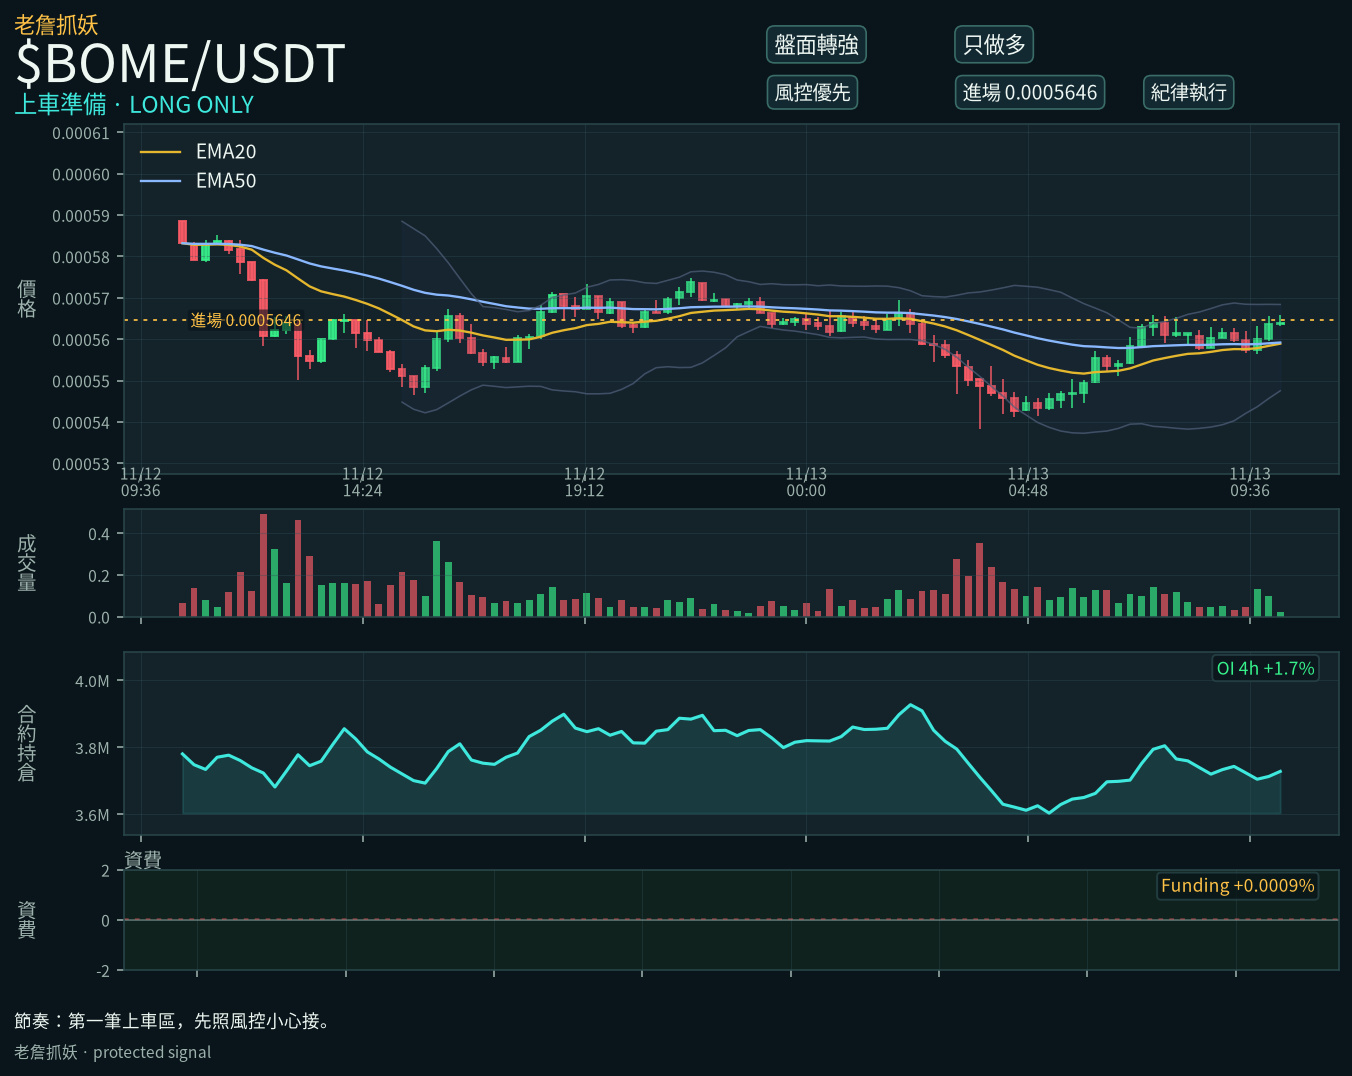
$BOME is hovering near the lows, and buyers are starting to step in
It’s not far from the low of the past two days. The big players haven’t followed suit and chased the price yet, and open interest in futures hasn’t changed much. Trading volume is also still insufficient.
Start with a small position; add more if volume picks up. Exit if it breaks below 0.0004799, and take profit on 30% at 0.0006211.
#BOME #山寨币 #Futures
$BOME is hovering near the lows, and buyers are starting to step in
It’s not far from the low of the past two days. The big players haven’t followed suit and chased the price yet, and open interest in futures hasn’t changed much. Trading volume is also still insufficient.
Start with a small position; add more if volume picks up. Exit if it breaks below 0.0004799, and take profit on 30% at 0.0006211.
#BOME #山寨币 #Futures
It’s not far from the low of the past two days. The big players haven’t followed suit and chased the price yet, and open interest in futures hasn’t changed much. Trading volume is also still insufficient.
Start with a small position; add more if volume picks up. Exit if it breaks below 0.0004799, and take profit on 30% at 0.0006211.
#BOME #山寨币 #Futures
49
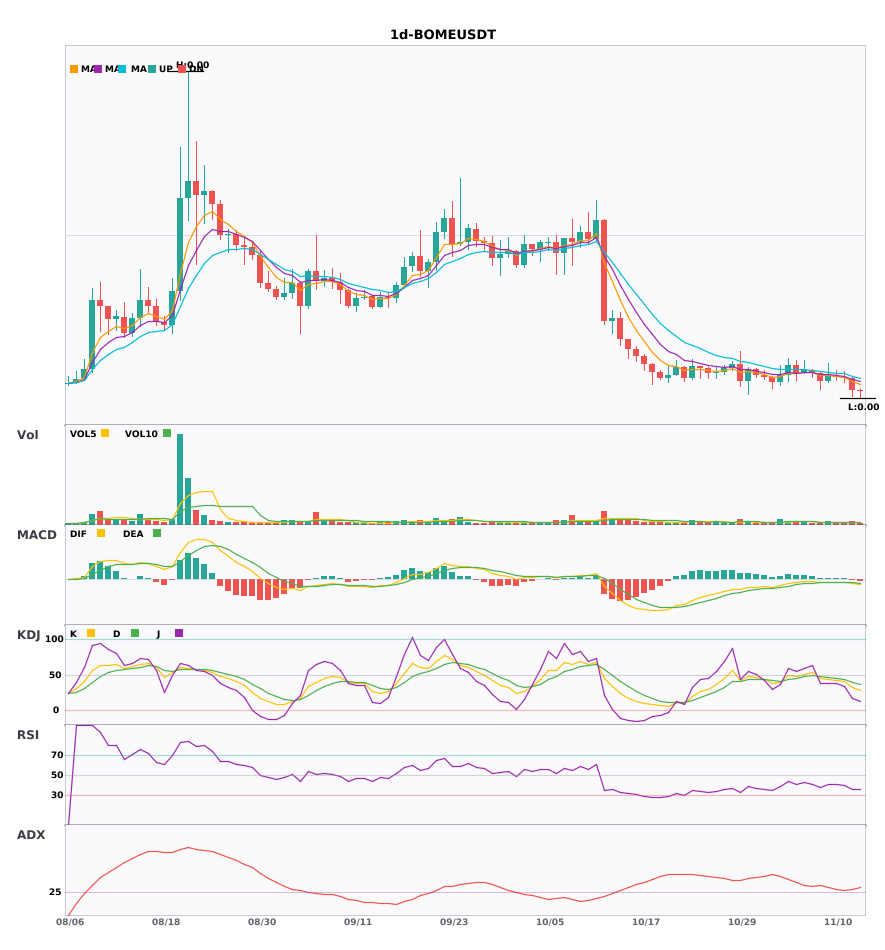
$BOME Daily technical indicators are weakening; watch for correction risk
📉 $BOME | Daily bearish signal
━━━━━━━━━━━━━━━━━━
Technical analysis: ADX(26) indicates a forming trend; participation is possible. MACD has crossed below zero, accelerating the bearish trend. EMAs are bearishly aligned. KDJ is weak (K=32.2/D=39.8). Trading volume is normal (1.2x).
Price change: -6.2100%
━━━━━━━━━━━━━━━━━━
#技术分析 #BOME
📌 The above content is for reference only and does not constitute investment advice.
$BOME Daily technical indicators are weakening; watch for correction risk
📉 $BOME | Daily bearish signal
━━━━━━━━━━━━━━━━━━
Technical analysis: ADX(26) indicates a forming trend; participation is possible. MACD has crossed below zero, accelerating the bearish trend. EMAs are bearishly aligned. KDJ is weak (K=32.2/D=39.8). Trading volume is normal (1.2x).
Price change: -6.2100%
━━━━━━━━━━━━━━━━━━
#技术分析 #BOME
📌 The above content is for reference only and does not constitute investment advice.
📉 $BOME | Daily bearish signal
━━━━━━━━━━━━━━━━━━
Technical analysis: ADX(26) indicates a forming trend; participation is possible. MACD has crossed below zero, accelerating the bearish trend. EMAs are bearishly aligned. KDJ is weak (K=32.2/D=39.8). Trading volume is normal (1.2x).
Price change: -6.2100%
━━━━━━━━━━━━━━━━━━
#技术分析 #BOME
📌 The above content is for reference only and does not constitute investment advice.
13
·
--
$BOME Daily chart weakening, bearish bias; significant short-term pressure 🔥
════════════════════
🟢 $BOME Daily chart bearish signal
⚠️Technical analysis: ADX trend has just formed and can be followed | MACD bearish cross below zero accelerating the downtrend | Moving averages aligned bearishly and trending down | KDJ weak, K below D (32/39) | Volume 1.2x
════════════════════
🔔 Follow for first-hand market movements 🔔
#技术分析 #BOME
📌 When trading, pay attention to whether the candlestick pattern confirms
$BOME Daily chart weakening, bearish bias; significant short-term pressure 🔥
════════════════════
🟢 $BOME Daily chart bearish signal
⚠️Technical analysis: ADX trend has just formed and can be followed | MACD bearish cross below zero accelerating the downtrend | Moving averages aligned bearishly and trending down | KDJ weak, K below D (32/39) | Volume 1.2x
════════════════════
🔔 Follow for first-hand market movements 🔔
#技术分析 #BOME
📌 When trading, pay attention to whether the candlestick pattern confirms
════════════════════
🟢 $BOME Daily chart bearish signal
⚠️Technical analysis: ADX trend has just formed and can be followed | MACD bearish cross below zero accelerating the downtrend | Moving averages aligned bearishly and trending down | KDJ weak, K below D (32/39) | Volume 1.2x
════════════════════
🔔 Follow for first-hand market movements 🔔
#技术分析 #BOME
📌 When trading, pay attention to whether the candlestick pattern confirms
18
·
--
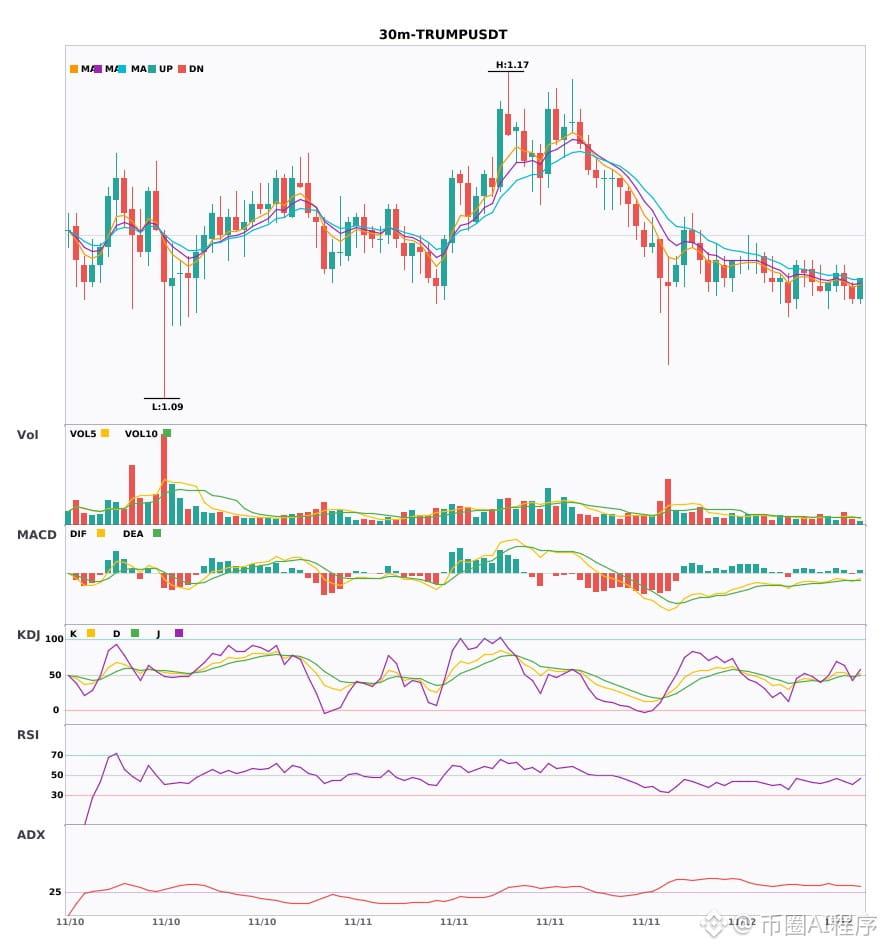
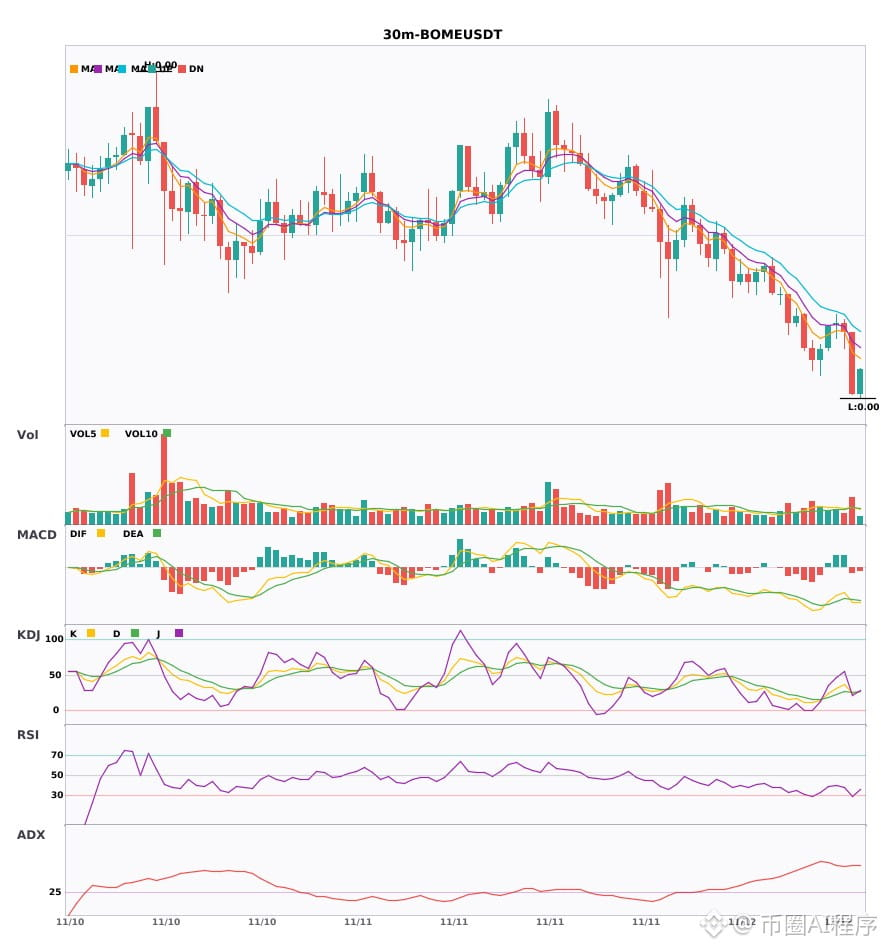
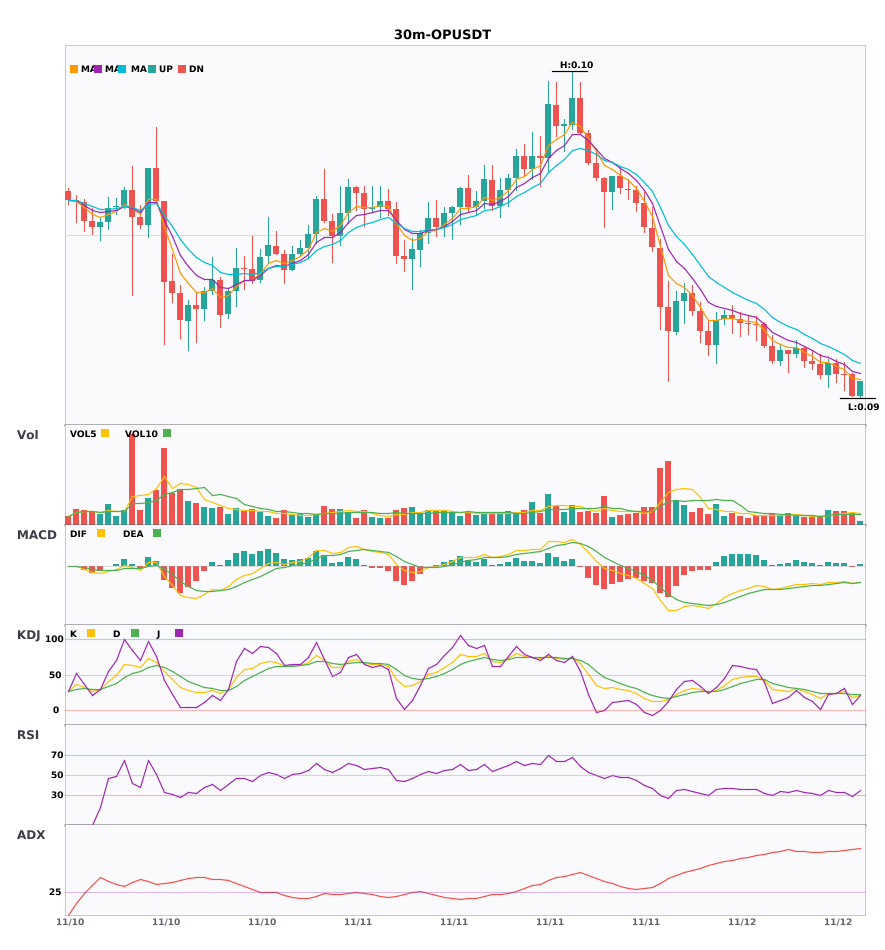
$TRUMP / $BOME / $OP 30-minute bearish + 4-hour bearish alignment; multi-timeframe resonance turns bearish 🔥
════════════════════
🟢 $TRUMP 30-minute bearish signal
⚠️ Technicals: 4-hour bearish resonance confirmed | 30-minute entry: MACD bearish crossover below zero, bearish momentum accelerating | EMA5 < EMA8 < EMA13, bearish alignment | KDJ bearish crossover, short-term bearish (K = 46.2, D = 48.0) | Volume increased (1.6x)
📢 Market update: Senators Warren and Coons urge Trump administration to preserve Nvidia export records - The preservation of Nvidia export records could reshape U.S. export policy, impacting global AI hardware access and national security dynamics. The po...
════════════════════
🟢 $BOME 30-minute bearish signal
⚠️ Technicals: 4-hour bearish resonance confirmed | 30-minute entry: MACD bearish crossover below zero, bearish momentum accelerating | EMA5 < EMA8 < EMA13, bearish alignment | KDJ bearish crossover, short-term bearish (K = 24.3, D = 26.1) | Volume increased (1.6x)
════════════════════
🟢 $OP 30-minute bearish signal
⚠️ Technicals: 4-hour bearish resonance confirmed | 30-minute entry: MACD bearish crossover below zero, bearish momentum accelerating | EMA5 < EMA8 < EMA13, bearish alignment | KDJ bearish crossover, short-term bearish (K = 17.8, D = 22.5) | Volume normal (1.3x)
════════════════════
🔔 Follow for first-hand market alerts 🔔
#多周期共振 #TRUMP #BOME #OP
📌 When trading, pay attention to whether the candlestick pattern meets the criteria
$TRUMP / $BOME / $OP 30-minute bearish + 4-hour bearish alignment; multi-timeframe resonance turns bearish 🔥
════════════════════
🟢 $TRUMP 30-minute bearish signal
⚠️ Technicals: 4-hour bearish resonance confirmed | 30-minute entry: MACD bearish crossover below zero, bearish momentum accelerating | EMA5 < EMA8 < EMA13, bearish alignment | KDJ bearish crossover, short-term bearish (K = 46.2, D = 48.0) | Volume increased (1.6x)
📢 Market update: Senators Warren and Coons urge Trump administration to preserve Nvidia export records - The preservation of Nvidia export records could reshape U.S. export policy, impacting global AI hardware access and national security dynamics. The po...
════════════════════
🟢 $BOME 30-minute bearish signal
⚠️ Technicals: 4-hour bearish resonance confirmed | 30-minute entry: MACD bearish crossover below zero, bearish momentum accelerating | EMA5 < EMA8 < EMA13, bearish alignment | KDJ bearish crossover, short-term bearish (K = 24.3, D = 26.1) | Volume increased (1.6x)
════════════════════
🟢 $OP 30-minute bearish signal
⚠️ Technicals: 4-hour bearish resonance confirmed | 30-minute entry: MACD bearish crossover below zero, bearish momentum accelerating | EMA5 < EMA8 < EMA13, bearish alignment | KDJ bearish crossover, short-term bearish (K = 17.8, D = 22.5) | Volume normal (1.3x)
════════════════════
🔔 Follow for first-hand market alerts 🔔
#多周期共振 #TRUMP #BOME #OP
📌 When trading, pay attention to whether the candlestick pattern meets the criteria
════════════════════
🟢 $TRUMP 30-minute bearish signal
⚠️ Technicals: 4-hour bearish resonance confirmed | 30-minute entry: MACD bearish crossover below zero, bearish momentum accelerating | EMA5 < EMA8 < EMA13, bearish alignment | KDJ bearish crossover, short-term bearish (K = 46.2, D = 48.0) | Volume increased (1.6x)
📢 Market update: Senators Warren and Coons urge Trump administration to preserve Nvidia export records - The preservation of Nvidia export records could reshape U.S. export policy, impacting global AI hardware access and national security dynamics. The po...
════════════════════
🟢 $BOME 30-minute bearish signal
⚠️ Technicals: 4-hour bearish resonance confirmed | 30-minute entry: MACD bearish crossover below zero, bearish momentum accelerating | EMA5 < EMA8 < EMA13, bearish alignment | KDJ bearish crossover, short-term bearish (K = 24.3, D = 26.1) | Volume increased (1.6x)
════════════════════
🟢 $OP 30-minute bearish signal
⚠️ Technicals: 4-hour bearish resonance confirmed | 30-minute entry: MACD bearish crossover below zero, bearish momentum accelerating | EMA5 < EMA8 < EMA13, bearish alignment | KDJ bearish crossover, short-term bearish (K = 17.8, D = 22.5) | Volume normal (1.3x)
════════════════════
🔔 Follow for first-hand market alerts 🔔
#多周期共振 #TRUMP #BOME #OP
📌 When trading, pay attention to whether the candlestick pattern meets the criteria
16
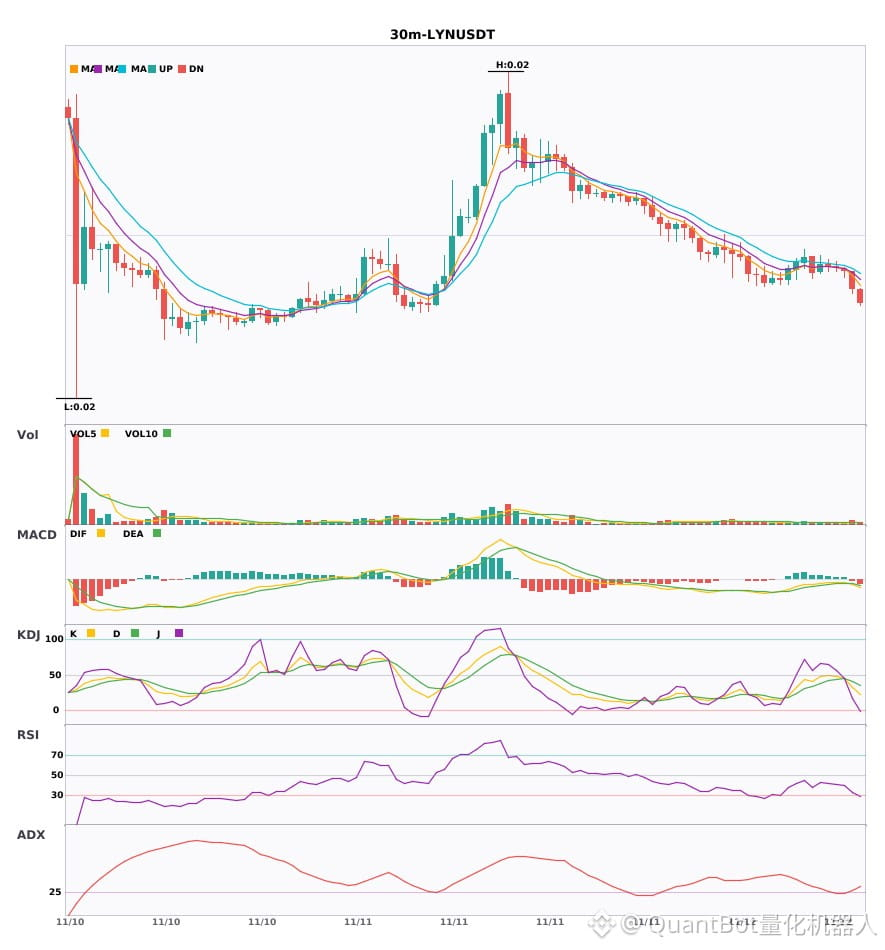
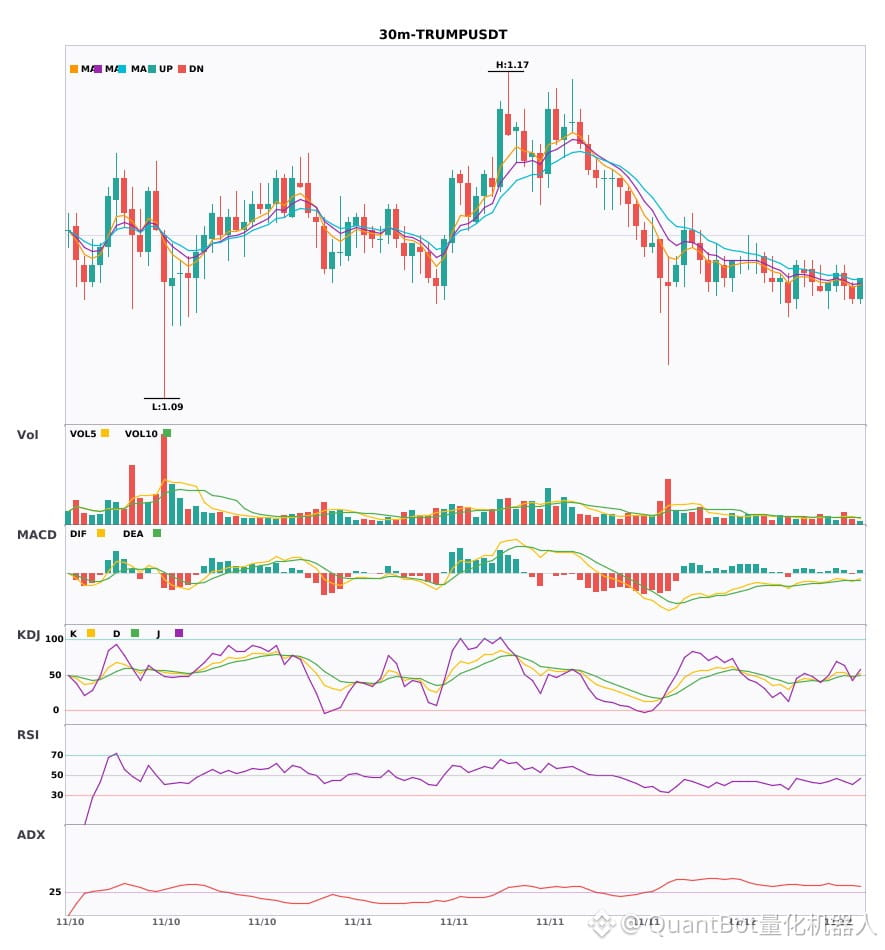
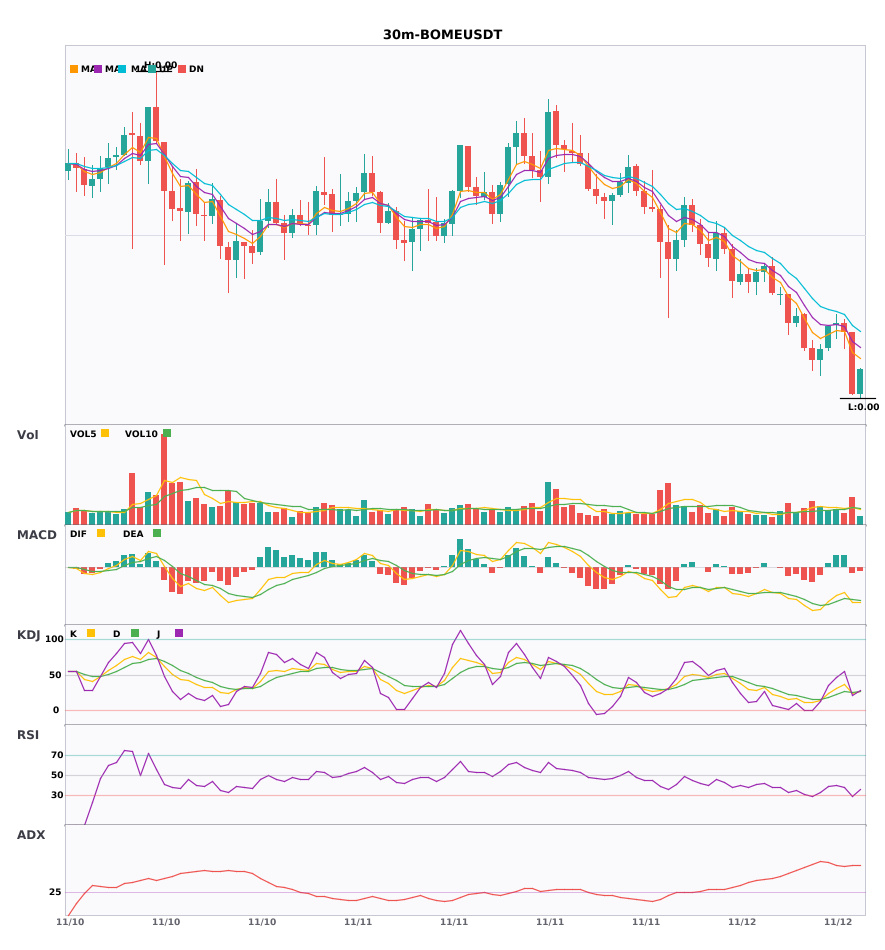
$LYN / $TRUMP / $BOME Bearish on the 30-minute timeframe, under short-term pressure
📉 $LYN | 30-minute bearish signal
━━━━━━━━━━━━━━━━━━
Technical analysis: ADX(26) Trend is forming; participation is possible | MACD bearish crossover below zero, bearish momentum accelerating | EMA5 < EMA8 < EMA13, bearish alignment | KDJ bearish crossover, bearish short-term outlook (K: 32.8, D: 40.6) | Volume increased (2.0x)
Price change: -1.4500%
📉 $TRUMP | 30-minute bearish signal
━━━━━━━━━━━━━━━━━━
Technical analysis: ADX(32) Clear trending market | MACD bearish crossover below zero, bearish momentum accelerating | EMA5 < EMA8 < EMA13, bearish alignment | KDJ bearish crossover, bearish short-term outlook (K: 46.2, D: 48.0) | Volume increased (1.6x)
Price change: -0.2700%
📌 Market update: Senators Warren and Coons urge Trump administration to preserve Nvidia export records - The preservation of Nvidia export records could reshape U.S. export policy, impacting global AI hardware access and national security dynamics. The po...
📉 $BOME | 30-minute bearish signal
━━━━━━━━━━━━━━━━━━
Technical analysis: ADX(56) Very strong trend (beware of a potentially overheated pullback) | MACD bearish crossover below zero, bearish momentum accelerating | EMA5 < EMA8 < EMA13, bearish alignment | KDJ bearish crossover, bearish short-term outlook (K: 24.3, D: 26.1) | Volume increased (1.6x)
Price change: -1.5800%
━━━━━━━━━━━━━━━━━━
#技术分析 #LYN #TRUMP #BOME
📌 The above content is for reference only and does not constitute investment advice
$LYN / $TRUMP / $BOME Bearish on the 30-minute timeframe, under short-term pressure
📉 $LYN | 30-minute bearish signal
━━━━━━━━━━━━━━━━━━
Technical analysis: ADX(26) Trend is forming; participation is possible | MACD bearish crossover below zero, bearish momentum accelerating | EMA5 < EMA8 < EMA13, bearish alignment | KDJ bearish crossover, bearish short-term outlook (K: 32.8, D: 40.6) | Volume increased (2.0x)
Price change: -1.4500%
📉 $TRUMP | 30-minute bearish signal
━━━━━━━━━━━━━━━━━━
Technical analysis: ADX(32) Clear trending market | MACD bearish crossover below zero, bearish momentum accelerating | EMA5 < EMA8 < EMA13, bearish alignment | KDJ bearish crossover, bearish short-term outlook (K: 46.2, D: 48.0) | Volume increased (1.6x)
Price change: -0.2700%
📌 Market update: Senators Warren and Coons urge Trump administration to preserve Nvidia export records - The preservation of Nvidia export records could reshape U.S. export policy, impacting global AI hardware access and national security dynamics. The po...
📉 $BOME | 30-minute bearish signal
━━━━━━━━━━━━━━━━━━
Technical analysis: ADX(56) Very strong trend (beware of a potentially overheated pullback) | MACD bearish crossover below zero, bearish momentum accelerating | EMA5 < EMA8 < EMA13, bearish alignment | KDJ bearish crossover, bearish short-term outlook (K: 24.3, D: 26.1) | Volume increased (1.6x)
Price change: -1.5800%
━━━━━━━━━━━━━━━━━━
#技术分析 #LYN #TRUMP #BOME
📌 The above content is for reference only and does not constitute investment advice
📉 $LYN | 30-minute bearish signal
━━━━━━━━━━━━━━━━━━
Technical analysis: ADX(26) Trend is forming; participation is possible | MACD bearish crossover below zero, bearish momentum accelerating | EMA5 < EMA8 < EMA13, bearish alignment | KDJ bearish crossover, bearish short-term outlook (K: 32.8, D: 40.6) | Volume increased (2.0x)
Price change: -1.4500%
📉 $TRUMP | 30-minute bearish signal
━━━━━━━━━━━━━━━━━━
Technical analysis: ADX(32) Clear trending market | MACD bearish crossover below zero, bearish momentum accelerating | EMA5 < EMA8 < EMA13, bearish alignment | KDJ bearish crossover, bearish short-term outlook (K: 46.2, D: 48.0) | Volume increased (1.6x)
Price change: -0.2700%
📌 Market update: Senators Warren and Coons urge Trump administration to preserve Nvidia export records - The preservation of Nvidia export records could reshape U.S. export policy, impacting global AI hardware access and national security dynamics. The po...
📉 $BOME | 30-minute bearish signal
━━━━━━━━━━━━━━━━━━
Technical analysis: ADX(56) Very strong trend (beware of a potentially overheated pullback) | MACD bearish crossover below zero, bearish momentum accelerating | EMA5 < EMA8 < EMA13, bearish alignment | KDJ bearish crossover, bearish short-term outlook (K: 24.3, D: 26.1) | Volume increased (1.6x)
Price change: -1.5800%
━━━━━━━━━━━━━━━━━━
#技术分析 #LYN #TRUMP #BOME
📌 The above content is for reference only and does not constitute investment advice
12
·
--
$LYN / $TRUMP / $BOME 30-minute technical indicators are weakening simultaneously; beware of risk 🔥
════════════════════
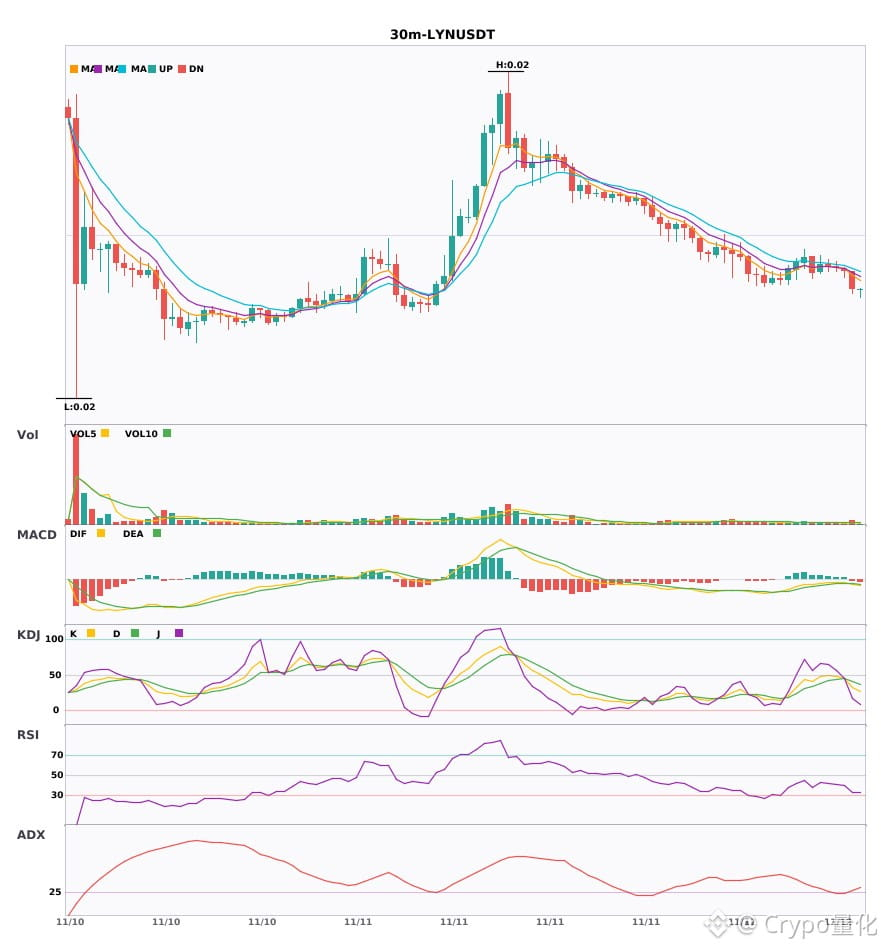
🟢 $LYN 30-minute bearish signal
⚠️Technical: ADX(26) Trend is forming; potential to participate | MACD bearish cross below zero, bearish momentum accelerating | EMA5 < EMA8 < EMA13, bearish alignment | KDJ bearish cross, short-term outlook bearish (K=32.8, D=40.6) | Volume increased (2.0x)
════════════════════
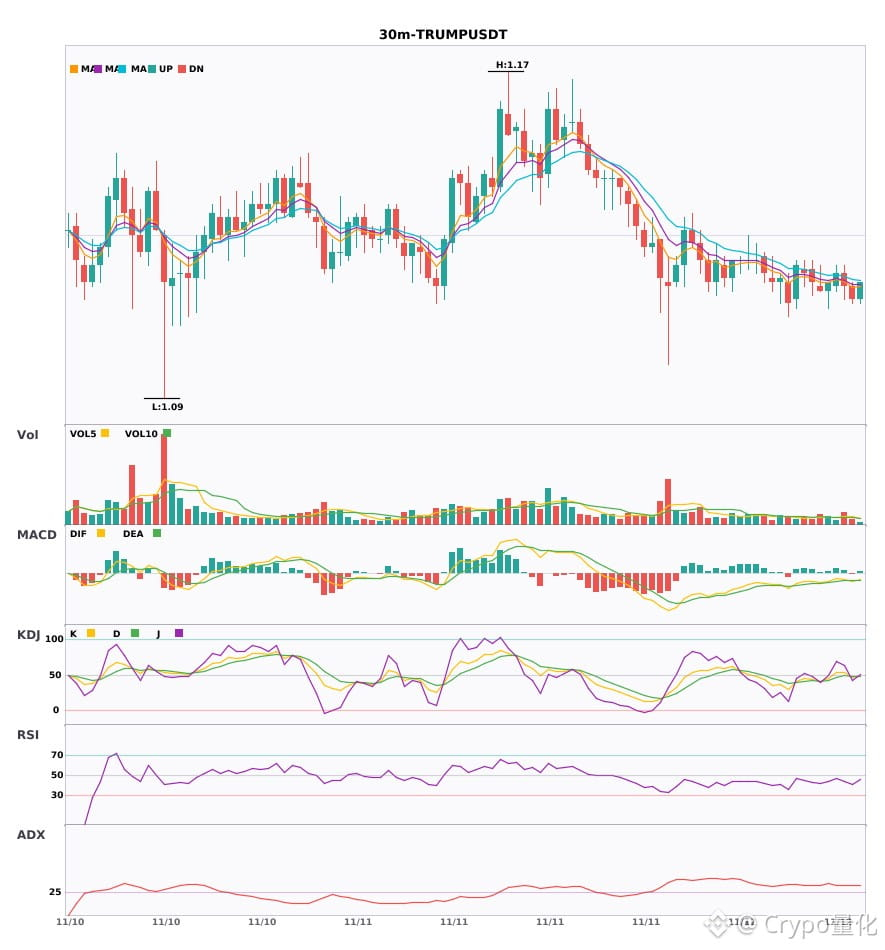
🟢 $TRUMP 30-minute bearish signal
⚠️Technical: ADX(32) Clear trending market | MACD bearish cross below zero, bearish momentum accelerating | EMA5 < EMA8 < EMA13, bearish alignment | KDJ bearish cross, short-term outlook bearish (K=46.2, D=48.0) | Volume increased (1.6x)
📢Market update: Senators Warren and Coons urge Trump administration to preserve Nvidia export records - The preservation of Nvidia export records could reshape U.S. export policy, impacting global AI hardware access and national security dynamics. The po...
════════════════════
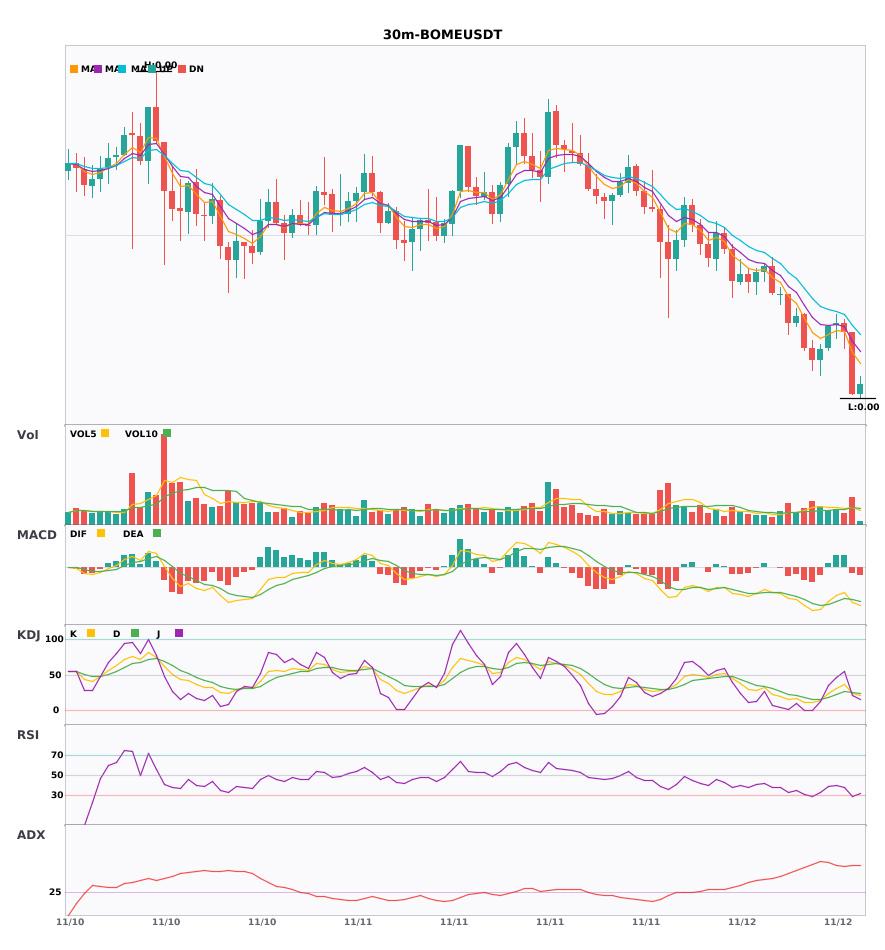
🟢 $BOME 30-minute bearish signal
⚠️Technical: ADX(56) Very strong trend (beware of an overbought pullback) | MACD bearish cross below zero, bearish momentum accelerating | EMA5 < EMA8 < EMA13, bearish alignment | KDJ bearish cross, short-term outlook bearish (K=24.3, D=26.1) | Volume increased (1.6x)
════════════════════
🔔 Follow for first-hand market updates 🔔
#技术分析 #LYN #TRUMP #BOME
📌 When trading, pay attention to whether the candlestick pattern confirms the signal
$LYN / $TRUMP / $BOME 30-minute technical indicators are weakening simultaneously; beware of risk 🔥
════════════════════
🟢 $LYN 30-minute bearish signal
⚠️Technical: ADX(26) Trend is forming; potential to participate | MACD bearish cross below zero, bearish momentum accelerating | EMA5 < EMA8 < EMA13, bearish alignment | KDJ bearish cross, short-term outlook bearish (K=32.8, D=40.6) | Volume increased (2.0x)
════════════════════
🟢 $TRUMP 30-minute bearish signal
⚠️Technical: ADX(32) Clear trending market | MACD bearish cross below zero, bearish momentum accelerating | EMA5 < EMA8 < EMA13, bearish alignment | KDJ bearish cross, short-term outlook bearish (K=46.2, D=48.0) | Volume increased (1.6x)
📢Market update: Senators Warren and Coons urge Trump administration to preserve Nvidia export records - The preservation of Nvidia export records could reshape U.S. export policy, impacting global AI hardware access and national security dynamics. The po...
════════════════════
🟢 $BOME 30-minute bearish signal
⚠️Technical: ADX(56) Very strong trend (beware of an overbought pullback) | MACD bearish cross below zero, bearish momentum accelerating | EMA5 < EMA8 < EMA13, bearish alignment | KDJ bearish cross, short-term outlook bearish (K=24.3, D=26.1) | Volume increased (1.6x)
════════════════════
🔔 Follow for first-hand market updates 🔔
#技术分析 #LYN #TRUMP #BOME
📌 When trading, pay attention to whether the candlestick pattern confirms the signal
════════════════════
🟢 $LYN 30-minute bearish signal
⚠️Technical: ADX(26) Trend is forming; potential to participate | MACD bearish cross below zero, bearish momentum accelerating | EMA5 < EMA8 < EMA13, bearish alignment | KDJ bearish cross, short-term outlook bearish (K=32.8, D=40.6) | Volume increased (2.0x)
════════════════════
🟢 $TRUMP 30-minute bearish signal
⚠️Technical: ADX(32) Clear trending market | MACD bearish cross below zero, bearish momentum accelerating | EMA5 < EMA8 < EMA13, bearish alignment | KDJ bearish cross, short-term outlook bearish (K=46.2, D=48.0) | Volume increased (1.6x)
📢Market update: Senators Warren and Coons urge Trump administration to preserve Nvidia export records - The preservation of Nvidia export records could reshape U.S. export policy, impacting global AI hardware access and national security dynamics. The po...
════════════════════
🟢 $BOME 30-minute bearish signal
⚠️Technical: ADX(56) Very strong trend (beware of an overbought pullback) | MACD bearish cross below zero, bearish momentum accelerating | EMA5 < EMA8 < EMA13, bearish alignment | KDJ bearish cross, short-term outlook bearish (K=24.3, D=26.1) | Volume increased (1.6x)
════════════════════
🔔 Follow for first-hand market updates 🔔
#技术分析 #LYN #TRUMP #BOME
📌 When trading, pay attention to whether the candlestick pattern confirms the signal
16
Log in to explore more content
Join global crypto users on Binance Square
⚡️ Get latest and useful information about crypto.
💬 Trusted by the world’s largest crypto exchange.
👍 Discover real insights from verified creators.
Email / Phone number
Trending Topics
1
#NvidiaBeatsEstimatesWith$130BQ4Outlook
7,115 views
116 Discussing
2
#AnthropicIPOPriceCouldExceed$80
13,001 views
114 Discussing
3
#CanNvidia’sDataCenterGrowthContinue?
37,426 views
532 Discussing
4
#CanadaAndUSLaunchOperationNiagaraAgainstApprovalPhishing
39 views
7 Discussing
5
#BankOfEnglandUnveilsClearingHousePathwayCoveringDLTFirms
1,217 views
22 Discussing
6
#DBSAndCirclePartnerToExpandAsianInstitutionsUSDCAccess
2,606 views
43 Discussing
7
#LedgerHardwareImplantReportsExtendToDubai
8,084 views
178 Discussing
8
#NvidiaBoardNotConsideringHuang’sReturnasCEO
200,558 views
1,455 Discussing
9
#KOSPIFalls2.59%ToLowestCloseSinceFebruary
56,773 views
643 Discussing
10
#AnthropicClearedToListOnNasdaqAsANT
50,108 views
518 Discussing