
#bncb
bncb
88,193 views
756 Discussing
Hot
Latest


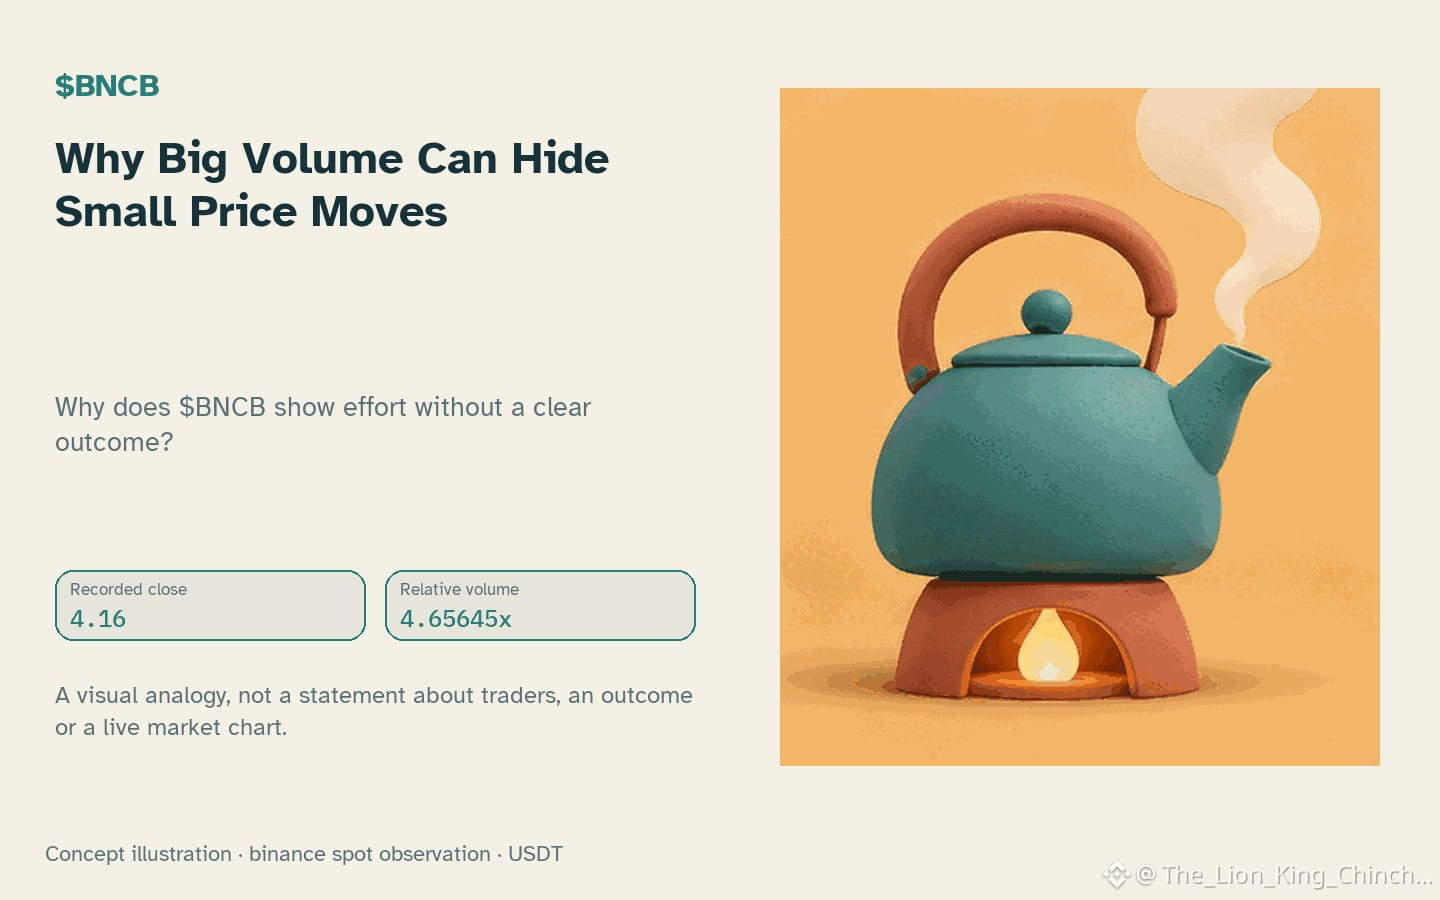
$BNCB: Why Big Volume Can Hide Small Price Moves
Why does $BNCB show effort without a clear outcome?
Current data: relative volume 4.66x baseline with RSI 21.8. The direction is down.
###
High volume often looks like a sure sign that a range will break. This is a misconception because volume measures the amount of trading, not the net force behind the price.
Think of a tug-of-war where both teams pull with great strength but the rope stays still. The effort is evident, yet the position does not move. Cryptocurrency charts can look similar. Lots of trades execute, but the final candle closes near where it opened. Indicators like the MACD -0.0384207 and MACD signal -0.0242251 might not show a strong directional pull, suggesting the market is not deciding quickly.
This is a hypothetical mechanism, not proof that someone is trying to trap anyone. It is a way to think about how trade size and price motion can disagree. The fact that the price is inside the recorded range supports this setup.
A counterexample: if candles later close firmly below the support level 4.14 with high volume, the absorption idea fails because the price is moving decisively.
To reassess this, watch for a closed candle that proves one side has won the tug-of-war. Until that happens, the setup remains a moment of balance rather than a break.
Probabilistic market research, not a recommendation or guaranteed return.
#BNCB #CryptoLearning
$BNCB : Why Big Volume Can Hide Small Price Moves
Why does $BNCB show effort without a clear outcome?
Current data: relative volume 4.66x baseline with RSI 21.8. The direction is down.
###
High volume often looks like a sure sign that a range will break. This is a misconception because volume measures the amount of trading, not the net force behind the price.
Think of a tug-of-war where both teams pull with great strength but the rope stays still. The effort is evident, yet the position does not move. Cryptocurrency charts can look similar. Lots of trades execute, but the final candle closes near where it opened. Indicators like the MACD -0.0384207 and MACD signal -0.0242251 might not show a strong directional pull, suggesting the market is not deciding quickly.
This is a hypothetical mechanism, not proof that someone is trying to trap anyone. It is a way to think about how trade size and price motion can disagree. The fact that the price is inside the recorded range supports this setup.
A counterexample: if candles later close firmly below the support level 4.14 with high volume, the absorption idea fails because the price is moving decisively.
To reassess this, watch for a closed candle that proves one side has won the tug-of-war. Until that happens, the setup remains a moment of balance rather than a break.
Probabilistic market research, not a recommendation or guaranteed return.
#BNCB #CryptoLearning
Why does $BNCB show effort without a clear outcome?
Current data: relative volume 4.66x baseline with RSI 21.8. The direction is down.
###
High volume often looks like a sure sign that a range will break. This is a misconception because volume measures the amount of trading, not the net force behind the price.
Think of a tug-of-war where both teams pull with great strength but the rope stays still. The effort is evident, yet the position does not move. Cryptocurrency charts can look similar. Lots of trades execute, but the final candle closes near where it opened. Indicators like the MACD -0.0384207 and MACD signal -0.0242251 might not show a strong directional pull, suggesting the market is not deciding quickly.
This is a hypothetical mechanism, not proof that someone is trying to trap anyone. It is a way to think about how trade size and price motion can disagree. The fact that the price is inside the recorded range supports this setup.
A counterexample: if candles later close firmly below the support level 4.14 with high volume, the absorption idea fails because the price is moving decisively.
To reassess this, watch for a closed candle that proves one side has won the tug-of-war. Until that happens, the setup remains a moment of balance rather than a break.
Probabilistic market research, not a recommendation or guaranteed return.
#BNCB #CryptoLearning
33

·
--

Article
A trap many people fall into. *
You bought $BNB and found yourself holding #BNCB?You’re not alone. This is one of the most common mistakes these days, and one letter is to blame.
What happened?
A lot of people go to buy $BNB, which is worth around $644.
She types BNB into the search bar and picks the first result.
Then she’s surprised to find she bought $BNB NCB, which is worth around $4.29.
There’s a huge difference between them, and it’s not just the name.
What is BNB?
A trap many people fall into. * You bought $BNB and found yourself holding #BNCB?
You’re not alone. This is one of the most common mistakes these days, and one letter is to blame.
What happened?
A lot of people go to buy $BNB , which is worth around $644.
She types BNB into the search bar and picks the first result.
Then she’s surprised to find she bought $BNB NCB, which is worth around $4.29.
There’s a huge difference between them, and it’s not just the name.
What is BNB?
What happened?
A lot of people go to buy $BNB , which is worth around $644.
She types BNB into the search bar and picks the first result.
Then she’s surprised to find she bought $BNB NCB, which is worth around $4.29.
There’s a huge difference between them, and it’s not just the name.
What is BNB?
Abu Fahadأ:
💛
1
3
1.1k

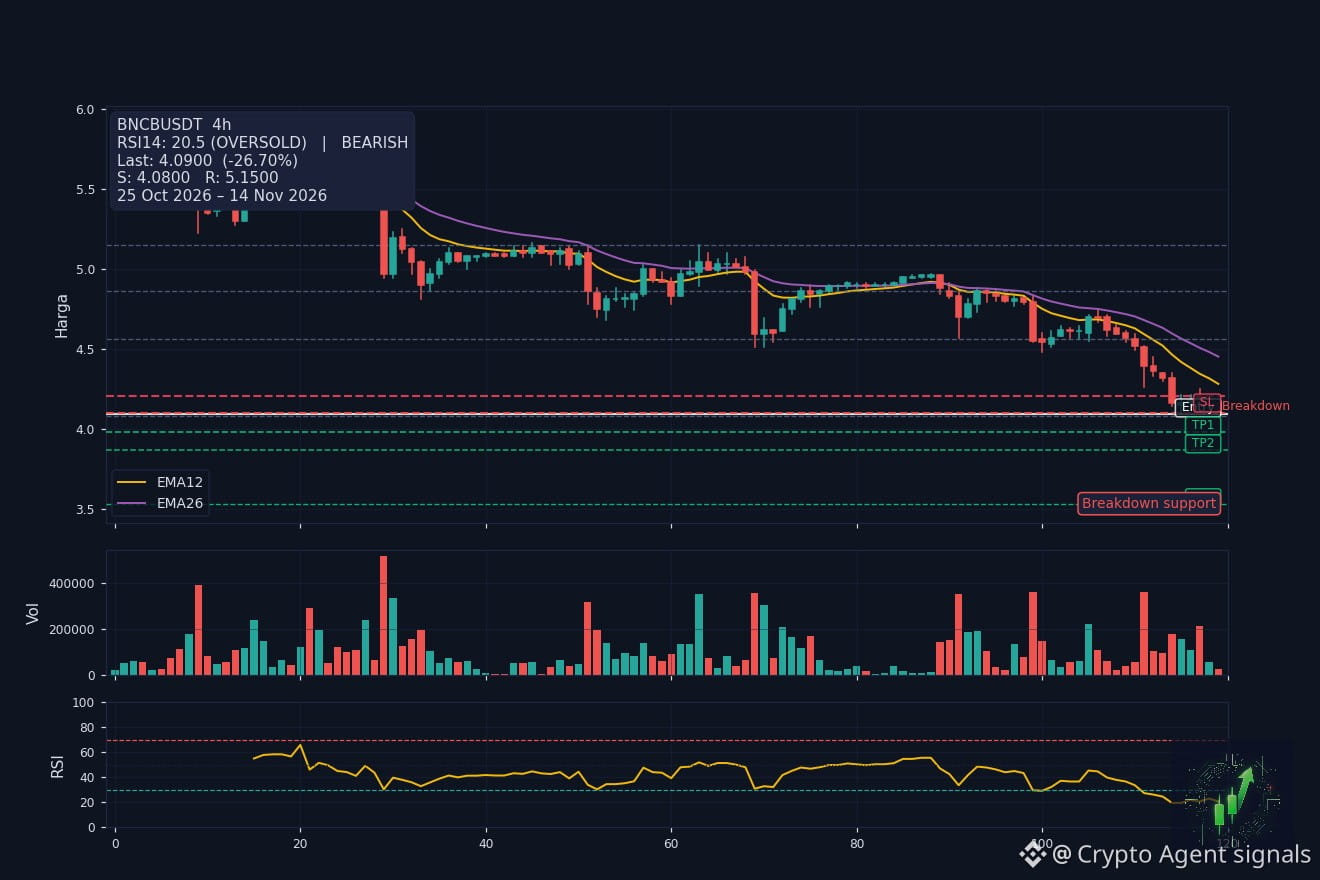
$BNCB 4h — SHORT Signal 🔴
Confluence: 14/14 indicators.
RSI 20.5 oversold — potential upward bounce; MACD histogram negative, bearish (-0.0309028); price below EMA26 4h (4.4511); 1h trend aligned downward; MTF: 8 of 8 TFs aligned downward; Bollinger position: middle band; holding at support 4.0800.
Chart pattern: Support breakdown [bearish].
Support 4.0800 | Resistance 4.5591
Entry: 4.0900
SL: 4.2021
TP1: 3.9779
TP2: 3.8657
TP3: 3.5293
Risk:Reward TP2 = 1:2.0
Leverage (isolated): safe 7x, maximum 14x.
$BNCB #BNCB #Crypto
Not financial advice. Always DYOR.
$BNCB 4h — SHORT Signal 🔴
Confluence: 14/14 indicators.
RSI 20.5 oversold — potential upward bounce; MACD histogram negative, bearish (-0.0309028); price below EMA26 4h (4.4511); 1h trend aligned downward; MTF: 8 of 8 TFs aligned downward; Bollinger position: middle band; holding at support 4.0800.
Chart pattern: Support breakdown [bearish].
Support 4.0800 | Resistance 4.5591
Entry: 4.0900
SL: 4.2021
TP1: 3.9779
TP2: 3.8657
TP3: 3.5293
Risk:Reward TP2 = 1:2.0
Leverage (isolated): safe 7x, maximum 14x.
$BNCB #BNCB #Crypto
Not financial advice. Always DYOR.
Confluence: 14/14 indicators.
RSI 20.5 oversold — potential upward bounce; MACD histogram negative, bearish (-0.0309028); price below EMA26 4h (4.4511); 1h trend aligned downward; MTF: 8 of 8 TFs aligned downward; Bollinger position: middle band; holding at support 4.0800.
Chart pattern: Support breakdown [bearish].
Support 4.0800 | Resistance 4.5591
Entry: 4.0900
SL: 4.2021
TP1: 3.9779
TP2: 3.8657
TP3: 3.5293
Risk:Reward TP2 = 1:2.0
Leverage (isolated): safe 7x, maximum 14x.
$BNCB #BNCB #Crypto
Not financial advice. Always DYOR.
11

$BNCB 🤑🤑🤑
Bridging Traditional Finance and Crypto: What is $BNCB? 🚀
Have you been tracking the Real-World Asset (RWA) trend on Binance? Let’s talk about $BNCB (BNB Standard Corporation Tokenized bStocks)—a token bringing traditional equity exposure directly to the blockchain! [1, 2]
Why icatching traders' attention?
🔹 1:1 Equity Backing:provides economic exposure to CEA Industries, fully backed by underlying equity held at a US-regulated broker-dealer.
🔹 24/7 Trading: Unlike traditional stock markets with fixed hours, trades around the clock on Binance Spot (BNCB/USDT).
🔹 Real Utility: Holders get exposure to price movements, potential dividends, and 1:1 conversion rights to the underlying share.
🔹 Growing RWA Narrative: As tokenized stocks gain momentum in the crypto space, #stands out with solid liquidity and strong market interest. [1, 2, 3]
Current Market Snapshot:
Trading Range: ~$4.50 – $5.00
All-Time High: ~$7.13
Sector: Tokenized Stocks / RWA [1, 2, 3, 4]
Are you bullish on Tokenized Stocks this cycle, or are you sticking to traditional altcoins? Drop your thoughts below! 👇
Disclaimer: This post is for informational purposes only and not financial advice. Always Do Your Own Research (DYOR) before investing.
#BNCB #RWA #TokenizedStocks #BinanceSquare #CryptoTrading #
$BNCB 🤑🤑🤑
Bridging Traditional Finance and Crypto: What is $BNCB ? 🚀
Have you been tracking the Real-World Asset (RWA) trend on Binance? Let’s talk about $BNCB (BNB Standard Corporation Tokenized bStocks)—a token bringing traditional equity exposure directly to the blockchain! [1, 2]
Why icatching traders' attention?
🔹 1:1 Equity Backing:provides economic exposure to CEA Industries, fully backed by underlying equity held at a US-regulated broker-dealer.
🔹 24/7 Trading: Unlike traditional stock markets with fixed hours, trades around the clock on Binance Spot (BNCB/USDT).
🔹 Real Utility: Holders get exposure to price movements, potential dividends, and 1:1 conversion rights to the underlying share.
🔹 Growing RWA Narrative: As tokenized stocks gain momentum in the crypto space, #stands out with solid liquidity and strong market interest. [1, 2, 3]
Current Market Snapshot:
Trading Range: ~$4.50 – $5.00
All-Time High: ~$7.13
Sector: Tokenized Stocks / RWA [1, 2, 3, 4]
Are you bullish on Tokenized Stocks this cycle, or are you sticking to traditional altcoins? Drop your thoughts below! 👇
Disclaimer: This post is for informational purposes only and not financial advice. Always Do Your Own Research (DYOR) before investing.
#BNCB #RWA #TokenizedStocks #BinanceSquare #CryptoTrading #
Bridging Traditional Finance and Crypto: What is $BNCB ? 🚀
Have you been tracking the Real-World Asset (RWA) trend on Binance? Let’s talk about $BNCB (BNB Standard Corporation Tokenized bStocks)—a token bringing traditional equity exposure directly to the blockchain! [1, 2]
Why icatching traders' attention?
🔹 1:1 Equity Backing:provides economic exposure to CEA Industries, fully backed by underlying equity held at a US-regulated broker-dealer.
🔹 24/7 Trading: Unlike traditional stock markets with fixed hours, trades around the clock on Binance Spot (BNCB/USDT).
🔹 Real Utility: Holders get exposure to price movements, potential dividends, and 1:1 conversion rights to the underlying share.
🔹 Growing RWA Narrative: As tokenized stocks gain momentum in the crypto space, #stands out with solid liquidity and strong market interest. [1, 2, 3]
Current Market Snapshot:
Trading Range: ~$4.50 – $5.00
All-Time High: ~$7.13
Sector: Tokenized Stocks / RWA [1, 2, 3, 4]
Are you bullish on Tokenized Stocks this cycle, or are you sticking to traditional altcoins? Drop your thoughts below! 👇
Disclaimer: This post is for informational purposes only and not financial advice. Always Do Your Own Research (DYOR) before investing.
#BNCB #RWA #TokenizedStocks #BinanceSquare #CryptoTrading #
1
660
$BNCB: Assessing Action Across Price Tiers
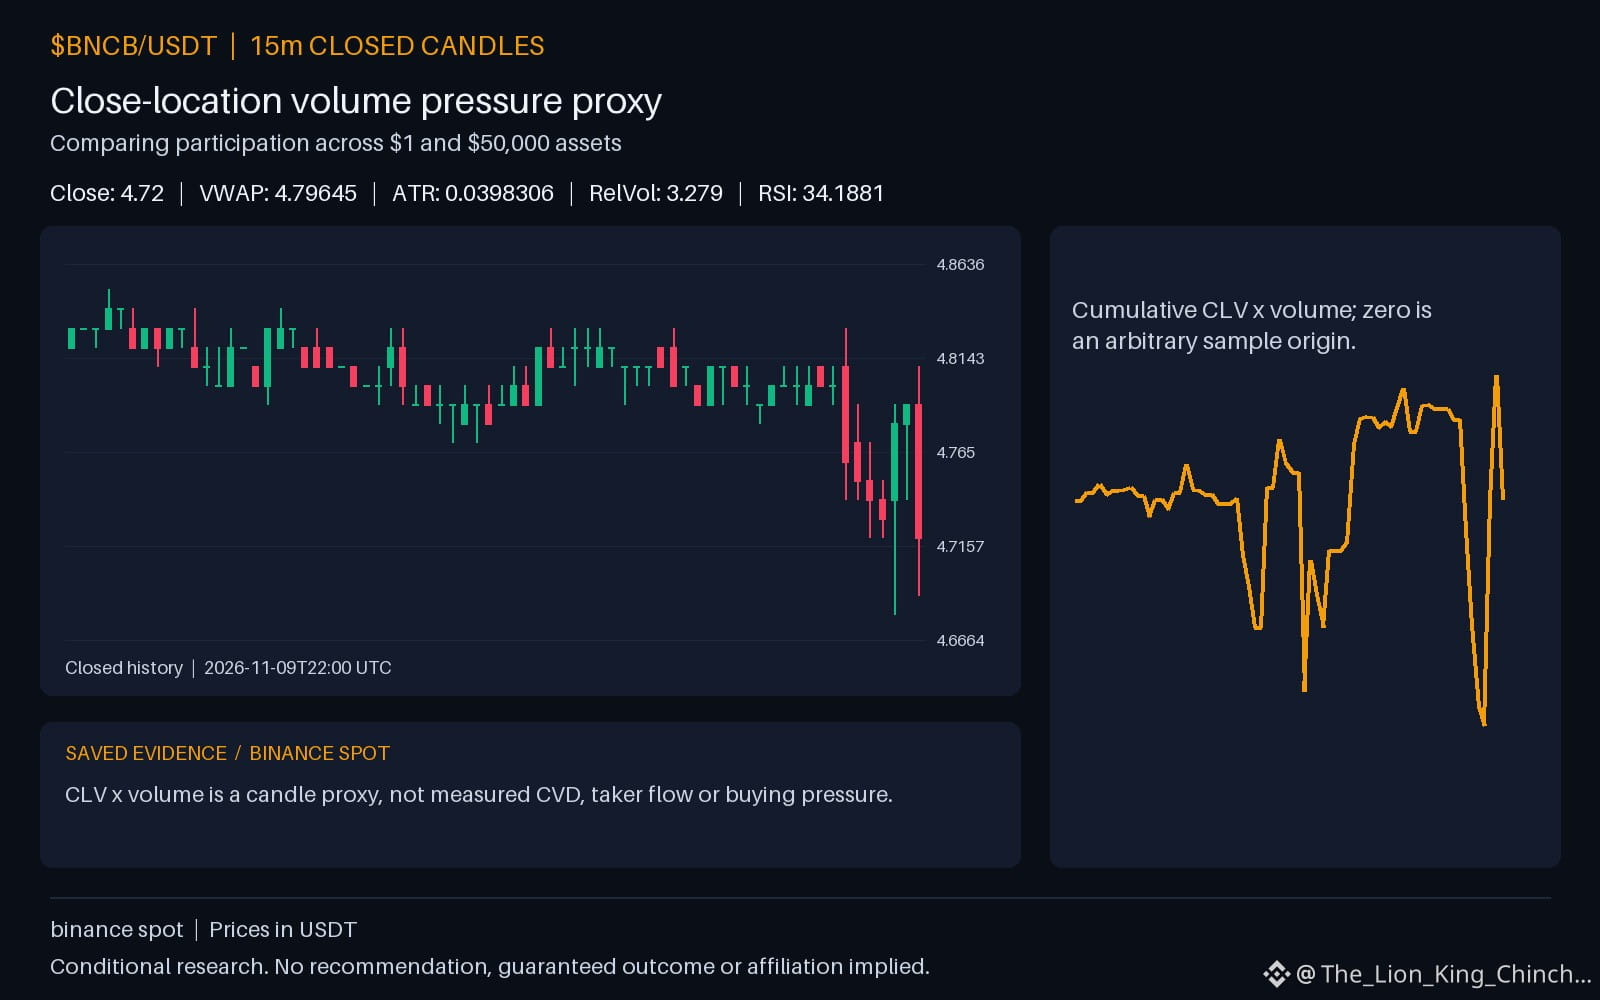
Could a single asset priced at fifty thousand dollars show the same participation profile as one priced at a dollar? This question explores how relative volume acts as a scale-invariant metric. Instead of looking at absolute dollar amounts, a researcher might compare current activity against an asset's own baseline. This hypothetical mechanism suggests that engagement is relative to a specific market context rather than the nominal price of a single unit.
Evidence for $BNCB shows a daily change of -1.8711 and an RSI of 34.1881. While the hourly direction is down, the volume remains above the baseline. In contrast, ETH and INIT both show an upward hourly direction on the same venue with volume also above their respective baselines. These shared directions on an hourly basis do not indicate a common cause or capital rotation. They are independent observations within a specific timeframe.
A self-check for this idea involves looking for a counterexample where an asset moves significantly on low relative volume. If $BNCB stays within its resistance of 4.83 and support of 4.68 while volume normalizes, the participation thesis changes. To reassess this interpretation, one should compare the relative volume 3.279 against the ATR 0.0398306 to see if volatility and activity remain aligned.
Probabilistic market research, not a recommendation or guaranteed return.
For a wider view: $ETH has hourly direction up and volume above its baseline; $INIT has hourly direction up and volume above its baseline. This alone does not establish correlation.
What would convince you: a clean close or a patient retest?
#BNCB
$BNCB : Assessing Action Across Price Tiers
Could a single asset priced at fifty thousand dollars show the same participation profile as one priced at a dollar? This question explores how relative volume acts as a scale-invariant metric. Instead of looking at absolute dollar amounts, a researcher might compare current activity against an asset's own baseline. This hypothetical mechanism suggests that engagement is relative to a specific market context rather than the nominal price of a single unit.
Evidence for $BNCB shows a daily change of -1.8711 and an RSI of 34.1881. While the hourly direction is down, the volume remains above the baseline. In contrast, ETH and INIT both show an upward hourly direction on the same venue with volume also above their respective baselines. These shared directions on an hourly basis do not indicate a common cause or capital rotation. They are independent observations within a specific timeframe.
A self-check for this idea involves looking for a counterexample where an asset moves significantly on low relative volume. If $BNCB stays within its resistance of 4.83 and support of 4.68 while volume normalizes, the participation thesis changes. To reassess this interpretation, one should compare the relative volume 3.279 against the ATR 0.0398306 to see if volatility and activity remain aligned.
Probabilistic market research, not a recommendation or guaranteed return.
For a wider view: $ETH has hourly direction up and volume above its baseline; $INIT has hourly direction up and volume above its baseline. This alone does not establish correlation.
What would convince you: a clean close or a patient retest?
#BNCB
Could a single asset priced at fifty thousand dollars show the same participation profile as one priced at a dollar? This question explores how relative volume acts as a scale-invariant metric. Instead of looking at absolute dollar amounts, a researcher might compare current activity against an asset's own baseline. This hypothetical mechanism suggests that engagement is relative to a specific market context rather than the nominal price of a single unit.
Evidence for $BNCB shows a daily change of -1.8711 and an RSI of 34.1881. While the hourly direction is down, the volume remains above the baseline. In contrast, ETH and INIT both show an upward hourly direction on the same venue with volume also above their respective baselines. These shared directions on an hourly basis do not indicate a common cause or capital rotation. They are independent observations within a specific timeframe.
A self-check for this idea involves looking for a counterexample where an asset moves significantly on low relative volume. If $BNCB stays within its resistance of 4.83 and support of 4.68 while volume normalizes, the participation thesis changes. To reassess this interpretation, one should compare the relative volume 3.279 against the ATR 0.0398306 to see if volatility and activity remain aligned.
Probabilistic market research, not a recommendation or guaranteed return.
For a wider view: $ETH has hourly direction up and volume above its baseline; $INIT has hourly direction up and volume above its baseline. This alone does not establish correlation.
What would convince you: a clean close or a patient retest?
#BNCB
46

·
--
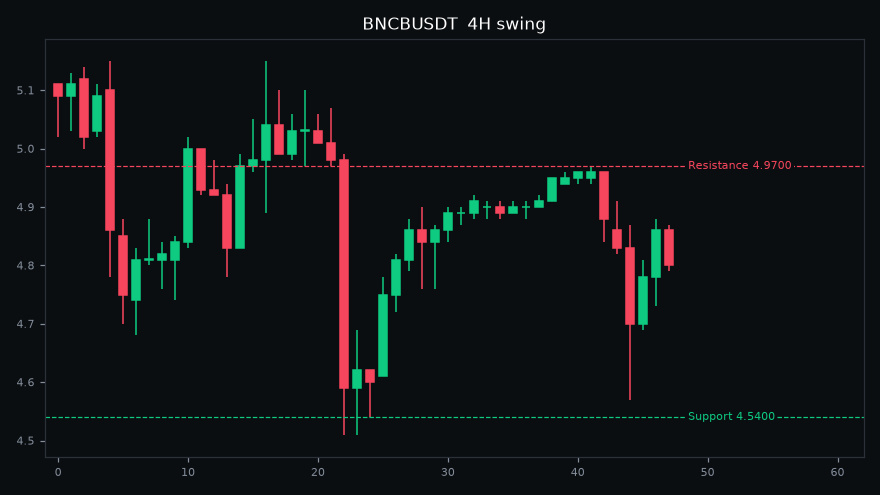
📉 $BNCB is down -3.2% in 24h
Price: 4.8000
24h High: 4.9600 | 24h Low: 4.5700
24h Volume: $5.3M
Support: 4.5400 | Resistance: 4.9700
RSI 41 (4H swing)
Volatility is high, protect your capital.
#BNCB #Trading #CryptoTrading #Binance
⚠️ Educational only, not financial advice. DYOR.
📉 $BNCB is down -3.2% in 24h
Price: 4.8000
24h High: 4.9600 | 24h Low: 4.5700
24h Volume: $5.3M
Support: 4.5400 | Resistance: 4.9700
RSI 41 (4H swing)
Volatility is high, protect your capital.
#BNCB #Trading #CryptoTrading #Binance
⚠️ Educational only, not financial advice. DYOR.
Price: 4.8000
24h High: 4.9600 | 24h Low: 4.5700
24h Volume: $5.3M
Support: 4.5400 | Resistance: 4.9700
RSI 41 (4H swing)
Volatility is high, protect your capital.
#BNCB #Trading #CryptoTrading #Binance
⚠️ Educational only, not financial advice. DYOR.
1
166

·
--
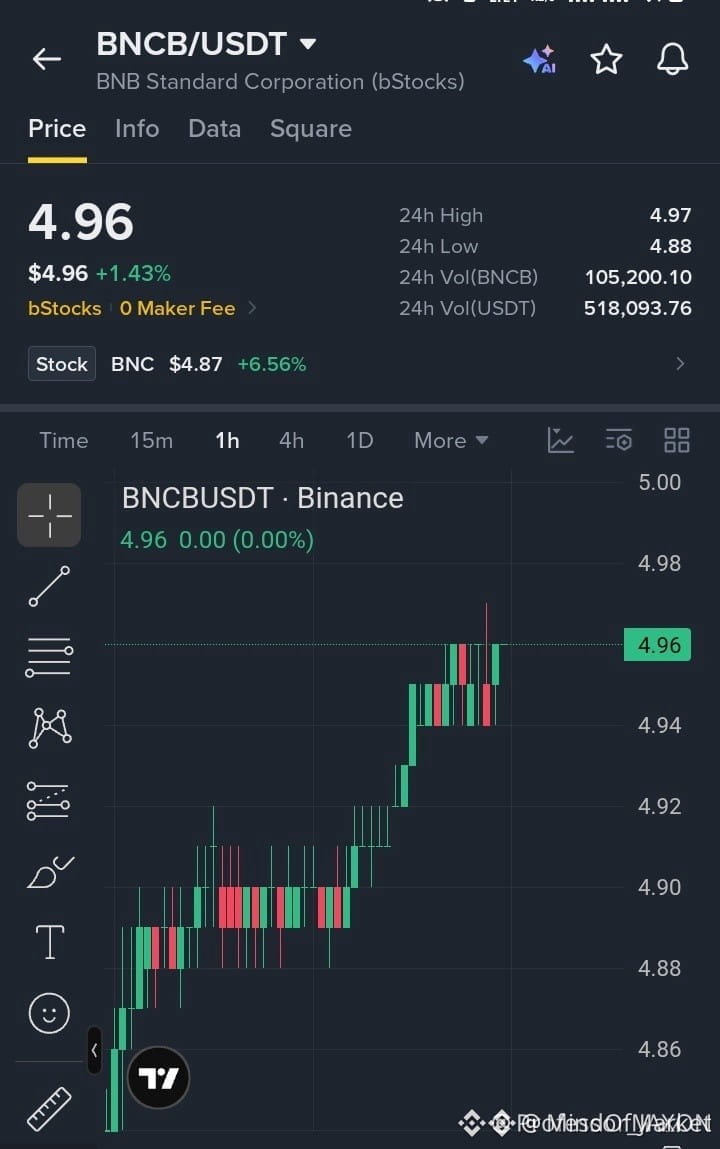
🚨 $BNCB METHODICAL ACCUMULATION ABOVE THE 4.92 RESISTANCE FLIP! ⚡
Entry: 4.94–4.96 ⚡
Target: 4.98, 5.00, 5.03 🚀
Stop Loss: 4.91 ⚠️
Institutional order flow is currently compressing right beneath the 4.97 threshold after a decisive break of the 4.92 structural ceiling. 📊 This tight consolidation near 4.96 signals aggressive bid absorption rather than retail exhaustion. ⚡
As long as 4.94 holds as reclaimed support, smart money positioning favors a continuation sweep toward our upside liquidity objectives. 💡 🤔 Are you scaling in during this tight range contraction or waiting for a confirmed candle close above 4.97?
⚠️ Not financial advice. Always manage your risk. 🛡️
🏷️ #BNCB #LongSetup #MarketStructure #OrderFlow #Crypto
🎯 🦈
🚨 $BNCB METHODICAL ACCUMULATION ABOVE THE 4.92 RESISTANCE FLIP! ⚡
Entry: 4.94–4.96 ⚡
Target: 4.98, 5.00, 5.03 🚀
Stop Loss: 4.91 ⚠️
Institutional order flow is currently compressing right beneath the 4.97 threshold after a decisive break of the 4.92 structural ceiling. 📊 This tight consolidation near 4.96 signals aggressive bid absorption rather than retail exhaustion. ⚡
As long as 4.94 holds as reclaimed support, smart money positioning favors a continuation sweep toward our upside liquidity objectives. 💡 🤔 Are you scaling in during this tight range contraction or waiting for a confirmed candle close above 4.97?
⚠️ Not financial advice. Always manage your risk. 🛡️
🏷️ #BNCB #LongSetup #MarketStructure #OrderFlow #Crypto
🎯 🦈
Entry: 4.94–4.96 ⚡
Target: 4.98, 5.00, 5.03 🚀
Stop Loss: 4.91 ⚠️
Institutional order flow is currently compressing right beneath the 4.97 threshold after a decisive break of the 4.92 structural ceiling. 📊 This tight consolidation near 4.96 signals aggressive bid absorption rather than retail exhaustion. ⚡
As long as 4.94 holds as reclaimed support, smart money positioning favors a continuation sweep toward our upside liquidity objectives. 💡 🤔 Are you scaling in during this tight range contraction or waiting for a confirmed candle close above 4.97?
⚠️ Not financial advice. Always manage your risk. 🛡️
🏷️ #BNCB #LongSetup #MarketStructure #OrderFlow #Crypto
🎯 🦈
28

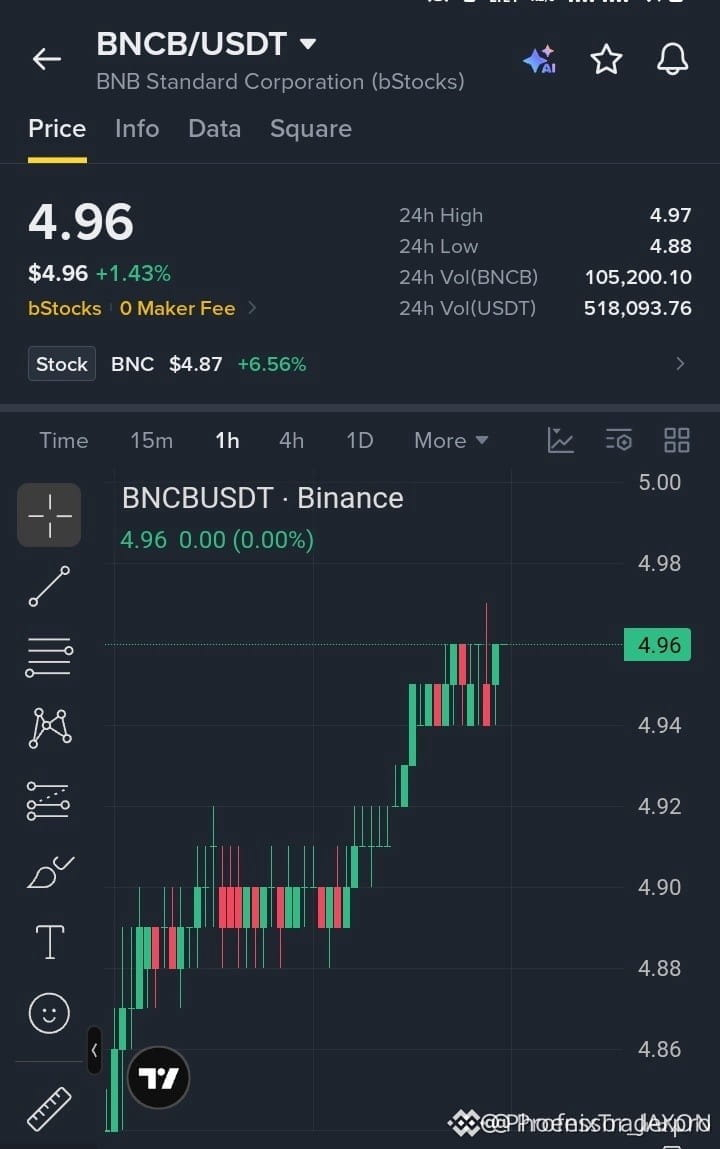
$BNCB BUYERS ARE TIGHTENING THE SCREW JUST BELOW MAJOR RESISTANCE 🚀 ⚡
Entry: 4.94–4.96 ⚡
Target: 4.98, 5.00, 5.03 🚀
Stop Loss: 4.91 ⚠️
Price action is coiling tightly against the 4.92 threshold as aggressive bids absorb every microscopic dip. This high-frequency consolidation right beneath the ceiling shows buyers refuse to yield territory. ⚡
A clean volume expansion past 4.97 could trigger an impulsive cascade toward higher liquidity pockets. Managing risk below the 4.91 structural floor keeps exposure razor-sharp while the momentum ladder builds. 📊
💬 Are you positioning ahead of the breakout or waiting for confirmation on the retest? 👇
⚠️ Not financial advice. Always manage your risk. 🛡️
🏷️ #BNCB #LongSetup #Breakout #Crypto
🔥 💎
$BNCB BUYERS ARE TIGHTENING THE SCREW JUST BELOW MAJOR RESISTANCE 🚀 ⚡
Entry: 4.94–4.96 ⚡
Target: 4.98, 5.00, 5.03 🚀
Stop Loss: 4.91 ⚠️
Price action is coiling tightly against the 4.92 threshold as aggressive bids absorb every microscopic dip. This high-frequency consolidation right beneath the ceiling shows buyers refuse to yield territory. ⚡
A clean volume expansion past 4.97 could trigger an impulsive cascade toward higher liquidity pockets. Managing risk below the 4.91 structural floor keeps exposure razor-sharp while the momentum ladder builds. 📊
💬 Are you positioning ahead of the breakout or waiting for confirmation on the retest? 👇
⚠️ Not financial advice. Always manage your risk. 🛡️
🏷️ #BNCB #LongSetup #Breakout #Crypto
🔥 💎
Entry: 4.94–4.96 ⚡
Target: 4.98, 5.00, 5.03 🚀
Stop Loss: 4.91 ⚠️
Price action is coiling tightly against the 4.92 threshold as aggressive bids absorb every microscopic dip. This high-frequency consolidation right beneath the ceiling shows buyers refuse to yield territory. ⚡
A clean volume expansion past 4.97 could trigger an impulsive cascade toward higher liquidity pockets. Managing risk below the 4.91 structural floor keeps exposure razor-sharp while the momentum ladder builds. 📊
💬 Are you positioning ahead of the breakout or waiting for confirmation on the retest? 👇
⚠️ Not financial advice. Always manage your risk. 🛡️
🏷️ #BNCB #LongSetup #Breakout #Crypto
🔥 💎
23
$BNCB: The Quality Trade-Off in BNCB Volume Spikes
When $BNCB shows volume above the baseline during an hourly upward move, traders often face a difficult trade-off between entry quality and the risk of chasing. If the current price rests near 4.9, the desire to capture a trend can lead to entering before a structure is fully formed. This creates a tension between waiting for a lower entry and the fear of missing the move entirely.
Consider a thought experiment. If you wait for a pullback to the support at 4.88, you prioritize entry quality. However, the price might never return there, leaving you on the sidelines. Conversely, entering at the current level simplifies execution but increases the distance to a meaningful invalidation point. A meaningful invalidation is a level where the original thesis is objectively wrong, such as the price dropping below 4.89001. If that distance is too wide, the risk-to-reward ratio often becomes unfavorable.
Currently, with the RSI at 52.5863 and volume increasing, the market is active. To reassess this interpretation, watch the relationship between volume and price near 4.91. If volume stays high but the price fails to break through, the assumption of continued momentum fails. In such a scenario, the trade-off shifts toward waiting rather than acting.
Probabilistic market research, not a recommendation or guaranteed return.
Would you wait for clearer structure or reassess the risk first?
#BNCB #RiskManagement
Binance spot proof for $BNCB: closed price 4.9 USDT.
Source: binance. Closed candle: 2026-11-07T13:45:00+00:00.
$BNCB : The Quality Trade-Off in BNCB Volume Spikes
When $BNCB shows volume above the baseline during an hourly upward move, traders often face a difficult trade-off between entry quality and the risk of chasing. If the current price rests near 4.9, the desire to capture a trend can lead to entering before a structure is fully formed. This creates a tension between waiting for a lower entry and the fear of missing the move entirely.
Consider a thought experiment. If you wait for a pullback to the support at 4.88, you prioritize entry quality. However, the price might never return there, leaving you on the sidelines. Conversely, entering at the current level simplifies execution but increases the distance to a meaningful invalidation point. A meaningful invalidation is a level where the original thesis is objectively wrong, such as the price dropping below 4.89001. If that distance is too wide, the risk-to-reward ratio often becomes unfavorable.
Currently, with the RSI at 52.5863 and volume increasing, the market is active. To reassess this interpretation, watch the relationship between volume and price near 4.91. If volume stays high but the price fails to break through, the assumption of continued momentum fails. In such a scenario, the trade-off shifts toward waiting rather than acting.
Probabilistic market research, not a recommendation or guaranteed return.
Would you wait for clearer structure or reassess the risk first?
#BNCB #RiskManagement
Binance spot proof for $BNCB : closed price 4.9 USDT.
Source: binance. Closed candle: 2026-11-07T13:45:00+00:00.
When $BNCB shows volume above the baseline during an hourly upward move, traders often face a difficult trade-off between entry quality and the risk of chasing. If the current price rests near 4.9, the desire to capture a trend can lead to entering before a structure is fully formed. This creates a tension between waiting for a lower entry and the fear of missing the move entirely.
Consider a thought experiment. If you wait for a pullback to the support at 4.88, you prioritize entry quality. However, the price might never return there, leaving you on the sidelines. Conversely, entering at the current level simplifies execution but increases the distance to a meaningful invalidation point. A meaningful invalidation is a level where the original thesis is objectively wrong, such as the price dropping below 4.89001. If that distance is too wide, the risk-to-reward ratio often becomes unfavorable.
Currently, with the RSI at 52.5863 and volume increasing, the market is active. To reassess this interpretation, watch the relationship between volume and price near 4.91. If volume stays high but the price fails to break through, the assumption of continued momentum fails. In such a scenario, the trade-off shifts toward waiting rather than acting.
Probabilistic market research, not a recommendation or guaranteed return.
Would you wait for clearer structure or reassess the risk first?
#BNCB #RiskManagement
Binance spot proof for $BNCB : closed price 4.9 USDT.
Source: binance. Closed candle: 2026-11-07T13:45:00+00:00.
42

·
--
$BNCB : Binance Access Is Only the First Step
A Binance listing can expand visibility and liquidity, but it doesn’t guarantee sustainable demand.
The real test is what happens after the initial attention fades:
Can buying pressure remain consistent?
Will liquidity hold beyond speculative trading?
Can BNCB build momentum without relying on listing hype?
The key isn’t getting listed. It’s keeping demand alive.
Does BNCB have what it takes to turn exposure into long-term market strength?
#BNCB #BinanceSquare #CryptoAnalysis
$BNCB : Binance Access Is Only the First Step
A Binance listing can expand visibility and liquidity, but it doesn’t guarantee sustainable demand.
The real test is what happens after the initial attention fades:
Can buying pressure remain consistent?
Will liquidity hold beyond speculative trading?
Can BNCB build momentum without relying on listing hype?
The key isn’t getting listed. It’s keeping demand alive.
Does BNCB have what it takes to turn exposure into long-term market strength?
#BNCB #BinanceSquare #CryptoAnalysis
A Binance listing can expand visibility and liquidity, but it doesn’t guarantee sustainable demand.
The real test is what happens after the initial attention fades:
Can buying pressure remain consistent?
Will liquidity hold beyond speculative trading?
Can BNCB build momentum without relying on listing hype?
The key isn’t getting listed. It’s keeping demand alive.
Does BNCB have what it takes to turn exposure into long-term market strength?
#BNCB #BinanceSquare #CryptoAnalysis
3
583

·
--
A post with tens of thousands of views is discussing $BNCB (stolen).
High popularity doesn’t mean it’s heading in the right direction. $BNCB is currently at 4.94 (+3.78% over 24h). One post can’t represent the market; you’ll have to look at the data yourself.
#BNCB
A post with tens of thousands of views is discussing $BNCB (stolen).
High popularity doesn’t mean it’s heading in the right direction. $BNCB is currently at 4.94 (+3.78% over 24h). One post can’t represent the market; you’ll have to look at the data yourself.
#BNCB
High popularity doesn’t mean it’s heading in the right direction. $BNCB is currently at 4.94 (+3.78% over 24h). One post can’t represent the market; you’ll have to look at the data yourself.
#BNCB
1
147

·
--
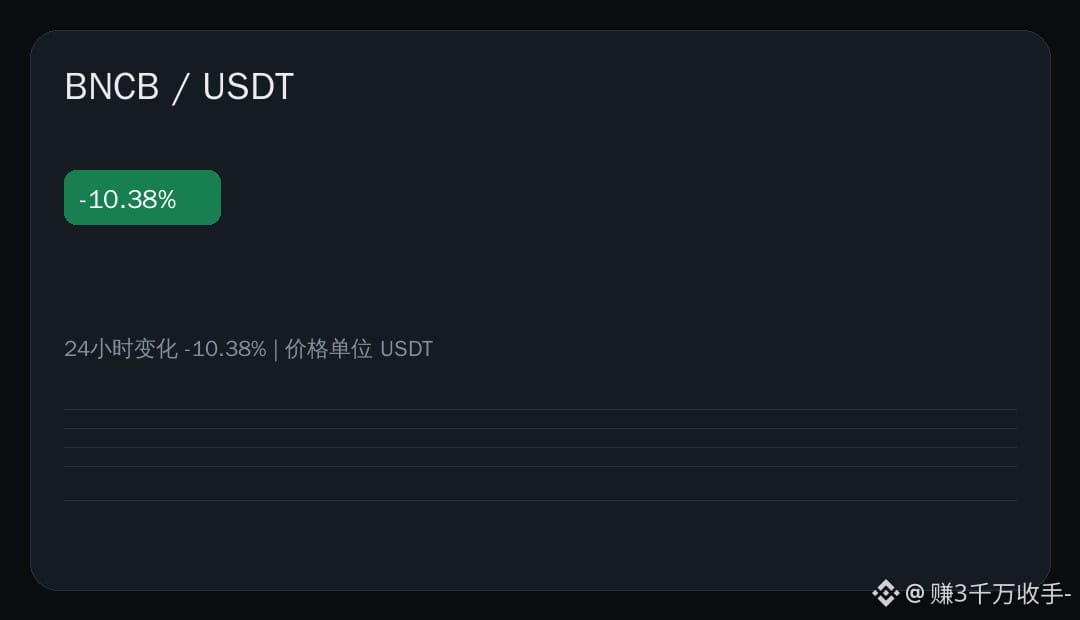
🩸 I can't take it! $BNCB is getting plenty of attention today.
Concerns about BNB token being issued repeatedly in the short term, and a reminder of the risks of buying
High volatility doesn't necessarily mean big opportunities. There's plenty of buzz, but both bulls and bears are still testing the waters. Trading volume is worth watching more closely than price.
Share your thoughts in the comments 👇
#市场观察 #BNCB #Binance
🩸 I can't take it! $BNCB is getting plenty of attention today.
Concerns about BNB token being issued repeatedly in the short term, and a reminder of the risks of buying
High volatility doesn't necessarily mean big opportunities. There's plenty of buzz, but both bulls and bears are still testing the waters. Trading volume is worth watching more closely than price.
Share your thoughts in the comments 👇
#市场观察 #BNCB #Binance
Concerns about BNB token being issued repeatedly in the short term, and a reminder of the risks of buying
High volatility doesn't necessarily mean big opportunities. There's plenty of buzz, but both bulls and bears are still testing the waters. Trading volume is worth watching more closely than price.
Share your thoughts in the comments 👇
#市场观察 #BNCB #Binance
16

The debate around BNCB has never been about the price column; it’s about the denominator. Nobody on the platform is asking how much higher it can go. Everyone is counting how many shares it has issued again—and that detail alone is the most valuable market signal right now.
First, look at the sentiment. A community post asking about the new share issuance got 32 likes and 15 comments, while a post that simply said “Isn’t this just a scam?” got only 3 likes and 5 comments—nearly a sixfold difference in engagement. More tellingly, nobody is responding to the people doing the actual scolding. The ones doing the math are the ones setting the tone: most holders don’t feel they’ve been scammed; they’re just running the numbers on their calculators. The implication is straightforward: the shares are concentrated in the hands of people who read announcements and track on-chain balances. This kind of capital doesn’t trade on emotion; it trades on conditions. Once the denominator grows faster than the assets accumulate, these investors will head for the exit one step ahead of retail.
Next, look at the model itself. All the premium in the treasury-company narrative is essentially payment for the idea that “the amount of BNB backing each share will keep increasing.” That statement has only two variables: the numerator is the amount of BNB the treasury actually holds, and the denominator is the number of shares in circulation. The premium multiple is a result, not a cause. When share issuance outpaces the growth in net asset value, net asset value per share gets diluted, and sooner or later the market will price the same BNB at a lower quote. Ringing the bell brings attention, but attention isn’t a net asset. It won’t appear on the balance sheet.
That’s where the risk lies—not in the shape of the candlestick chart. There are only three things to watch: how often new share issuance is announced, the net change in the BNB balance of the treasury address, and how much of a premium the secondary-market price still carries over net asset value per share. Of these three, denominator growth is the easiest to overlook, yet the most lethal—because at least someone screenshots the other two every day, while new share issuance is buried in the footnotes of announcements. 🔢 From a narrative perspective, the premium on treasury-style assets is essentially an option: the market is willing to pay in advance for the possibility that “net assets will accumulate faster in the future.” Once investors realize that issuing shares is bringing in liquidity rather than assets, that option gets taken off the table. The repricing is often a one-time event, with no chance to confirm it repeatedly.
My view is this: until denominator growth clearly falls below net asset value growth, BNCB’s rise looks more like a liquidity premium than a move driven by net asset value. There’s nothing wrong with being bullish, but watch the balance sheet, not the intraday chart. Don’t build a position on the pace at which someone else is issuing shares; that’s essentially handing pricing power over to the announcements page.
#BNCB #币安 #Crypto
The debate around BNCB has never been about the price column; it’s about the denominator. Nobody on the platform is asking how much higher it can go. Everyone is counting how many shares it has issued again—and that detail alone is the most valuable market signal right now.
First, look at the sentiment. A community post asking about the new share issuance got 32 likes and 15 comments, while a post that simply said “Isn’t this just a scam?” got only 3 likes and 5 comments—nearly a sixfold difference in engagement. More tellingly, nobody is responding to the people doing the actual scolding. The ones doing the math are the ones setting the tone: most holders don’t feel they’ve been scammed; they’re just running the numbers on their calculators. The implication is straightforward: the shares are concentrated in the hands of people who read announcements and track on-chain balances. This kind of capital doesn’t trade on emotion; it trades on conditions. Once the denominator grows faster than the assets accumulate, these investors will head for the exit one step ahead of retail.
Next, look at the model itself. All the premium in the treasury-company narrative is essentially payment for the idea that “the amount of BNB backing each share will keep increasing.” That statement has only two variables: the numerator is the amount of BNB the treasury actually holds, and the denominator is the number of shares in circulation. The premium multiple is a result, not a cause. When share issuance outpaces the growth in net asset value, net asset value per share gets diluted, and sooner or later the market will price the same BNB at a lower quote. Ringing the bell brings attention, but attention isn’t a net asset. It won’t appear on the balance sheet.
That’s where the risk lies—not in the shape of the candlestick chart. There are only three things to watch: how often new share issuance is announced, the net change in the BNB balance of the treasury address, and how much of a premium the secondary-market price still carries over net asset value per share. Of these three, denominator growth is the easiest to overlook, yet the most lethal—because at least someone screenshots the other two every day, while new share issuance is buried in the footnotes of announcements. 🔢 From a narrative perspective, the premium on treasury-style assets is essentially an option: the market is willing to pay in advance for the possibility that “net assets will accumulate faster in the future.” Once investors realize that issuing shares is bringing in liquidity rather than assets, that option gets taken off the table. The repricing is often a one-time event, with no chance to confirm it repeatedly.
My view is this: until denominator growth clearly falls below net asset value growth, BNCB’s rise looks more like a liquidity premium than a move driven by net asset value. There’s nothing wrong with being bullish, but watch the balance sheet, not the intraday chart. Don’t build a position on the pace at which someone else is issuing shares; that’s essentially handing pricing power over to the announcements page.
#BNCB #币安 #Crypto
First, look at the sentiment. A community post asking about the new share issuance got 32 likes and 15 comments, while a post that simply said “Isn’t this just a scam?” got only 3 likes and 5 comments—nearly a sixfold difference in engagement. More tellingly, nobody is responding to the people doing the actual scolding. The ones doing the math are the ones setting the tone: most holders don’t feel they’ve been scammed; they’re just running the numbers on their calculators. The implication is straightforward: the shares are concentrated in the hands of people who read announcements and track on-chain balances. This kind of capital doesn’t trade on emotion; it trades on conditions. Once the denominator grows faster than the assets accumulate, these investors will head for the exit one step ahead of retail.
Next, look at the model itself. All the premium in the treasury-company narrative is essentially payment for the idea that “the amount of BNB backing each share will keep increasing.” That statement has only two variables: the numerator is the amount of BNB the treasury actually holds, and the denominator is the number of shares in circulation. The premium multiple is a result, not a cause. When share issuance outpaces the growth in net asset value, net asset value per share gets diluted, and sooner or later the market will price the same BNB at a lower quote. Ringing the bell brings attention, but attention isn’t a net asset. It won’t appear on the balance sheet.
That’s where the risk lies—not in the shape of the candlestick chart. There are only three things to watch: how often new share issuance is announced, the net change in the BNB balance of the treasury address, and how much of a premium the secondary-market price still carries over net asset value per share. Of these three, denominator growth is the easiest to overlook, yet the most lethal—because at least someone screenshots the other two every day, while new share issuance is buried in the footnotes of announcements. 🔢 From a narrative perspective, the premium on treasury-style assets is essentially an option: the market is willing to pay in advance for the possibility that “net assets will accumulate faster in the future.” Once investors realize that issuing shares is bringing in liquidity rather than assets, that option gets taken off the table. The repricing is often a one-time event, with no chance to confirm it repeatedly.
My view is this: until denominator growth clearly falls below net asset value growth, BNCB’s rise looks more like a liquidity premium than a move driven by net asset value. There’s nothing wrong with being bullish, but watch the balance sheet, not the intraday chart. Don’t build a position on the pace at which someone else is issuing shares; that’s essentially handing pricing power over to the announcements page.
#BNCB #币安 #Crypto
69

·
--
A discussion on the plaza has gotten quite a lot of views, and people are talking about $BNCB .
There are both bullish and bearish takes, so don't get swept up in the hype.
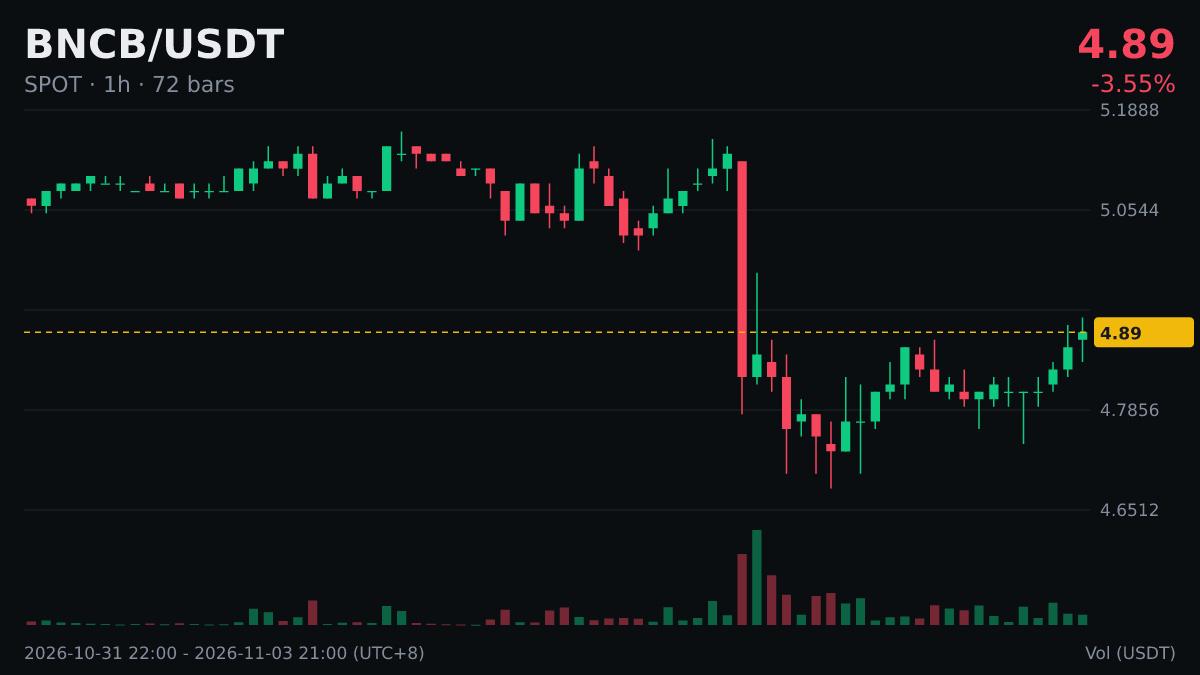
$BNCB is now at 4.89 (24h -4.68%). One post can't explain the overall trend; you still need to do your own research.
#BNCB
A discussion on the plaza has gotten quite a lot of views, and people are talking about $BNCB .
There are both bullish and bearish takes, so don't get swept up in the hype.
$BNCB is now at 4.89 (24h -4.68%). One post can't explain the overall trend; you still need to do your own research.
#BNCB
There are both bullish and bearish takes, so don't get swept up in the hype.
$BNCB is now at 4.89 (24h -4.68%). One post can't explain the overall trend; you still need to do your own research.
#BNCB
11

·
--
🚀 BNCB PRICE ANALYSIS: CAN IT REACH $5.60?
$BNCB is showing signs of short-term recovery after recent selling pressure. Buyers are attempting to regain momentum, but a confirmed breakout is still needed.
{spot}(BNCBUSDT)
📊 MARKET UPDATE
Current price: $5.05
24H high: $5.16
24H low: $5.07
24H change: +0.79%
7-day performance: -8.14%
30-day performance: -15.05%
Market cap: $37.70M
24H volume: Approximately $956K
⏱️ 1-HOUR TECHNICAL ANALYSIS
The latest available technical snapshots show mixed market conditions:
RSI: 46.2 — Neutral.
MACD: Bullish.
Relative volume: 0.38 — Below average.
Overall momentum: Recovery needs stronger volume confirmation.
🎯 IMPORTANT PRICE LEVELS
$BNCB
🟢 Bullish targets:
$5.16 — Immediate resistance.
$5.20 — Breakout confirmation zone.
$5.35 — Next upside target.
$5.60 — Extended bullish target.
🔴 Support levels:
$5.07 — Immediate support.
$5.02 — Lower support.
$4.93 — Downside reference.
📈 WHAT COULD TRIGGER A MOVE TOWARDS $5.60?
—Strong breakout above $5.16.
—Increasing buying volume above $5.20.
—Successful retest of the breakout zone.
—Positive movement in the underlying CEA Industries stock.
—Increased demand for tokenized financial assets.
📰 Catalysts towards its growth
Binance announced BNCB Spot trading on September 14, 2026, with BTC and USDT trading options.
BNCB was also introduced as eligible collateral for certain margin products, subject to user eligibility and jurisdiction restrictions.
Over the next 10 days, watch for new Binance announcements, CEA Industries corporate updates, liquidity changes and broader RWA market developments.
📈PRICE OUTLOOK
Bullish scenario: A confirmed breakout above $5.20 could open the way towards $5.35, followed by $5.60.
Bearish scenario: A breakdown below $5.07 could bring $5.02 and potentially $4.93 into focus.
BNCB could be preparing for a recovery, with $5.20 as the key breakout level. A sustained move above this zone could strengthen bullish momentum and bring higher price targets into focus.
#BNCB #BİNANCE
🚀 BNCB PRICE ANALYSIS: CAN IT REACH $5.60?
$BNCB is showing signs of short-term recovery after recent selling pressure. Buyers are attempting to regain momentum, but a confirmed breakout is still needed.
📊 MARKET UPDATE
Current price: $5.05
24H high: $5.16
24H low: $5.07
24H change: +0.79%
7-day performance: -8.14%
30-day performance: -15.05%
Market cap: $37.70M
24H volume: Approximately $956K
⏱️ 1-HOUR TECHNICAL ANALYSIS
The latest available technical snapshots show mixed market conditions:
RSI: 46.2 — Neutral.
MACD: Bullish.
Relative volume: 0.38 — Below average.
Overall momentum: Recovery needs stronger volume confirmation.
🎯 IMPORTANT PRICE LEVELS
$BNCB
🟢 Bullish targets:
$5.16 — Immediate resistance.
$5.20 — Breakout confirmation zone.
$5.35 — Next upside target.
$5.60 — Extended bullish target.
🔴 Support levels:
$5.07 — Immediate support.
$5.02 — Lower support.
$4.93 — Downside reference.
📈 WHAT COULD TRIGGER A MOVE TOWARDS $5.60?
—Strong breakout above $5.16.
—Increasing buying volume above $5.20.
—Successful retest of the breakout zone.
—Positive movement in the underlying CEA Industries stock.
—Increased demand for tokenized financial assets.
📰 Catalysts towards its growth
Binance announced BNCB Spot trading on September 14, 2026, with BTC and USDT trading options.
BNCB was also introduced as eligible collateral for certain margin products, subject to user eligibility and jurisdiction restrictions.
Over the next 10 days, watch for new Binance announcements, CEA Industries corporate updates, liquidity changes and broader RWA market developments.
📈PRICE OUTLOOK
Bullish scenario: A confirmed breakout above $5.20 could open the way towards $5.35, followed by $5.60.
Bearish scenario: A breakdown below $5.07 could bring $5.02 and potentially $4.93 into focus.
BNCB could be preparing for a recovery, with $5.20 as the key breakout level. A sustained move above this zone could strengthen bullish momentum and bring higher price targets into focus.
#BNCB #BİNANCE
$BNCB is showing signs of short-term recovery after recent selling pressure. Buyers are attempting to regain momentum, but a confirmed breakout is still needed.
📊 MARKET UPDATE
Current price: $5.05
24H high: $5.16
24H low: $5.07
24H change: +0.79%
7-day performance: -8.14%
30-day performance: -15.05%
Market cap: $37.70M
24H volume: Approximately $956K
⏱️ 1-HOUR TECHNICAL ANALYSIS
The latest available technical snapshots show mixed market conditions:
RSI: 46.2 — Neutral.
MACD: Bullish.
Relative volume: 0.38 — Below average.
Overall momentum: Recovery needs stronger volume confirmation.
🎯 IMPORTANT PRICE LEVELS
$BNCB
🟢 Bullish targets:
$5.16 — Immediate resistance.
$5.20 — Breakout confirmation zone.
$5.35 — Next upside target.
$5.60 — Extended bullish target.
🔴 Support levels:
$5.07 — Immediate support.
$5.02 — Lower support.
$4.93 — Downside reference.
📈 WHAT COULD TRIGGER A MOVE TOWARDS $5.60?
—Strong breakout above $5.16.
—Increasing buying volume above $5.20.
—Successful retest of the breakout zone.
—Positive movement in the underlying CEA Industries stock.
—Increased demand for tokenized financial assets.
📰 Catalysts towards its growth
Binance announced BNCB Spot trading on September 14, 2026, with BTC and USDT trading options.
BNCB was also introduced as eligible collateral for certain margin products, subject to user eligibility and jurisdiction restrictions.
Over the next 10 days, watch for new Binance announcements, CEA Industries corporate updates, liquidity changes and broader RWA market developments.
📈PRICE OUTLOOK
Bullish scenario: A confirmed breakout above $5.20 could open the way towards $5.35, followed by $5.60.
Bearish scenario: A breakdown below $5.07 could bring $5.02 and potentially $4.93 into focus.
BNCB could be preparing for a recovery, with $5.20 as the key breakout level. A sustained move above this zone could strengthen bullish momentum and bring higher price targets into focus.
#BNCB #BİNANCE
556

·
--
📊 TradFi Spotlight: $BNCB
{spot}(BNCBUSDT)
Holding Strong While Major Stocks Dip! 🟢
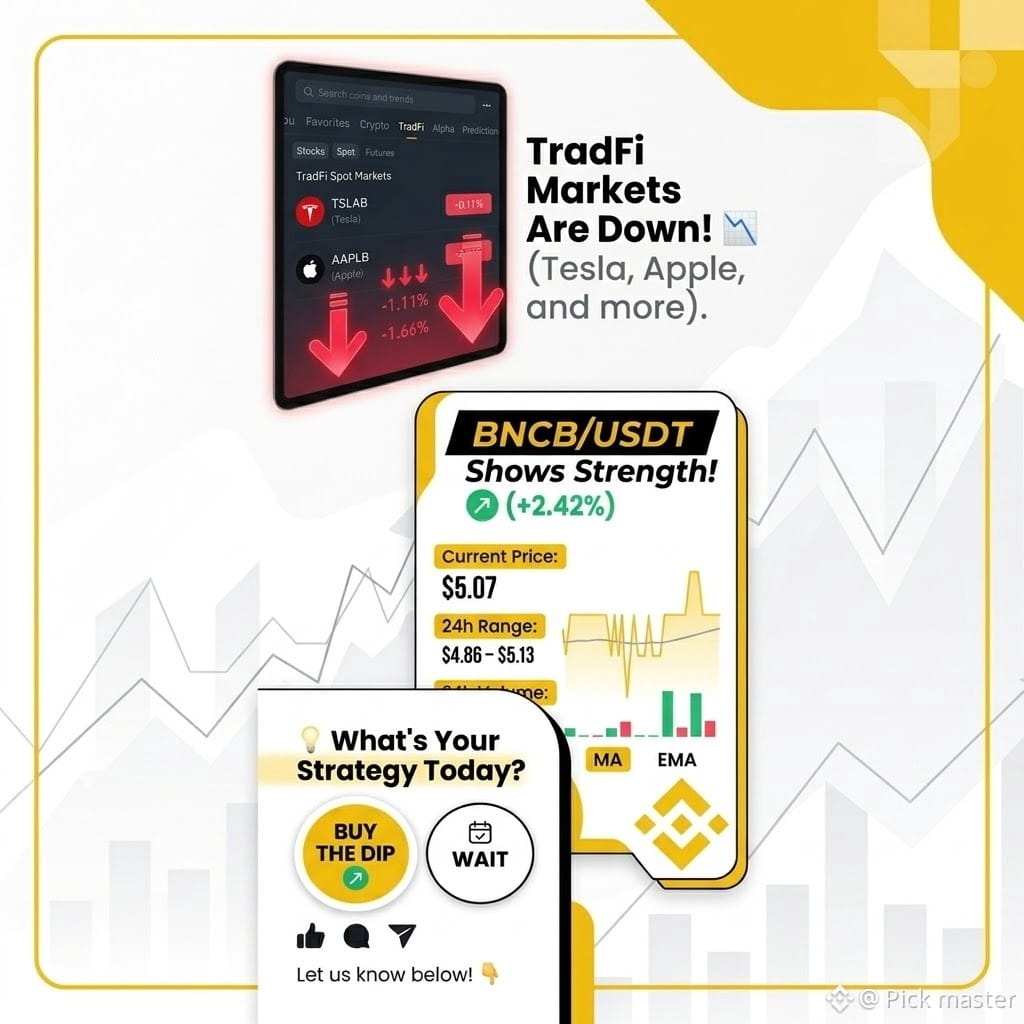
While the broader TradFi and stock markets (including Tesla, Apple, and AMD) are experiencing a red wave today, some assets are showing great resilience.
🔎 Asset Focus: BNCB/USDT (BNB Standard Corporation - bStocks)
* Current Price: $5.07 (+2.42%)
* 24h Range: $4.86 – $5.13
* 24h Volume: 2.01M USDT
Staying green amidst a market-wide correction highlights solid short-term momentum and active buyer interest on the chart.
💡 What's your strategy today? Are you buying the dip or waiting on the sidelines? Let us know below! 👇
#BinanceSquare i #BNCB #MarketUpdate #writetoearn
📊 TradFi Spotlight: $BNCB
Holding Strong While Major Stocks Dip! 🟢
While the broader TradFi and stock markets (including Tesla, Apple, and AMD) are experiencing a red wave today, some assets are showing great resilience.
🔎 Asset Focus: BNCB/USDT (BNB Standard Corporation - bStocks)
* Current Price: $5.07 (+2.42%)
* 24h Range: $4.86 – $5.13
* 24h Volume: 2.01M USDT
Staying green amidst a market-wide correction highlights solid short-term momentum and active buyer interest on the chart.
💡 What's your strategy today? Are you buying the dip or waiting on the sidelines? Let us know below! 👇
#BinanceSquare i #BNCB #MarketUpdate #writetoearn
Holding Strong While Major Stocks Dip! 🟢
While the broader TradFi and stock markets (including Tesla, Apple, and AMD) are experiencing a red wave today, some assets are showing great resilience.
🔎 Asset Focus: BNCB/USDT (BNB Standard Corporation - bStocks)
* Current Price: $5.07 (+2.42%)
* 24h Range: $4.86 – $5.13
* 24h Volume: 2.01M USDT
Staying green amidst a market-wide correction highlights solid short-term momentum and active buyer interest on the chart.
💡 What's your strategy today? Are you buying the dip or waiting on the sidelines? Let us know below! 👇
#BinanceSquare i #BNCB #MarketUpdate #writetoearn
1
382

Don't go just yet!
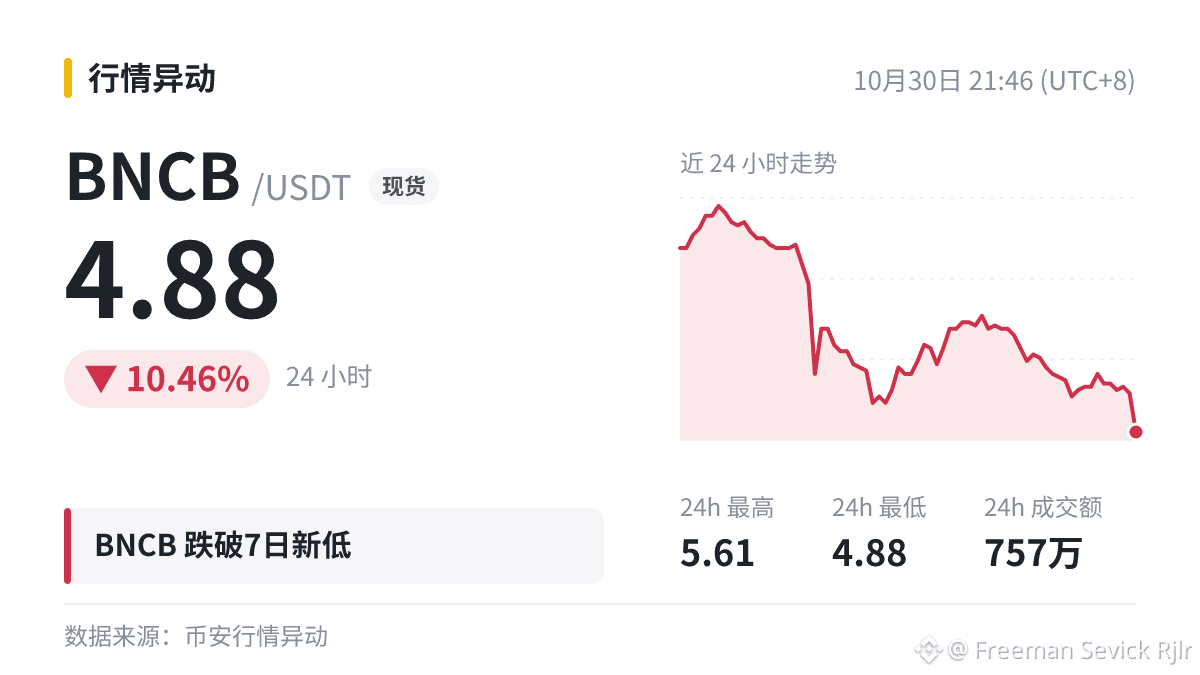
$BNCB has broken below support 📉 The 7-day low has been breached!
Current price: 4.88. The previous low of 4.94 couldn't hold…
Don't average down on a bad call by adding to your position. Panic or hold firm? Which do you choose?
#BNCB
Don't go just yet!
$BNCB has broken below support 📉 The 7-day low has been breached!
Current price: 4.88. The previous low of 4.94 couldn't hold…
Don't average down on a bad call by adding to your position. Panic or hold firm? Which do you choose?
#BNCB
$BNCB has broken below support 📉 The 7-day low has been breached!
Current price: 4.88. The previous low of 4.94 couldn't hold…
Don't average down on a bad call by adding to your position. Panic or hold firm? Which do you choose?
#BNCB
273

·
--
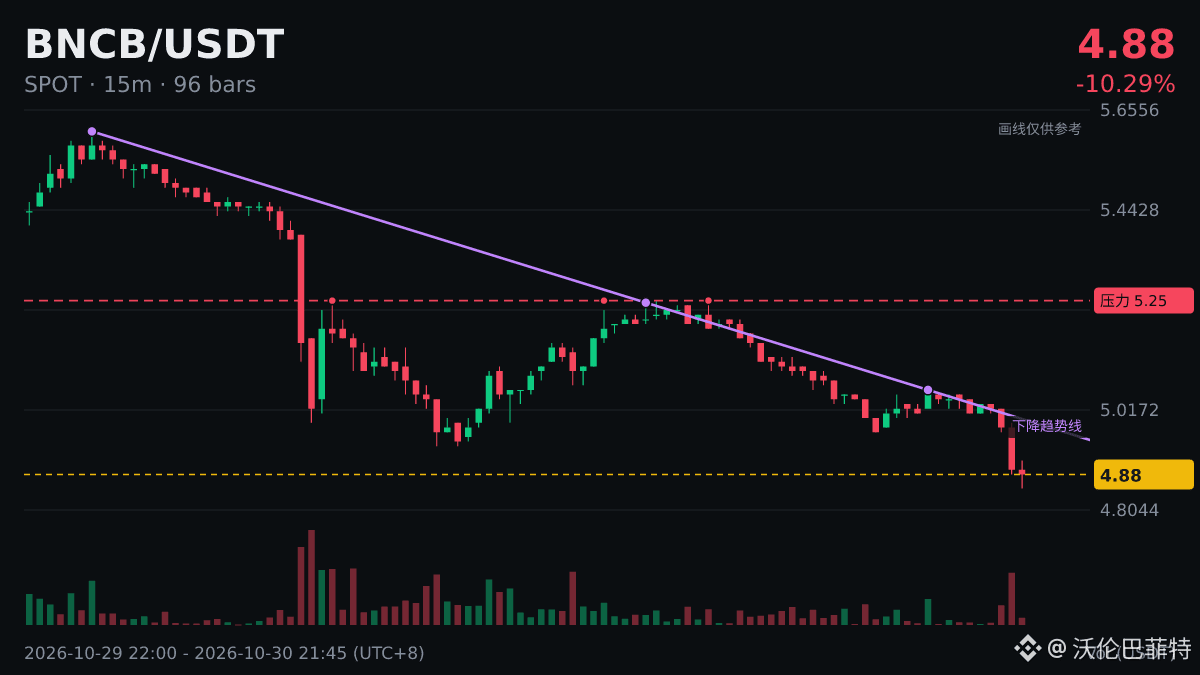
🐋 $BNCB broke below its 7-day low; selling pressure isn't over.
Current price: 4.88, breaking below the previous low of 4.94. 24-hour trading volume: $7.45 million.
There are usually plenty of long-position stop-loss orders below the previous low. Breaking below it may trigger a cascade of stop-losses; watch for large orders absorbing the selling at lower levels.
#BNCB
Personal observation, not a recommendation to buy or sell.
🐋 $BNCB broke below its 7-day low; selling pressure isn't over.
Current price: 4.88, breaking below the previous low of 4.94. 24-hour trading volume: $7.45 million.
There are usually plenty of long-position stop-loss orders below the previous low. Breaking below it may trigger a cascade of stop-losses; watch for large orders absorbing the selling at lower levels.
#BNCB
Personal observation, not a recommendation to buy or sell.
Current price: 4.88, breaking below the previous low of 4.94. 24-hour trading volume: $7.45 million.
There are usually plenty of long-position stop-loss orders below the previous low. Breaking below it may trigger a cascade of stop-losses; watch for large orders absorbing the selling at lower levels.
#BNCB
Personal observation, not a recommendation to buy or sell.
17

·
--
Follow the money:
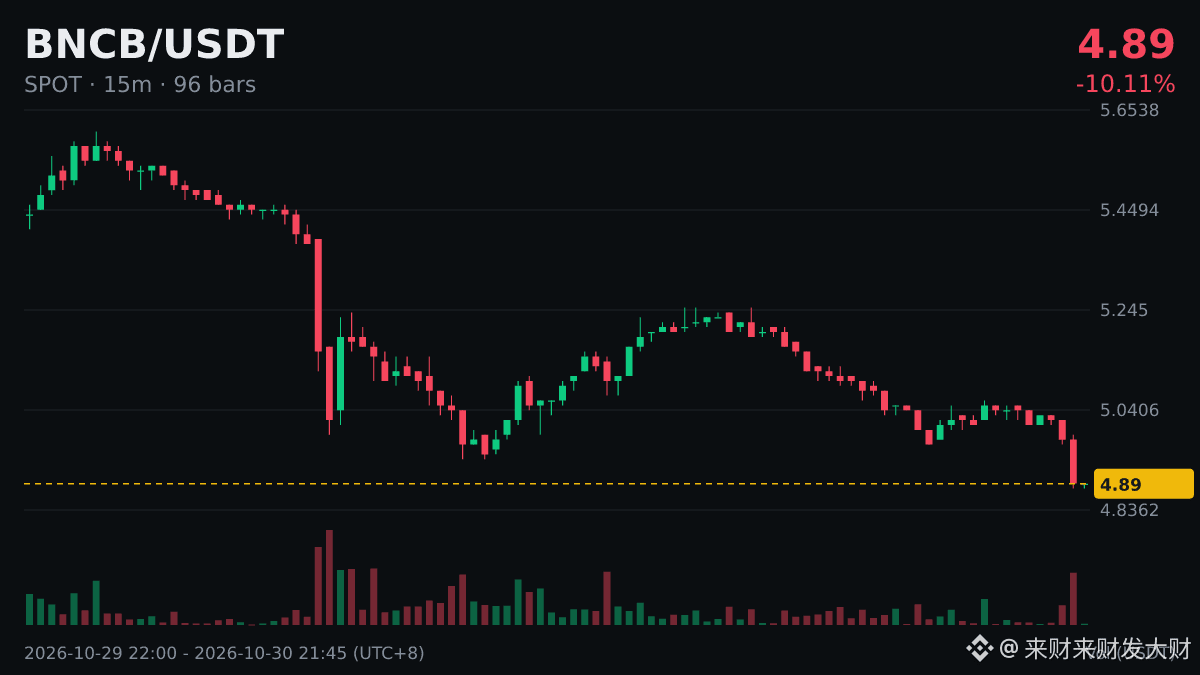
$BNCB 7 hit a new low today, currently at 4.87, below the previous low of 4.94, down 10.15% in 24h.
There’s still no clear sign of buying support near the new low; funds are mostly pulling out, so there’s no rush to buy in.
What will you do if things move in the opposite direction later?
#BNCB
The above is compiled from publicly available information. Please verify it yourself.
Follow the money:
$BNCB 7 hit a new low today, currently at 4.87, below the previous low of 4.94, down 10.15% in 24h.
There’s still no clear sign of buying support near the new low; funds are mostly pulling out, so there’s no rush to buy in.
What will you do if things move in the opposite direction later?
#BNCB
The above is compiled from publicly available information. Please verify it yourself.
$BNCB 7 hit a new low today, currently at 4.87, below the previous low of 4.94, down 10.15% in 24h.
There’s still no clear sign of buying support near the new low; funds are mostly pulling out, so there’s no rush to buy in.
What will you do if things move in the opposite direction later?
#BNCB
The above is compiled from publicly available information. Please verify it yourself.
27

·
--
$BNCB new low data
Period: 7 days
Latest: 4.87
Previous low: 4.94
24h: -10.48%
24h trading volume: $7.58 million
What do you make of this?
#BNCB
I could be wrong too; don't take this as advice.
$BNCB new low data
Period: 7 days
Latest: 4.87
Previous low: 4.94
24h: -10.48%
24h trading volume: $7.58 million
What do you make of this?
#BNCB
I could be wrong too; don't take this as advice.
Period: 7 days
Latest: 4.87
Previous low: 4.94
24h: -10.48%
24h trading volume: $7.58 million
What do you make of this?
#BNCB
I could be wrong too; don't take this as advice.
49
Log in to explore more content
Join global crypto users on Binance Square
⚡️ Get latest and useful information about crypto.
💬 Trusted by the world’s largest crypto exchange.
👍 Discover real insights from verified creators.
Email / Phone number
Trending Topics
1
#CryptoSelloffTriggersMultipleWhaleLiquidations
1,348 views
77 Discussing
2
#USSpotXRPETFsSeeLargestWeeklyOutflowIn8Months
43,767 views
520 Discussing
3
#WillFOMCMinutesReinforceRateHikeExpectations?
402 views
20 Discussing
4
#BitcoinActiveSupplyInProfitDropsBelow45%
101,842 views
924 Discussing
5
#TONStrategyReports$23.97MQ3NetLoss
12,041 views
64 Discussing
6
#KavaSaysAbnormalActivityLimitedToKavaLend
66,190 views
514 Discussing
7
#WORPTLetsTouristsConvertCryptoToThaiBaht
13,050 views
149 Discussing
8
#WhoWillSucceedJensenHuangatNvidia?
218,330 views
1,851 Discussing
9
#WhatWillDriveCryptoandStocks’NextRebound?
654,551 views
3,671 Discussing
10
#TradFiForBeginners
760,612 views
4,635 Discussing