
#bmtusdt
bmtusdt
302,125 views
1,217 Discussing
Hot
Latest

·
--
🚀 $BMT IS SHOWING STRONG RECOVERY MOMENTUM! IS A BIGGER MOVE COMING? 🔥
$BMT/USDT is attracting attention after a strong daily recovery, currently trading around $0.02190, up +13.47%. The chart shows buyers stepping in aggressively after the recent decline toward $0.01856. A strong green daily candle, combined with increased trading activity, suggests that bullish momentum may be returning.
📊 Key Technical Levels to Watch:
🟢 Support Zone: $0.02010 – $0.01918
🟢 Major Support: $0.01856
🔴 First Resistance: $0.02297 (MA25)
🔴 Next Resistance: $0.02360
🎯 Potential Upside: A confirmed breakout above $0.02360 could open the door toward higher price levels.
The price is trading above MA(7) and MA(99), showing improving short-term strength. However, MA(25) remains an important resistance to overcome.
🔥 My Take: $BMT is showing promising recovery signals. If buyers maintain momentum and volume continues supporting the move, another bullish leg could develop. Watch the $0.02360 breakout level closely!
What do you think? Can $BMT break $0.02360 and start its next rally? 👀
#BMT #BMTUSDT #BinanceSquare
#CanGTA6'sLaunchLiftTTWOShares?
#MASToUpgradeSGDTestnetToSGDigitalLedger
{spot}(BMTUSDT)
🚀 $BMT IS SHOWING STRONG RECOVERY MOMENTUM! IS A BIGGER MOVE COMING? 🔥
$BMT /USDT is attracting attention after a strong daily recovery, currently trading around $0.02190, up +13.47%. The chart shows buyers stepping in aggressively after the recent decline toward $0.01856. A strong green daily candle, combined with increased trading activity, suggests that bullish momentum may be returning.
📊 Key Technical Levels to Watch:
🟢 Support Zone: $0.02010 – $0.01918
🟢 Major Support: $0.01856
🔴 First Resistance: $0.02297 (MA25)
🔴 Next Resistance: $0.02360
🎯 Potential Upside: A confirmed breakout above $0.02360 could open the door toward higher price levels.
The price is trading above MA(7) and MA(99), showing improving short-term strength. However, MA(25) remains an important resistance to overcome.
🔥 My Take: $BMT is showing promising recovery signals. If buyers maintain momentum and volume continues supporting the move, another bullish leg could develop. Watch the $0.02360 breakout level closely!
What do you think? Can $BMT break $0.02360 and start its next rally? 👀
#BMT #BMTUSDT #BinanceSquare
#CanGTA6'sLaunchLiftTTWOShares?
#MASToUpgradeSGDTestnetToSGDigitalLedger
$BMT /USDT is attracting attention after a strong daily recovery, currently trading around $0.02190, up +13.47%. The chart shows buyers stepping in aggressively after the recent decline toward $0.01856. A strong green daily candle, combined with increased trading activity, suggests that bullish momentum may be returning.
📊 Key Technical Levels to Watch:
🟢 Support Zone: $0.02010 – $0.01918
🟢 Major Support: $0.01856
🔴 First Resistance: $0.02297 (MA25)
🔴 Next Resistance: $0.02360
🎯 Potential Upside: A confirmed breakout above $0.02360 could open the door toward higher price levels.
The price is trading above MA(7) and MA(99), showing improving short-term strength. However, MA(25) remains an important resistance to overcome.
🔥 My Take: $BMT is showing promising recovery signals. If buyers maintain momentum and volume continues supporting the move, another bullish leg could develop. Watch the $0.02360 breakout level closely!
What do you think? Can $BMT break $0.02360 and start its next rally? 👀
#BMT #BMTUSDT #BinanceSquare
#CanGTA6'sLaunchLiftTTWOShares?
#MASToUpgradeSGDTestnetToSGDigitalLedger

1
579


·
--
Bullish
$BMT /USDT – BULLISH RECOVERY SETUP! 📈
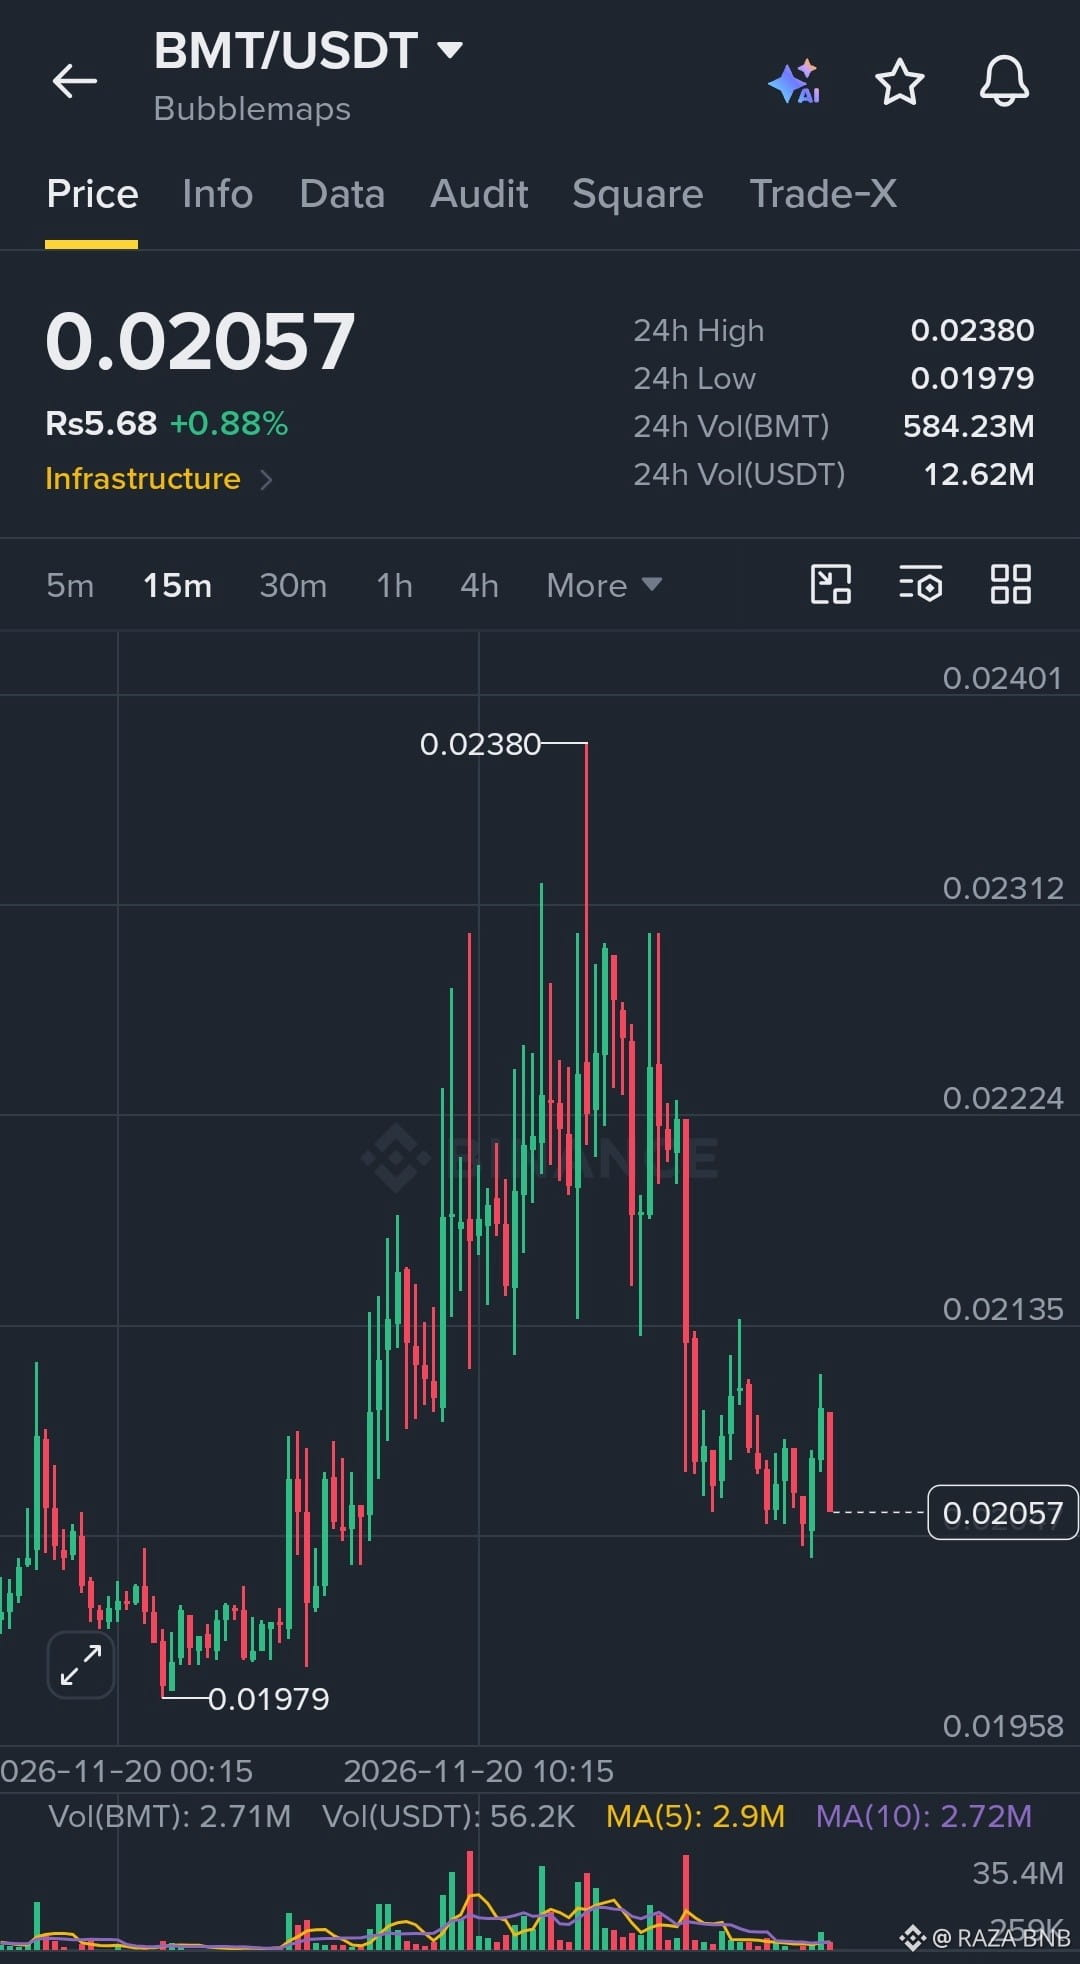
BMT is currently trading around $0.02057, showing a consolidation phase after a strong upward move followed by a pullback. Price is holding near the current support zone, making this an important area to watch for a potential bullish continuation.
🟢 LONG TRADE IDEA
Entry Zone: $0.02000 – $0.02057
🎯 Take Profit Targets:
- TP1: $0.02135
- TP2: $0.02224
- TP3: $0.02312
🛑 Stop Loss: Below $0.01979
Bullish Outlook: The bullish bias remains valid as long as BMT holds above the entry support zone.
⚡ Watch for confirmation before entering. Stay patient, manage risk, and focus on trend continuation rather than chasing price at higher levels.
$AKE $GRVT
{future}(GRVTUSDT)
{future}(AKEUSDT)
#BMT #BMTUSDT #CryptoTrading #BinanceSquare
$BMT /USDT – BULLISH RECOVERY SETUP! 📈
BMT is currently trading around $0.02057, showing a consolidation phase after a strong upward move followed by a pullback. Price is holding near the current support zone, making this an important area to watch for a potential bullish continuation.
🟢 LONG TRADE IDEA
Entry Zone: $0.02000 – $0.02057
🎯 Take Profit Targets:
- TP1: $0.02135
- TP2: $0.02224
- TP3: $0.02312
🛑 Stop Loss: Below $0.01979
Bullish Outlook: The bullish bias remains valid as long as BMT holds above the entry support zone.
⚡ Watch for confirmation before entering. Stay patient, manage risk, and focus on trend continuation rather than chasing price at higher levels.
$AKE $GRVT
#BMT #BMTUSDT #CryptoTrading #BinanceSquare
BMT is currently trading around $0.02057, showing a consolidation phase after a strong upward move followed by a pullback. Price is holding near the current support zone, making this an important area to watch for a potential bullish continuation.
🟢 LONG TRADE IDEA
Entry Zone: $0.02000 – $0.02057
🎯 Take Profit Targets:
- TP1: $0.02135
- TP2: $0.02224
- TP3: $0.02312
🛑 Stop Loss: Below $0.01979
Bullish Outlook: The bullish bias remains valid as long as BMT holds above the entry support zone.
⚡ Watch for confirmation before entering. Stay patient, manage risk, and focus on trend continuation rather than chasing price at higher levels.
$AKE $GRVT
#BMT #BMTUSDT #CryptoTrading #BinanceSquare
AQA992:
Strong recovery setups are always worth watching! 🚀 BMT is showing promising signs of bullish momentum, but confirmation above key resistance will be crucial for the next move. Smart entries, disciplined risk management, and patience are what separate successful traders from the crowd.
1
2
2.4k

·
--
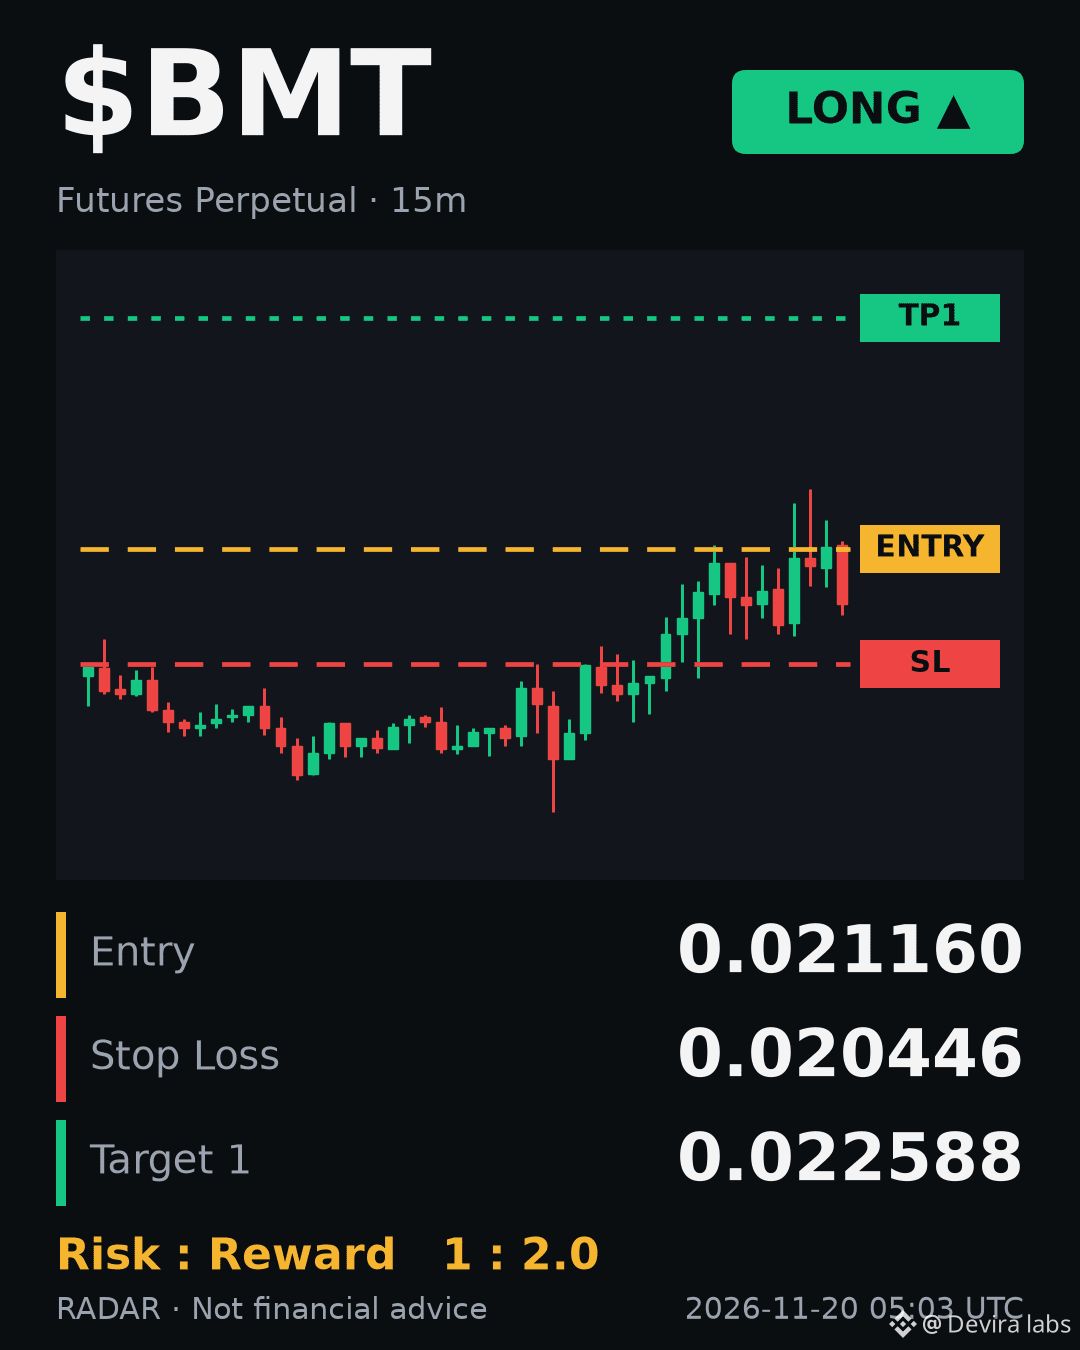
BMTUSDT Market Structure Analysis
$BMT
Market Context:
- Current Trend: Sideways / Range-bound
- Condition: Range consolidation around 0.02116
- Observation: Neutral regime without trend alignment
Technical Levels:
- Support Zone: Range low boundary
- Resistance Zone: Range high boundary
- Trend Direction: Neutral
Scenario:
Bullish Scenario:
- Clean breakout and acceptance above the range highs
Bearish Scenario:
- Decisive breakdown and acceptance below range support
Risk:
- False breakouts and chop typical of unaligned range conditions
This analysis is for educational purposes only, not financial advice. Always manage your own risk.
#RADAR #Crypto #BMTUSDT
BMTUSDT Market Structure Analysis
$BMT
Market Context:
- Current Trend: Sideways / Range-bound
- Condition: Range consolidation around 0.02116
- Observation: Neutral regime without trend alignment
Technical Levels:
- Support Zone: Range low boundary
- Resistance Zone: Range high boundary
- Trend Direction: Neutral
Scenario:
Bullish Scenario:
- Clean breakout and acceptance above the range highs
Bearish Scenario:
- Decisive breakdown and acceptance below range support
Risk:
- False breakouts and chop typical of unaligned range conditions
This analysis is for educational purposes only, not financial advice. Always manage your own risk.
#RADAR #Crypto #BMTUSDT
$BMT
Market Context:
- Current Trend: Sideways / Range-bound
- Condition: Range consolidation around 0.02116
- Observation: Neutral regime without trend alignment
Technical Levels:
- Support Zone: Range low boundary
- Resistance Zone: Range high boundary
- Trend Direction: Neutral
Scenario:
Bullish Scenario:
- Clean breakout and acceptance above the range highs
Bearish Scenario:
- Decisive breakdown and acceptance below range support
Risk:
- False breakouts and chop typical of unaligned range conditions
This analysis is for educational purposes only, not financial advice. Always manage your own risk.
#RADAR #Crypto #BMTUSDT

·
--
🚀 $BMT Showing Strong Bullish Momentum!
$BMT is making an interesting move! 🔥
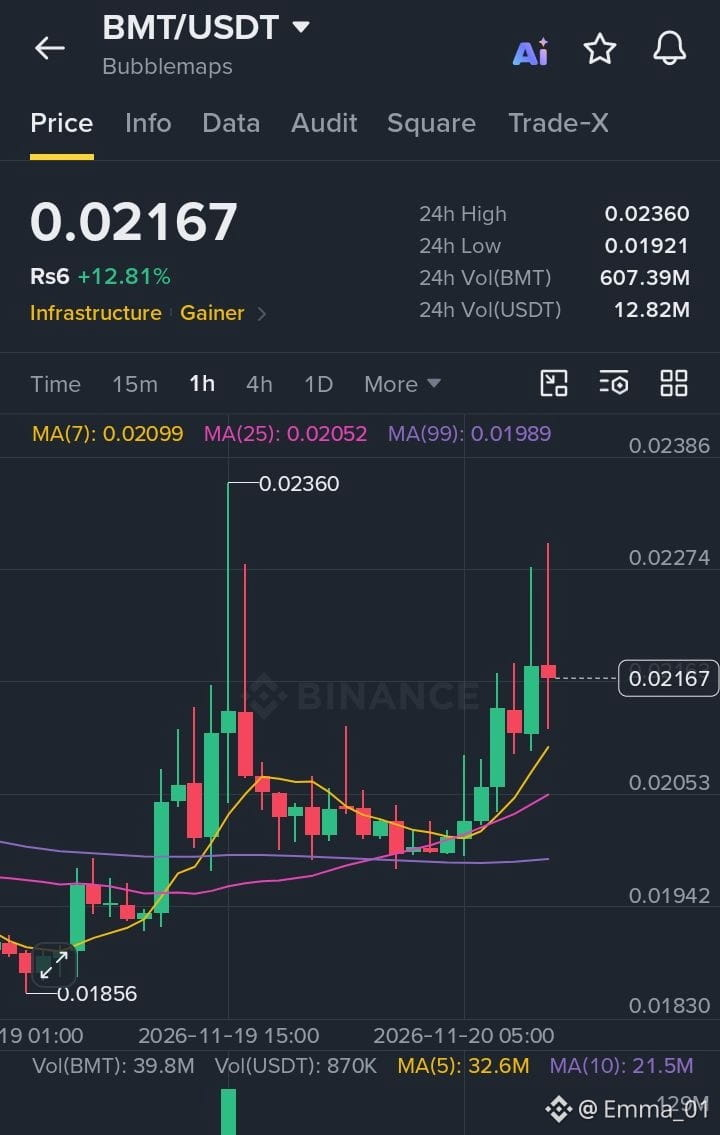
Currently trading around $0.02167, BMT is up 12.81% in the last 24 hours.
📊 My chart observations:
- Price is above MA(7), MA(25) and MA(99).
- Buying volume is increasing.
- Resistance to watch: $0.02274 – $0.02360.
- Support to watch: $0.02050 – $0.02000.
If buyers maintain this momentum, another upward move could be possible. But I'm also watching for a pullback before making any decision.
What do you think? Can $BMT break $0.02360? 👀
#BMT #BMTUSDT
{spot}(BMTUSDT)
#Crypto #Binance #Altcoins #CryptoTrading
🚀 $BMT Showing Strong Bullish Momentum!
$BMT is making an interesting move! 🔥
Currently trading around $0.02167, BMT is up 12.81% in the last 24 hours.
📊 My chart observations:
- Price is above MA(7), MA(25) and MA(99).
- Buying volume is increasing.
- Resistance to watch: $0.02274 – $0.02360.
- Support to watch: $0.02050 – $0.02000.
If buyers maintain this momentum, another upward move could be possible. But I'm also watching for a pullback before making any decision.
What do you think? Can $BMT break $0.02360? 👀
#BMT #BMTUSDT
#Crypto #Binance #Altcoins #CryptoTrading
$BMT is making an interesting move! 🔥
Currently trading around $0.02167, BMT is up 12.81% in the last 24 hours.
📊 My chart observations:
- Price is above MA(7), MA(25) and MA(99).
- Buying volume is increasing.
- Resistance to watch: $0.02274 – $0.02360.
- Support to watch: $0.02050 – $0.02000.
If buyers maintain this momentum, another upward move could be possible. But I'm also watching for a pullback before making any decision.
What do you think? Can $BMT break $0.02360? 👀
#BMT #BMTUSDT
#Crypto #Binance #Altcoins #CryptoTrading
255

BMT is ripping through the 4‑hour swing, eyes locked on the next breakout. Momentum is spilling over the recent high, carving a clean path for a long thrust.
🟢 $BMT LONG 📈
Entry $0.020420-$0.020460 | SL $0.019827 (-3.0%) | TP1 $0.020747 (+1.5%) | TP2 $0.021462 (+5.0%) | R/R 1:1.7 | Conf 64%
The market strutted into a clear change of character as price tore through the last swing low, while the cumulative volume delta stayed bullish, confirming the thrust. A fresh fair value gap aligns with a bullish order block and a liquidity sweep, creating a POI where the OB and FVG overlap, giving the setup a tight confluence.
A 3.0 % stop is relatively tight, so a modest 2‑3× leverage keeps risk in check.
Take half off at the first target to lock in the early gain.
DYOR — this isn't financial advice, size your risk accordingly 🙏
$BMT #BMTUSDT #ICP #TradingSignals #Write2Earn
BMT is ripping through the 4‑hour swing, eyes locked on the next breakout. Momentum is spilling over the recent high, carving a clean path for a long thrust.
🟢 $BMT LONG 📈
Entry $0.020420-$0.020460 | SL $0.019827 (-3.0%) | TP1 $0.020747 (+1.5%) | TP2 $0.021462 (+5.0%) | R/R 1:1.7 | Conf 64%
The market strutted into a clear change of character as price tore through the last swing low, while the cumulative volume delta stayed bullish, confirming the thrust. A fresh fair value gap aligns with a bullish order block and a liquidity sweep, creating a POI where the OB and FVG overlap, giving the setup a tight confluence.
A 3.0 % stop is relatively tight, so a modest 2‑3× leverage keeps risk in check.
Take half off at the first target to lock in the early gain.
DYOR — this isn't financial advice, size your risk accordingly 🙏
$BMT #BMTUSDT #ICP #TradingSignals #Write2Earn
🟢 $BMT LONG 📈
Entry $0.020420-$0.020460 | SL $0.019827 (-3.0%) | TP1 $0.020747 (+1.5%) | TP2 $0.021462 (+5.0%) | R/R 1:1.7 | Conf 64%
The market strutted into a clear change of character as price tore through the last swing low, while the cumulative volume delta stayed bullish, confirming the thrust. A fresh fair value gap aligns with a bullish order block and a liquidity sweep, creating a POI where the OB and FVG overlap, giving the setup a tight confluence.
A 3.0 % stop is relatively tight, so a modest 2‑3× leverage keeps risk in check.
Take half off at the first target to lock in the early gain.
DYOR — this isn't financial advice, size your risk accordingly 🙏
$BMT #BMTUSDT #ICP #TradingSignals #Write2Earn
10
BMT is hugging the 0.0122 support while the 0.0125 ceiling holds firm. Recent volume bursts push the odds toward a bullish swing.
━━━━━━━━━━━━━━━━━━━━━
🟢 $BMT LONG 📈
━━━━━━━━━━━━━━━━━━━━━
📍 Entry Range: $0.020470 – $0.020510
🛑 Stop Loss: $0.019875 (-3.0%)
🎯 TP1: $0.020797 (+1.5%)
🏆 TP2: $0.021515 (+5.0%)
⚡ R/R Ratio: 1:1.7
📊 Confidence: 64%
━━━━━━━━━━━━━━━━━━━━━
A change of character broke the descending structure and the CVD turned positive, confirming buying pressure. The fair value gap lines up with an order block, creating a POI where the OB and FVG overlap, and a liquidity sweep cleared the nearest sell wall.
A 3 % stop is relatively tight on this volatility, so 5‑10× leverage keeps risk manageable.
Take half at the first target around 0.0130 to lock in profit before the next leg.
Not financial advice — trade only what you can afford to lose 🙏
$BMT #BMTUSDT #ICP #TradingSignals #Write2Earn
BMT is hugging the 0.0122 support while the 0.0125 ceiling holds firm. Recent volume bursts push the odds toward a bullish swing.
━━━━━━━━━━━━━━━━━━━━━
🟢 $BMT LONG 📈
━━━━━━━━━━━━━━━━━━━━━
📍 Entry Range: $0.020470 – $0.020510
🛑 Stop Loss: $0.019875 (-3.0%)
🎯 TP1: $0.020797 (+1.5%)
🏆 TP2: $0.021515 (+5.0%)
⚡ R/R Ratio: 1:1.7
📊 Confidence: 64%
━━━━━━━━━━━━━━━━━━━━━
A change of character broke the descending structure and the CVD turned positive, confirming buying pressure. The fair value gap lines up with an order block, creating a POI where the OB and FVG overlap, and a liquidity sweep cleared the nearest sell wall.
A 3 % stop is relatively tight on this volatility, so 5‑10× leverage keeps risk manageable.
Take half at the first target around 0.0130 to lock in profit before the next leg.
Not financial advice — trade only what you can afford to lose 🙏
$BMT #BMTUSDT #ICP #TradingSignals #Write2Earn
━━━━━━━━━━━━━━━━━━━━━
🟢 $BMT LONG 📈
━━━━━━━━━━━━━━━━━━━━━
📍 Entry Range: $0.020470 – $0.020510
🛑 Stop Loss: $0.019875 (-3.0%)
🎯 TP1: $0.020797 (+1.5%)
🏆 TP2: $0.021515 (+5.0%)
⚡ R/R Ratio: 1:1.7
📊 Confidence: 64%
━━━━━━━━━━━━━━━━━━━━━
A change of character broke the descending structure and the CVD turned positive, confirming buying pressure. The fair value gap lines up with an order block, creating a POI where the OB and FVG overlap, and a liquidity sweep cleared the nearest sell wall.
A 3 % stop is relatively tight on this volatility, so 5‑10× leverage keeps risk manageable.
Take half at the first target around 0.0130 to lock in profit before the next leg.
Not financial advice — trade only what you can afford to lose 🙏
$BMT #BMTUSDT #ICP #TradingSignals #Write2Earn
9
·
--
$BMTUSDT
$BMT
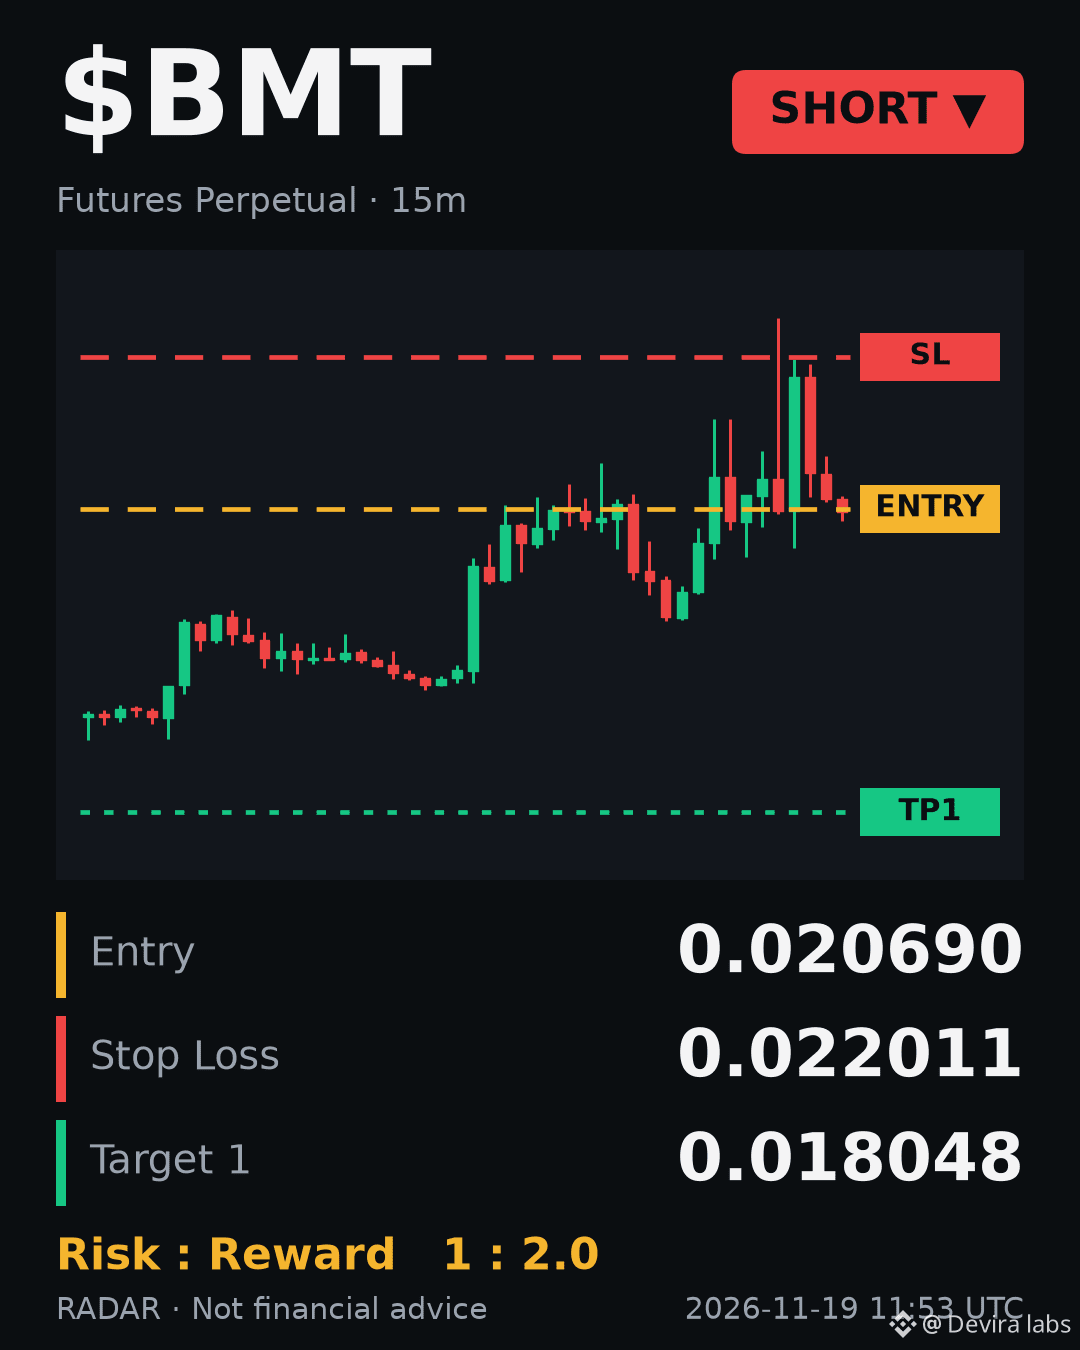
BMT is flashing signs of directional alignment on the short side, though the broader backdrop demands patience.
Current metrics show strong alignment leaning lower. Still, price action remains locked inside a range market, which often brings choppy rotations rather than clean trend continuation. Without a structural breakdown, the boundaries of the range dictate the flow.
The primary risk stems from this range-bound environment, where compressed action can limit follow-through and trigger sharp tests against early positioning.
Are you fading range highs here, or waiting for a confirmed breakdown first?
This is my personal trading plan, not financial advice.
#RADAR #Crypto #BMTUSDT
$BMTUSDT
$BMT
BMT is flashing signs of directional alignment on the short side, though the broader backdrop demands patience.
Current metrics show strong alignment leaning lower. Still, price action remains locked inside a range market, which often brings choppy rotations rather than clean trend continuation. Without a structural breakdown, the boundaries of the range dictate the flow.
The primary risk stems from this range-bound environment, where compressed action can limit follow-through and trigger sharp tests against early positioning.
Are you fading range highs here, or waiting for a confirmed breakdown first?
This is my personal trading plan, not financial advice.
#RADAR #Crypto #BMTUSDT
$BMT
BMT is flashing signs of directional alignment on the short side, though the broader backdrop demands patience.
Current metrics show strong alignment leaning lower. Still, price action remains locked inside a range market, which often brings choppy rotations rather than clean trend continuation. Without a structural breakdown, the boundaries of the range dictate the flow.
The primary risk stems from this range-bound environment, where compressed action can limit follow-through and trigger sharp tests against early positioning.
Are you fading range highs here, or waiting for a confirmed breakdown first?
This is my personal trading plan, not financial advice.
#RADAR #Crypto #BMTUSDT
23

·
--
Bullish
$BMT
━━━━━━━━━━━━━━━━━━━━
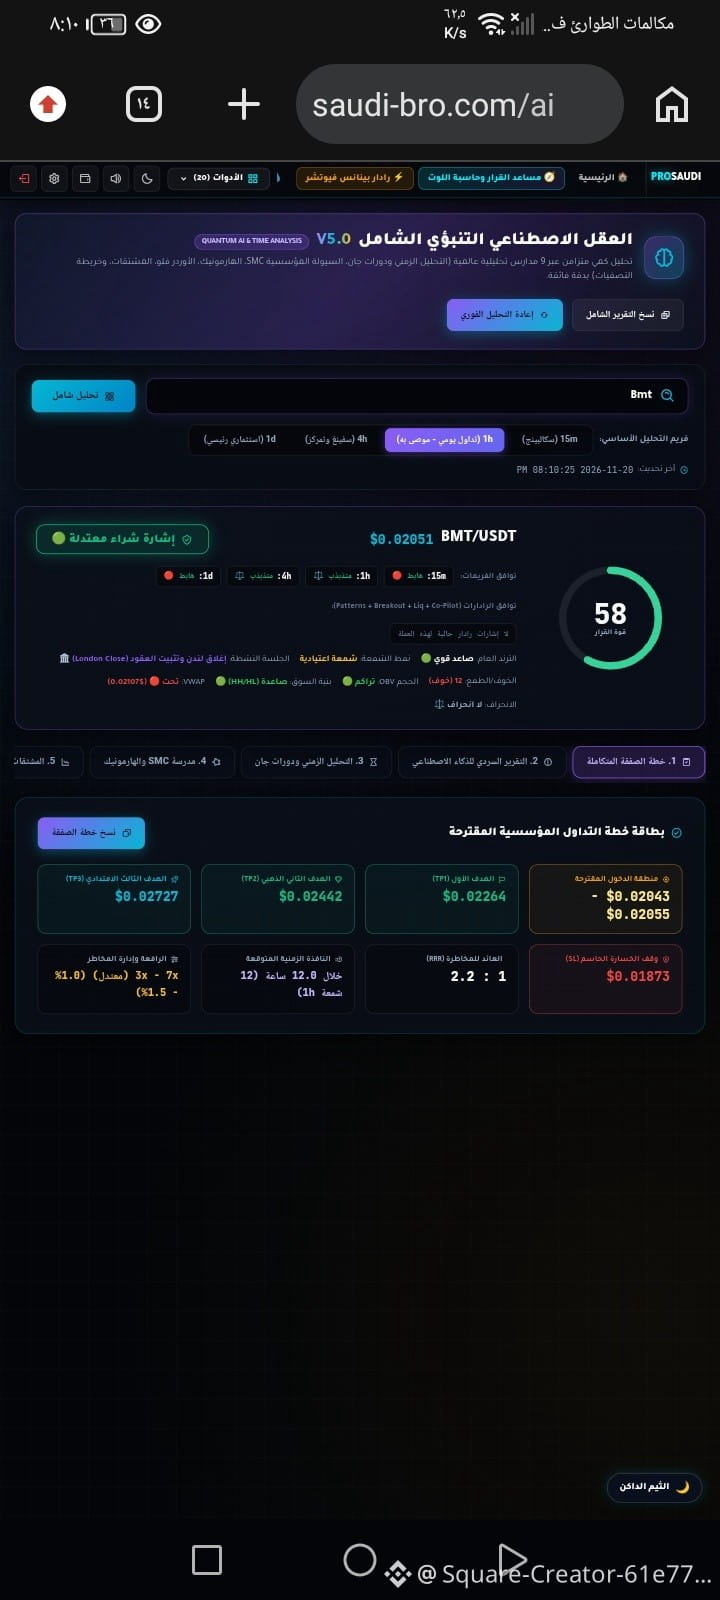
📊 Currency: $BMT
⏱️ Timeframe: 1h
🧭 Direction: Bullish buy 🟢 (LONG)
⭐ Decision strength: 58% (Moderate buy signal 🟢)
━━━━━━━━━━━━━━━━━━━━
🎯 Entry range: $0.02043 - $0.02055
🏆 First target TP1: $0.02264
🥇 Second target TP2: $0.02442
🚀 Third target TP3: $0.02727
🛑 Stop loss SL: $0.01873
⚖️ Reward-to-risk ratio: 1 : 2.2
⏳ Time window: Within 12.0 hours (12 1h candles)
⚙️ Suggested leverage: 3x - 7x (moderate)
━━━━━━━━━━━━━━━━━━━━
{future}(BMTUSDT)
#BMTUSDT #BinanceSquare
$BMT
━━━━━━━━━━━━━━━━━━━━
📊 Currency: $BMT
⏱️ Timeframe: 1h
🧭 Direction: Bullish buy 🟢 (LONG)
⭐ Decision strength: 58% (Moderate buy signal 🟢)
━━━━━━━━━━━━━━━━━━━━
🎯 Entry range: $0.02043 - $0.02055
🏆 First target TP1: $0.02264
🥇 Second target TP2: $0.02442
🚀 Third target TP3: $0.02727
🛑 Stop loss SL: $0.01873
⚖️ Reward-to-risk ratio: 1 : 2.2
⏳ Time window: Within 12.0 hours (12 1h candles)
⚙️ Suggested leverage: 3x - 7x (moderate)
━━━━━━━━━━━━━━━━━━━━
#BMTUSDT #BinanceSquare
━━━━━━━━━━━━━━━━━━━━
📊 Currency: $BMT
⏱️ Timeframe: 1h
🧭 Direction: Bullish buy 🟢 (LONG)
⭐ Decision strength: 58% (Moderate buy signal 🟢)
━━━━━━━━━━━━━━━━━━━━
🎯 Entry range: $0.02043 - $0.02055
🏆 First target TP1: $0.02264
🥇 Second target TP2: $0.02442
🚀 Third target TP3: $0.02727
🛑 Stop loss SL: $0.01873
⚖️ Reward-to-risk ratio: 1 : 2.2
⏳ Time window: Within 12.0 hours (12 1h candles)
⚙️ Suggested leverage: 3x - 7x (moderate)
━━━━━━━━━━━━━━━━━━━━
#BMTUSDT #BinanceSquare
اسعد الصفار:
تم طال عمرك
5
2
457

·
--
Bullish
$BMT USDT (Bubblemaps) | LONG SETUP
BMT is showing a positive move of +14.98%, with the current price around 0.02372.
📊 Market Condition: Short-term bullish sentiment is present. However, buyers need to maintain momentum to push toward higher levels.
🟢 Trade Setup: LONG
- Entry Price (EP): 0.02277 – 0.02325
- Take Profit 1: 0.02439
- Take Profit 2: 0.02531
- Stop Loss (SL): 0.02186
💡 My Strategy: Look for a controlled retracement and a confirmed bounce. If support holds, the next upside targets become interesting.
#BMTUSDT #Bubblemaps #CryptoMarket
$BMT
{future}(BMTUSDT)
$BMT USDT (Bubblemaps) | LONG SETUP
BMT is showing a positive move of +14.98%, with the current price around 0.02372.
📊 Market Condition: Short-term bullish sentiment is present. However, buyers need to maintain momentum to push toward higher levels.
🟢 Trade Setup: LONG
- Entry Price (EP): 0.02277 – 0.02325
- Take Profit 1: 0.02439
- Take Profit 2: 0.02531
- Stop Loss (SL): 0.02186
💡 My Strategy: Look for a controlled retracement and a confirmed bounce. If support holds, the next upside targets become interesting.
#BMTUSDT #Bubblemaps #CryptoMarket
$BMT
BMT is showing a positive move of +14.98%, with the current price around 0.02372.
📊 Market Condition: Short-term bullish sentiment is present. However, buyers need to maintain momentum to push toward higher levels.
🟢 Trade Setup: LONG
- Entry Price (EP): 0.02277 – 0.02325
- Take Profit 1: 0.02439
- Take Profit 2: 0.02531
- Stop Loss (SL): 0.02186
💡 My Strategy: Look for a controlled retracement and a confirmed bounce. If support holds, the next upside targets become interesting.
#BMTUSDT #Bubblemaps #CryptoMarket
$BMT
35
·
--
$BMTUSDT
$BMT
We are seeing strong alignment across key metrics, suggesting buyers may look to establish footing here.
While conditions show solid directional confluence, price action remains bound within an established range.
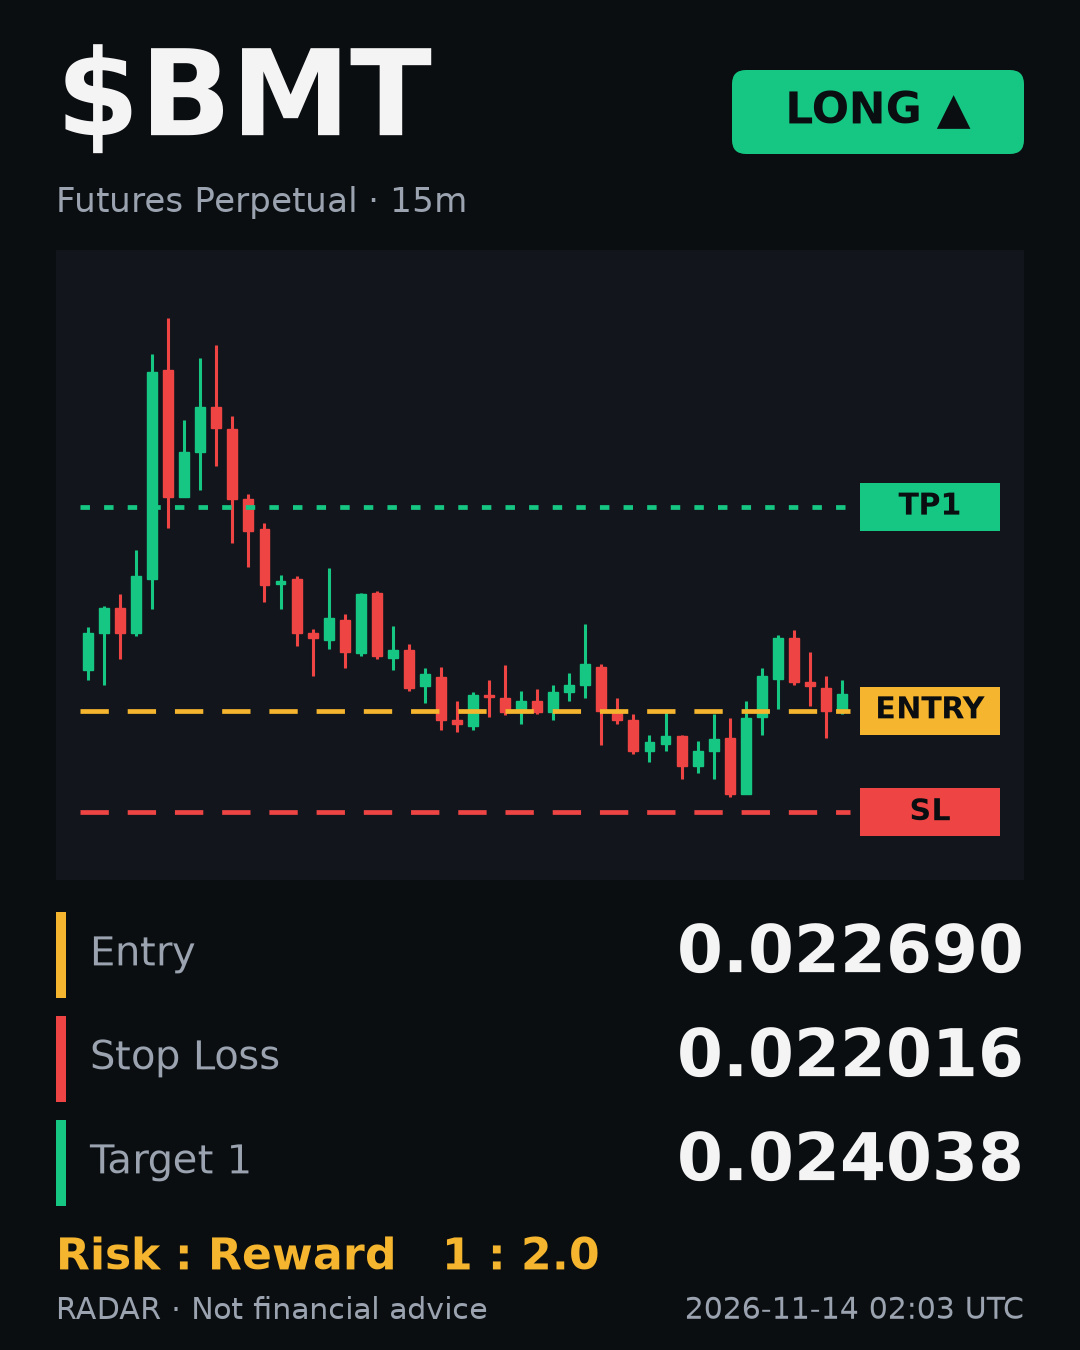
Entry: 0.02269
SL: 0.022016
TP: 0.024038
R:R: 1:2.0
Risk:
• Range market structure could limit upside potential.
Are you anticipating a breakout, or will this range hold?
This is my personal trading plan, not financial advice. Risk management comes first.
#RADAR #Crypto #BMTUSDT
$BMTUSDT
$BMT
We are seeing strong alignment across key metrics, suggesting buyers may look to establish footing here.
While conditions show solid directional confluence, price action remains bound within an established range.
Entry: 0.02269
SL: 0.022016
TP: 0.024038
R:R: 1:2.0
Risk:
• Range market structure could limit upside potential.
Are you anticipating a breakout, or will this range hold?
This is my personal trading plan, not financial advice. Risk management comes first.
#RADAR #Crypto #BMTUSDT
$BMT
We are seeing strong alignment across key metrics, suggesting buyers may look to establish footing here.
While conditions show solid directional confluence, price action remains bound within an established range.
Entry: 0.02269
SL: 0.022016
TP: 0.024038
R:R: 1:2.0
Risk:
• Range market structure could limit upside potential.
Are you anticipating a breakout, or will this range hold?
This is my personal trading plan, not financial advice. Risk management comes first.
#RADAR #Crypto #BMTUSDT
34

🍈 The sweet taste of victory is spreading across all trades, sweeping away the fatigue of the long wait.
🎯 LONG $BMT
Entry: 0.0232
TP: 0.0244 | SL: 0.0209
💎 Every quality project is a rough diamond that needs time to be polished.
🔍 The retest of the breakout zone played out perfectly by the book.
🛡️ Protecting personal information is extremely important in today's digital world.
🌸 I hope you achieve more success than you could ever expect.
#BMTUSDT $BMTUSDT
🍈 The sweet taste of victory is spreading across all trades, sweeping away the fatigue of the long wait.
🎯 LONG $BMT
Entry: 0.0232
TP: 0.0244 | SL: 0.0209
💎 Every quality project is a rough diamond that needs time to be polished.
🔍 The retest of the breakout zone played out perfectly by the book.
🛡️ Protecting personal information is extremely important in today's digital world.
🌸 I hope you achieve more success than you could ever expect.
#BMTUSDT $BMTUSDT
🎯 LONG $BMT
Entry: 0.0232
TP: 0.0244 | SL: 0.0209
💎 Every quality project is a rough diamond that needs time to be polished.
🔍 The retest of the breakout zone played out perfectly by the book.
🛡️ Protecting personal information is extremely important in today's digital world.
🌸 I hope you achieve more success than you could ever expect.
#BMTUSDT $BMTUSDT
22
🍲 The warmth from enormous profits brings joy and complete happiness to my family.
📈 LONG $BMT
Entry: 0.0235
TP: 0.0246 | SL: 0.0211
📜 Operating licenses for major exchanges are paving the way for institutional capital.
📊 The McClellan Oscillator confirms that money is flowing broadly across the market.
🌟 Success comes not from winning every trade, but from managing losses.
🌸 Wishing you an optimistic mindset through every price fluctuation.
#BMTUSDT $BMTUSDT
🍲 The warmth from enormous profits brings joy and complete happiness to my family.
📈 LONG $BMT
Entry: 0.0235
TP: 0.0246 | SL: 0.0211
📜 Operating licenses for major exchanges are paving the way for institutional capital.
📊 The McClellan Oscillator confirms that money is flowing broadly across the market.
🌟 Success comes not from winning every trade, but from managing losses.
🌸 Wishing you an optimistic mindset through every price fluctuation.
#BMTUSDT $BMTUSDT
📈 LONG $BMT
Entry: 0.0235
TP: 0.0246 | SL: 0.0211
📜 Operating licenses for major exchanges are paving the way for institutional capital.
📊 The McClellan Oscillator confirms that money is flowing broadly across the market.
🌟 Success comes not from winning every trade, but from managing losses.
🌸 Wishing you an optimistic mindset through every price fluctuation.
#BMTUSDT $BMTUSDT
17
📔 Know when to stop before it’s too late—the downtrend is still strong, and there’s no sign of a bottom yet.
🟢 SHORT $BMT
Entry: 0.0219
TP: 0.0208 | SL: 0.0241
☀️ The light of blockchain technology will illuminate the path to prosperity.
🔍 The strongly rising MA50 provides solid support for the price.
💎 Let your results speak for themselves instead of boasting about what you have.
🌞 May you always lead the flow of money and master your own destiny.
#BMTUSDT $BMTUSDT
📔 Know when to stop before it’s too late—the downtrend is still strong, and there’s no sign of a bottom yet.
🟢 SHORT $BMT
Entry: 0.0219
TP: 0.0208 | SL: 0.0241
☀️ The light of blockchain technology will illuminate the path to prosperity.
🔍 The strongly rising MA50 provides solid support for the price.
💎 Let your results speak for themselves instead of boasting about what you have.
🌞 May you always lead the flow of money and master your own destiny.
#BMTUSDT $BMTUSDT
🟢 SHORT $BMT
Entry: 0.0219
TP: 0.0208 | SL: 0.0241
☀️ The light of blockchain technology will illuminate the path to prosperity.
🔍 The strongly rising MA50 provides solid support for the price.
💎 Let your results speak for themselves instead of boasting about what you have.
🌞 May you always lead the flow of money and master your own destiny.
#BMTUSDT $BMTUSDT
27
A 3% stop puts the trade at a tight risk band; with 5x leverage the position stays under a 15% equity swing. BMT is crumbling under fresh bearish pressure, eyeing the next swing low.
🔴 $BMT SHORT 📉
Entry → $0.022937-$0.022983
Stop → $0.023649 (-3.0%)
TP1 → $0.022616 (+1.5%)
TP2 → $0.021812 (+5.0%)
R/R 1:1.7 • Confidence 64%
The market structure broke lower, confirming a CHoCH, while the CVD turned negative, feeding the short bias. A fresh fair value gap lines up with an order block and a liquidity sweep, creating a POI confluence that screams downside.
The 3% stop is relatively tight, so 5x or lower leverage keeps the risk manageable.
Take half profit at the first target around 1.7 R.
DYOR — this isn't financial advice, size your risk accordingly 🙏
$BMT #BMTUSDT #BitcoinFiveWeeklyLosses #TradingSignals #Write2Earn
A 3% stop puts the trade at a tight risk band; with 5x leverage the position stays under a 15% equity swing. BMT is crumbling under fresh bearish pressure, eyeing the next swing low.
🔴 $BMT SHORT 📉
Entry → $0.022937-$0.022983
Stop → $0.023649 (-3.0%)
TP1 → $0.022616 (+1.5%)
TP2 → $0.021812 (+5.0%)
R/R 1:1.7 • Confidence 64%
The market structure broke lower, confirming a CHoCH, while the CVD turned negative, feeding the short bias. A fresh fair value gap lines up with an order block and a liquidity sweep, creating a POI confluence that screams downside.
The 3% stop is relatively tight, so 5x or lower leverage keeps the risk manageable.
Take half profit at the first target around 1.7 R.
DYOR — this isn't financial advice, size your risk accordingly 🙏
$BMT #BMTUSDT #BitcoinFiveWeeklyLosses #TradingSignals #Write2Earn
🔴 $BMT SHORT 📉
Entry → $0.022937-$0.022983
Stop → $0.023649 (-3.0%)
TP1 → $0.022616 (+1.5%)
TP2 → $0.021812 (+5.0%)
R/R 1:1.7 • Confidence 64%
The market structure broke lower, confirming a CHoCH, while the CVD turned negative, feeding the short bias. A fresh fair value gap lines up with an order block and a liquidity sweep, creating a POI confluence that screams downside.
The 3% stop is relatively tight, so 5x or lower leverage keeps the risk manageable.
Take half profit at the first target around 1.7 R.
DYOR — this isn't financial advice, size your risk accordingly 🙏
$BMT #BMTUSDT #BitcoinFiveWeeklyLosses #TradingSignals #Write2Earn
13

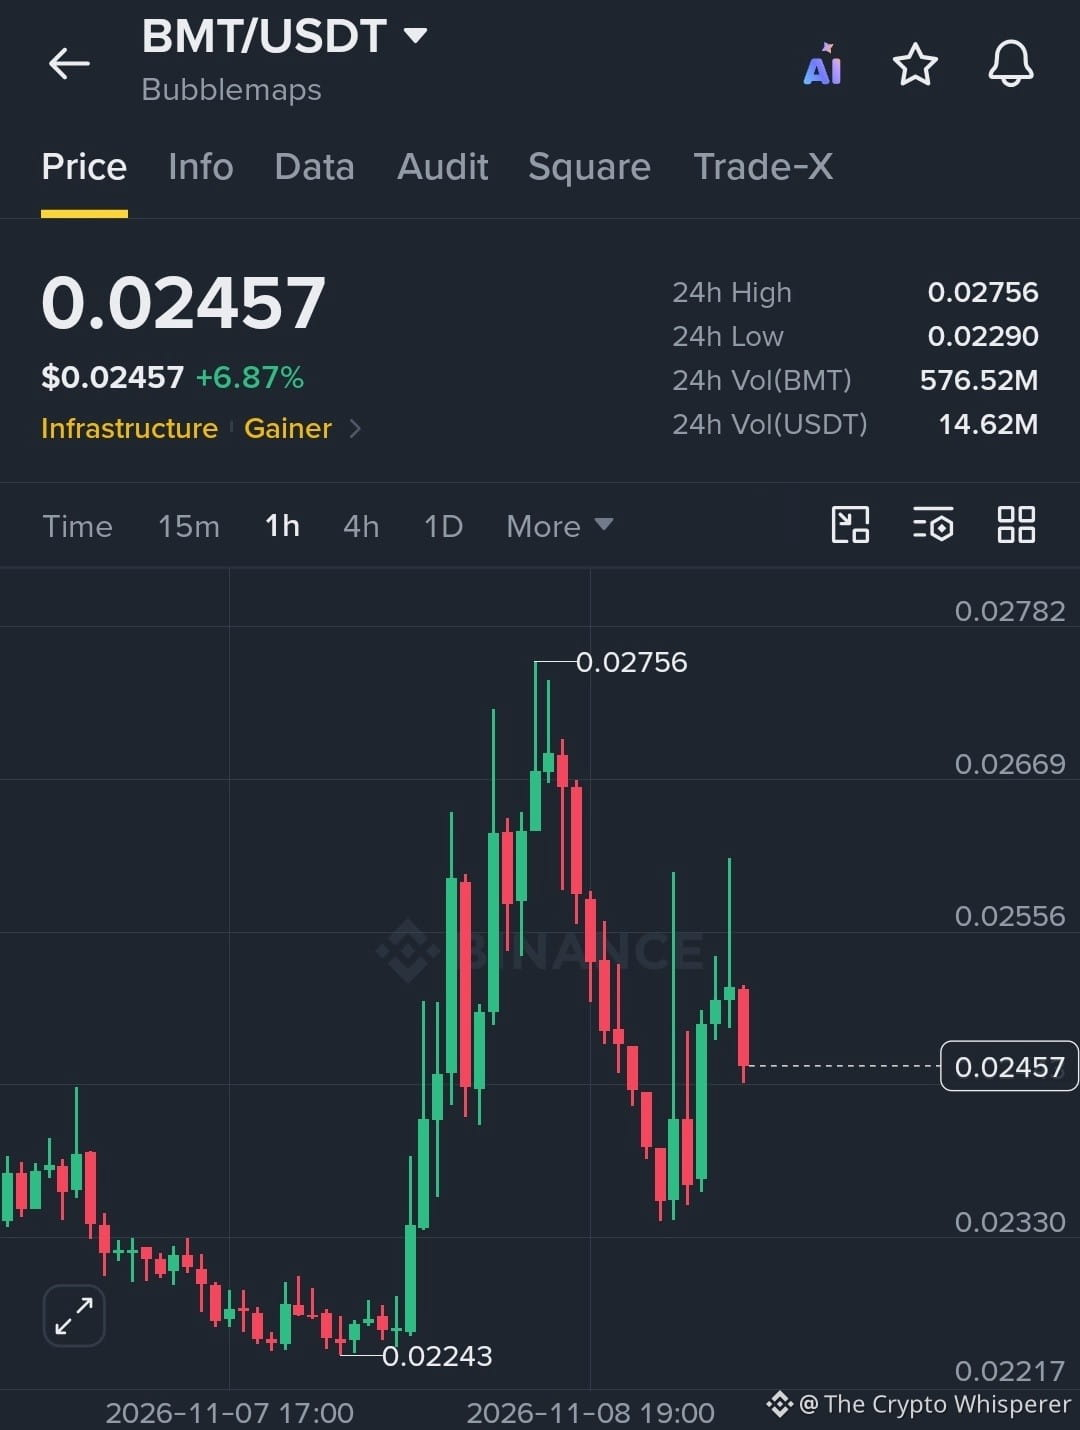
$BMT /USDT SHORT TRADE 🛑
Entry Zone: 0.02450 – 0.02480
SL: 0.02575
TP1: 0.02400
TP2: 0.02330
TP3: 0.02290
BMT is showing signs of rejection after failing to maintain its recent recovery. The price is facing resistance around 0.02520–0.02556, while bearish momentum is returning. A breakdown below 0.02450 could accelerate selling pressure toward lower support levels.
#BMTUSDT #CryptoSignals #Binance
{spot}(BMTUSDT)
$BMT /USDT SHORT TRADE 🛑
Entry Zone: 0.02450 – 0.02480
SL: 0.02575
TP1: 0.02400
TP2: 0.02330
TP3: 0.02290
BMT is showing signs of rejection after failing to maintain its recent recovery. The price is facing resistance around 0.02520–0.02556, while bearish momentum is returning. A breakdown below 0.02450 could accelerate selling pressure toward lower support levels.
#BMTUSDT #CryptoSignals #Binance
Entry Zone: 0.02450 – 0.02480
SL: 0.02575
TP1: 0.02400
TP2: 0.02330
TP3: 0.02290
BMT is showing signs of rejection after failing to maintain its recent recovery. The price is facing resistance around 0.02520–0.02556, while bearish momentum is returning. A breakdown below 0.02450 could accelerate selling pressure toward lower support levels.
#BMTUSDT #CryptoSignals #Binance
94
🍭 The bitter taste of losses right now is making me realize that making money in real life is still the real deal.
⚡ SHORT $BMT
Entry: 0.0233
TP: 0.0222 | SL: 0.0257
💼 Multinational corporations are starting to accept crypto payments.
📉 Short positions being forced to liquidate are creating upward price pressure.
💎 Always appreciate what you have while striving for what you...
🌞 I hope you have wonderful experiences and learn the most valuable lessons.
#BMTUSDT $BMTUSDT
🍭 The bitter taste of losses right now is making me realize that making money in real life is still the real deal.
⚡ SHORT $BMT
Entry: 0.0233
TP: 0.0222 | SL: 0.0257
💼 Multinational corporations are starting to accept crypto payments.
📉 Short positions being forced to liquidate are creating upward price pressure.
💎 Always appreciate what you have while striving for what you...
🌞 I hope you have wonderful experiences and learn the most valuable lessons.
#BMTUSDT $BMTUSDT
⚡ SHORT $BMT
Entry: 0.0233
TP: 0.0222 | SL: 0.0257
💼 Multinational corporations are starting to accept crypto payments.
📉 Short positions being forced to liquidate are creating upward price pressure.
💎 Always appreciate what you have while striving for what you...
🌞 I hope you have wonderful experiences and learn the most valuable lessons.
#BMTUSDT $BMTUSDT
19

·
--
Bullish
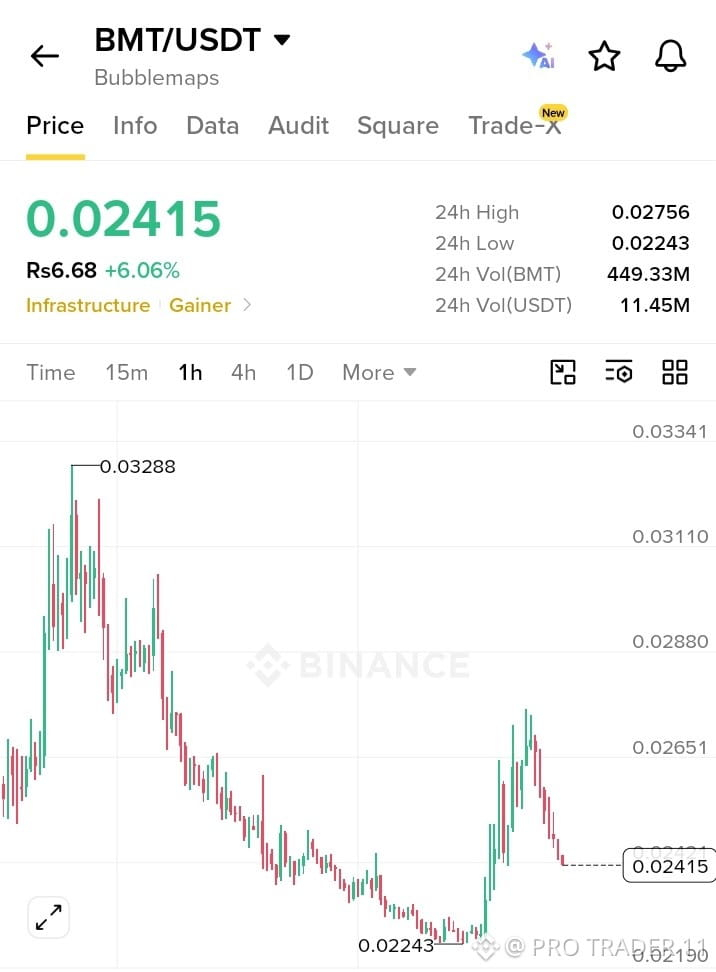
🚀 $BMT BREAKOUT ALERT: $0.02756 NEXT TARGET_
Long Entry: 0.02350–0.02415
SL: 0.02240
TP1: 0.02651
TP2: 0.02756
TP3: 0.02880
#BMT #BMTUSDT #Bubblemaps #BinanceGainer
{future}(BMTUSDT)
🚀 $BMT BREAKOUT ALERT: $0.02756 NEXT TARGET_
Long Entry: 0.02350–0.02415
SL: 0.02240
TP1: 0.02651
TP2: 0.02756
TP3: 0.02880
#BMT #BMTUSDT #Bubblemaps #BinanceGainer
Long Entry: 0.02350–0.02415
SL: 0.02240
TP1: 0.02651
TP2: 0.02756
TP3: 0.02880
#BMT #BMTUSDT #Bubblemaps #BinanceGainer
1
187

·
--
📊 Real-time monitoring of unusual Binance token movements
🔍 Unusual bullish moves / unusual bearish moves / wick spikes + funding rate alerts
🛠 Custom solutions available; partners welcome to get in touch
⚠️ BMTUSDT Funding Rate Alert ⚠️
Token: BMTUSDT (perpetual contract)
Funding rate: -1.0029% (negative rate has reached the alert threshold)
Settlement interval: Every 4 hours
Next settlement: 2026-11-09 12:00:00
Current time: 2026-11-09 08:53:03
💡 Interpretation
The persistently deep negative rate indicates that short-position holders are paying fees to long-position holders, a pattern commonly seen when short positions are crowded. If the price reverses and surges, the potential for a short squeeze is stronger, but beware of one-sided sentiment becoming overheated.
#BMTUSDT #资金费率 #Binance Square
📊 Real-time monitoring of unusual Binance token movements
🔍 Unusual bullish moves / unusual bearish moves / wick spikes + funding rate alerts
🛠 Custom solutions available; partners welcome to get in touch
⚠️ BMTUSDT Funding Rate Alert ⚠️
Token: BMTUSDT (perpetual contract)
Funding rate: -1.0029% (negative rate has reached the alert threshold)
Settlement interval: Every 4 hours
Next settlement: 2026-11-09 12:00:00
Current time: 2026-11-09 08:53:03
💡 Interpretation
The persistently deep negative rate indicates that short-position holders are paying fees to long-position holders, a pattern commonly seen when short positions are crowded. If the price reverses and surges, the potential for a short squeeze is stronger, but beware of one-sided sentiment becoming overheated.
#BMTUSDT #资金费率 #Binance Square
🔍 Unusual bullish moves / unusual bearish moves / wick spikes + funding rate alerts
🛠 Custom solutions available; partners welcome to get in touch
⚠️ BMTUSDT Funding Rate Alert ⚠️
Token: BMTUSDT (perpetual contract)
Funding rate: -1.0029% (negative rate has reached the alert threshold)
Settlement interval: Every 4 hours
Next settlement: 2026-11-09 12:00:00
Current time: 2026-11-09 08:53:03
💡 Interpretation
The persistently deep negative rate indicates that short-position holders are paying fees to long-position holders, a pattern commonly seen when short positions are crowded. If the price reverses and surges, the potential for a short squeeze is stronger, but beware of one-sided sentiment becoming overheated.
#BMTUSDT #资金费率 #Binance Square
98

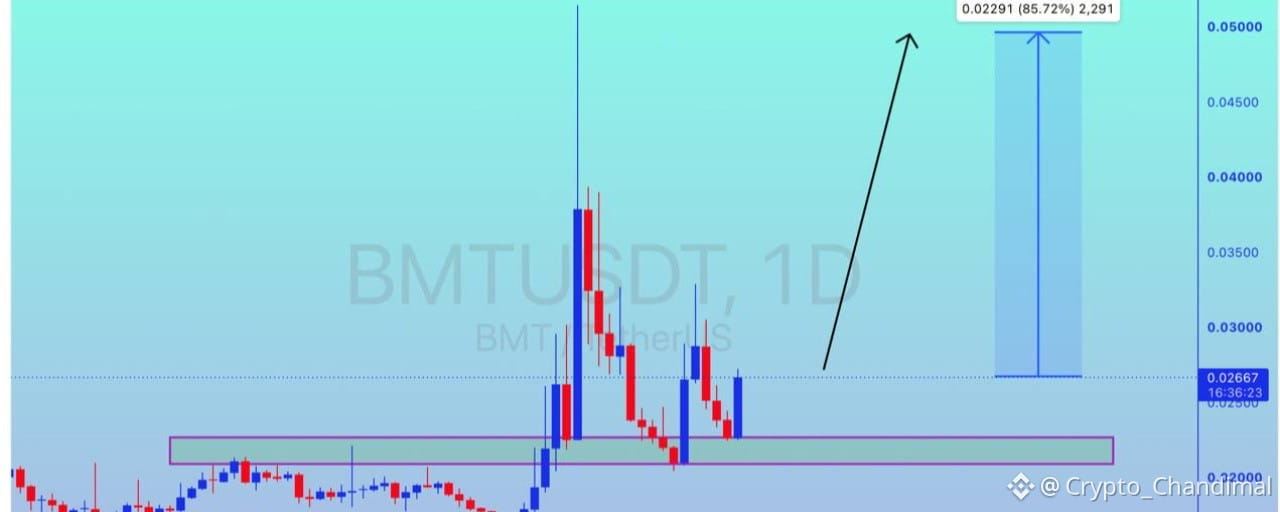

·
--
Bullish
🚨 New Trading Signal 🚨
💰 Coin: BMTUSDT
⏱ Timeframe: 5m
🔔 Type: Buy 📈
⭐ Score: 4.8
🧠 Sentiment: 0.00
📊 Market Regime: Bullish
💰 Current Price: 0.02453
🎯 Entry Price: 0.02453
🛑 Stop Loss: 0.02403
🏆 Targets:
TP1: 0.02487
TP2: 0.02505
TP3: 0.02543
📐 Position Size: 201610.444152 units
⚙️ Leverage: 10x
💵 Margin: 494.55 USDT
📊 Notional Value: 4945.50 USDT
📝 Signal Reasons:
- Price above EMA99
- Overall trend is bullish
- Market regime is bullish
- Bullish breakout above 0.02388
- Funding rate is negative (-0.0061)
📐 Support and Resistance:
Support: 0.02428 - ATR = 0.00025 => Stop at 0.02403
Resistance:
- TP1: 0.02487
- TP2: 0.02505
- TP3: 0.02543
#BMTUSDT $BMT
{future}(BMTUSDT)
🚨 New Trading Signal 🚨
💰 Coin: BMTUSDT
⏱ Timeframe: 5m
🔔 Type: Buy 📈
⭐ Score: 4.8
🧠 Sentiment: 0.00
📊 Market Regime: Bullish
💰 Current Price: 0.02453
🎯 Entry Price: 0.02453
🛑 Stop Loss: 0.02403
🏆 Targets:
TP1: 0.02487
TP2: 0.02505
TP3: 0.02543
📐 Position Size: 201610.444152 units
⚙️ Leverage: 10x
💵 Margin: 494.55 USDT
📊 Notional Value: 4945.50 USDT
📝 Signal Reasons:
- Price above EMA99
- Overall trend is bullish
- Market regime is bullish
- Bullish breakout above 0.02388
- Funding rate is negative (-0.0061)
📐 Support and Resistance:
Support: 0.02428 - ATR = 0.00025 => Stop at 0.02403
Resistance:
- TP1: 0.02487
- TP2: 0.02505
- TP3: 0.02543
#BMTUSDT $BMT
💰 Coin: BMTUSDT
⏱ Timeframe: 5m
🔔 Type: Buy 📈
⭐ Score: 4.8
🧠 Sentiment: 0.00
📊 Market Regime: Bullish
💰 Current Price: 0.02453
🎯 Entry Price: 0.02453
🛑 Stop Loss: 0.02403
🏆 Targets:
TP1: 0.02487
TP2: 0.02505
TP3: 0.02543
📐 Position Size: 201610.444152 units
⚙️ Leverage: 10x
💵 Margin: 494.55 USDT
📊 Notional Value: 4945.50 USDT
📝 Signal Reasons:
- Price above EMA99
- Overall trend is bullish
- Market regime is bullish
- Bullish breakout above 0.02388
- Funding rate is negative (-0.0061)
📐 Support and Resistance:
Support: 0.02428 - ATR = 0.00025 => Stop at 0.02403
Resistance:
- TP1: 0.02487
- TP2: 0.02505
- TP3: 0.02543
#BMTUSDT $BMT
1
130
Log in to explore more content
Join global crypto users on Binance Square
⚡️ Get latest and useful information about crypto.
💬 Trusted by the world’s largest crypto exchange.
👍 Discover real insights from verified creators.
Email / Phone number
Trending Topics
1
#CanBTCReboundAfterFallingBelow60K?
111,991 views
501 Discussing
2
#GlobalStocksFaceLongestLosingStreakSince2023
48,293 views
494 Discussing
3
#AnthropicPlungesTowardIPOPriceonDay2
15,582 views
197 Discussing
4
#GaoTengBitcoinETFListsOnHKEX
36,530 views
386 Discussing
5
#TradFiForBeginners
1M views
5,816 Discussing
6
#NvidiaBoardReportedlySplitOverHuang’sReturn
397,953 views
2,580 Discussing
7
#TetherBurns8BillionUSDTInPast20Days
42,864 views
158 Discussing
8
#BitcoinWalletSignatureFlawExploitableWithinSeconds
12,076 views
75 Discussing
9
#CanGTA6'sLaunchLiftTTWOShares?
334,345 views
1,807 Discussing
10
#HongKongProposesSFCLicensingForFourVirtualAssetServices
2,133 views
36 Discussing