
#28
28
17,128 views
104 Discussing
Hot
Latest

60-SECOND ALPHA #28 | $DASH
$DASH is a useful reminder that crypto narratives can change over time. Originally known mainly around digital payments and privacy, Dash has had to evolve as the wider crypto market became much more competitive.
The lesson is simple: being early to a category does not guarantee permanent dominance. Projects have to keep adapting as user expectations and competing technology change.
Alpha: In crypto, surviving the narrative shift can matter as much as starting the narrative.
$DASH is a useful reminder that crypto narratives can change over time. Originally known mainly around digital payments and privacy, Dash has had to evolve as the wider crypto market became much more competitive.
The lesson is simple: being early to a category does not guarantee permanent dominance. Projects have to keep adapting as user expectations and competing technology change.
Alpha: In crypto, surviving the narrative shift can matter as much as starting the narrative.

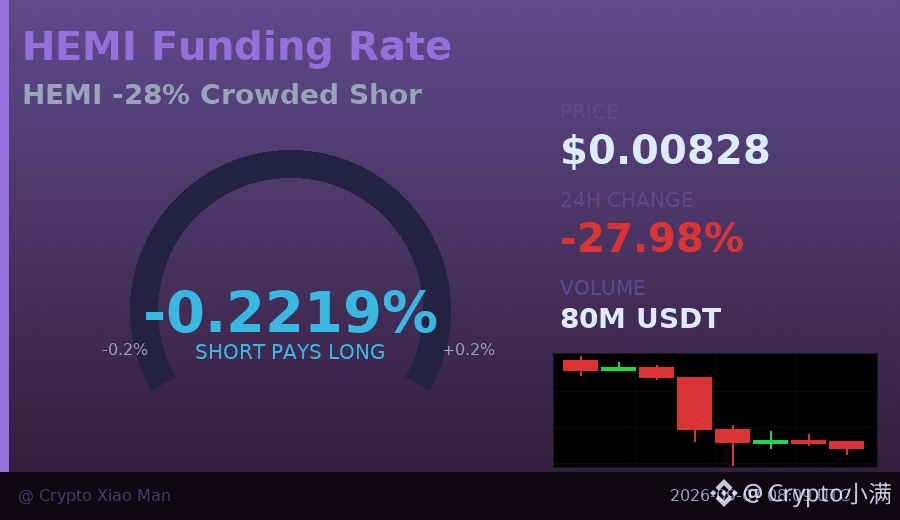
Down 28% in 24 hours, yet the funding rate has surged to -0.22% — what is happening to Hakimi?
The price has kept sliding to 0.00828, and the hourly candlestick chart has closed three bearish candles in a row, making it look like the bears are fully in control. But interestingly, 55% of open positions are shorts, so the crowding is already quite high.
Such an extreme negative funding rate usually means two things: either shorts are aggressively using leverage to bet on further declines, or someone is accumulating at the high funding cost. Trading volume of 79M USDT is not small, which suggests this is not a low-volume grind lower.
I tend to think this is close to a short-term sentiment bottom. That doesn't mean an immediate rebound, but chasing shorts has already become a poor risk-reward trade; instead, it may be worth watching for signs of stabilization.
$HEMI #资金费率极端 #28%跌幅
Click the small card below to quickly check the market 👇
The price has kept sliding to 0.00828, and the hourly candlestick chart has closed three bearish candles in a row, making it look like the bears are fully in control. But interestingly, 55% of open positions are shorts, so the crowding is already quite high.
Such an extreme negative funding rate usually means two things: either shorts are aggressively using leverage to bet on further declines, or someone is accumulating at the high funding cost. Trading volume of 79M USDT is not small, which suggests this is not a low-volume grind lower.
I tend to think this is close to a short-term sentiment bottom. That doesn't mean an immediate rebound, but chasing shorts has already become a poor risk-reward trade; instead, it may be worth watching for signs of stabilization.
$HEMI #资金费率极端 #28%跌幅
Click the small card below to quickly check the market 👇
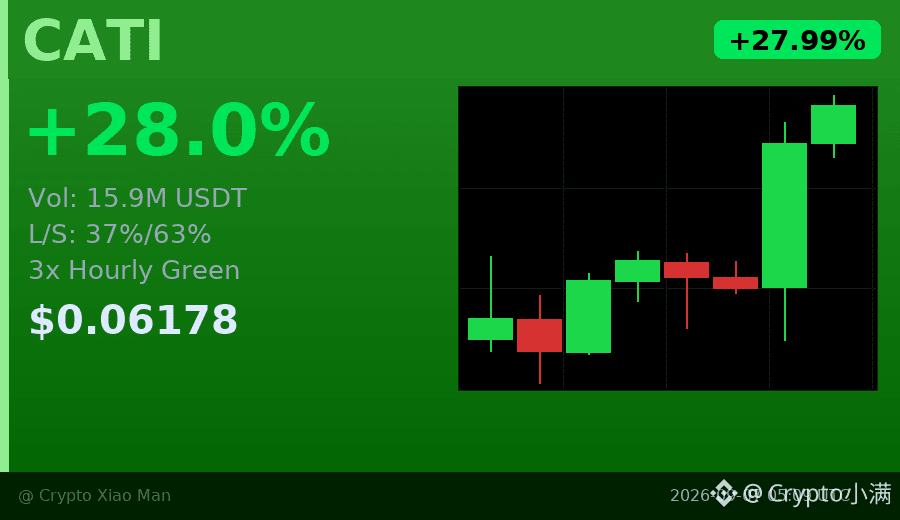
Up nearly 28% in 24 hours, but look at the trading volume—15.9 million USDT, far above normal.
More importantly, look at the long/short ratio: 63% of people are short, while the price has closed three consecutive hourly candles in the green. This divergence usually means shorts are being forced to cover.
The funding rate is only 0.005%, which means it’s not yet extremely crowded, but short-term momentum has already picked up.
It has rebounded from the low of 0.04787 to 0.06178 now, with the high at 0.06224 right ahead. Whether it can break through depends on the next hour.
$CATI #山寨异动 #28%
Click the small card below to quickly check the market👇
More importantly, look at the long/short ratio: 63% of people are short, while the price has closed three consecutive hourly candles in the green. This divergence usually means shorts are being forced to cover.
The funding rate is only 0.005%, which means it’s not yet extremely crowded, but short-term momentum has already picked up.
It has rebounded from the low of 0.04787 to 0.06178 now, with the high at 0.06224 right ahead. Whether it can break through depends on the next hour.
$CATI #山寨异动 #28%
Click the small card below to quickly check the market👇


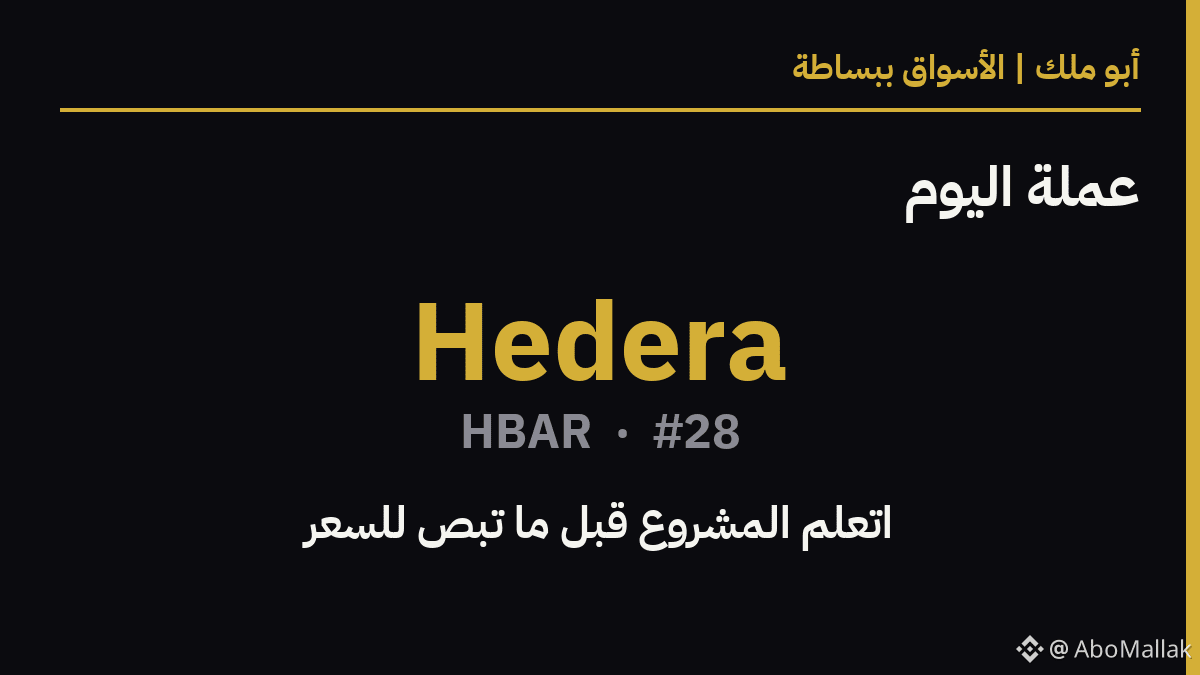
🎓 One coin every day — understand the market, don’t just buy blindly
Today: Hedera ($HBAR ) — market cap #28
🏗️ A network powered by Hashgraph technology, different from traditional blockchain — faster and more energy-efficient, with a governing council that includes global companies like Google, IBM, and Boeing.
💪 A governance council made up of giant companies — rare institutional credibility in the market.
⚠️ That same council also makes many people see it as more centralized than it should be.
📊 Price: $0.0812 · Market cap: $3.6 billion
7 days: +7.3% · 30 days: +18.6%
📈 Resistances: $0.0847 · $0.0867 | Supports: $0.0685 · $0.0653$
(Historical pause zones from 90-day candles — not targets or recommendations)
What’s the thing that caught your attention most about Hedera? Write your opinion 👇 $HBAR
💛 Join Abu Malak’s team: sign up on Binance with code ABOMALAK — permanent discount on trading fees and access to our services and offers
#28 #HBAR #Altcoins
⚠️ Educational content — not investment advice
Today: Hedera ($HBAR ) — market cap #28
🏗️ A network powered by Hashgraph technology, different from traditional blockchain — faster and more energy-efficient, with a governing council that includes global companies like Google, IBM, and Boeing.
💪 A governance council made up of giant companies — rare institutional credibility in the market.
⚠️ That same council also makes many people see it as more centralized than it should be.
📊 Price: $0.0812 · Market cap: $3.6 billion
7 days: +7.3% · 30 days: +18.6%
📈 Resistances: $0.0847 · $0.0867 | Supports: $0.0685 · $0.0653$
(Historical pause zones from 90-day candles — not targets or recommendations)
What’s the thing that caught your attention most about Hedera? Write your opinion 👇 $HBAR
💛 Join Abu Malak’s team: sign up on Binance with code ABOMALAK — permanent discount on trading fees and access to our services and offers
#28 #HBAR #Altcoins
⚠️ Educational content — not investment advice
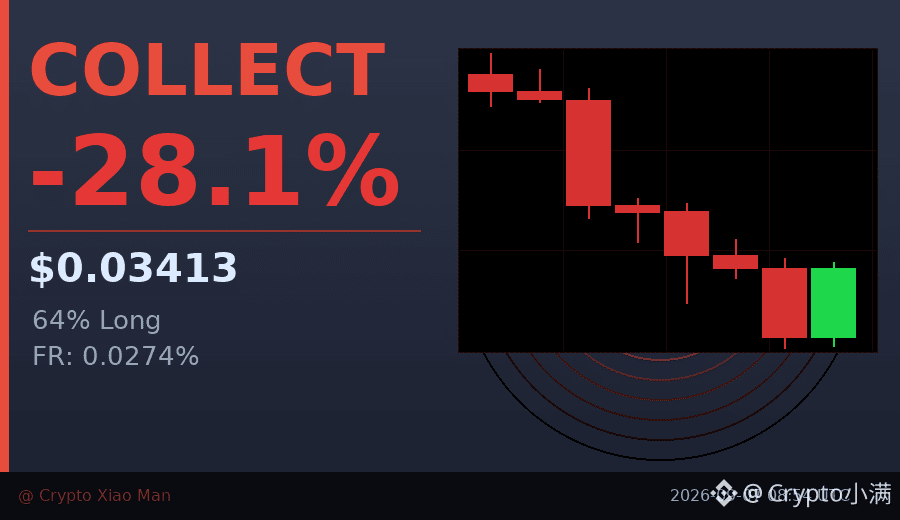
A 28% drop, yet volume surged to 38.8 million U. Something doesn’t add up.
COLLECT got hammered hard today, falling straight from 0.052 to 0.034. What’s interesting, though, is that the funding rate is still positive at 0.0274%, which means some traders are willing to pay interest to keep holding long positions.
Even stranger, 64% of traders are long and only 36% are short. Usually, such one-sided positioning is either crowded trading before a sharp drop, or someone quietly accumulating at the bottom.
Looking at the 8-hour candlestick chart, the overall trend is weakening, but the latest candle bounced back from 0.031 to 0.034, suggesting some tentative bottom-fishing by capital.
I wouldn’t rush in right now. For a move like this, either wait for a confirmed rebound or see whether it can hold steady around 0.03.
$COLLECT #山寨币异动 #28% drop
Click the small card below to quickly check the market👇
COLLECT got hammered hard today, falling straight from 0.052 to 0.034. What’s interesting, though, is that the funding rate is still positive at 0.0274%, which means some traders are willing to pay interest to keep holding long positions.
Even stranger, 64% of traders are long and only 36% are short. Usually, such one-sided positioning is either crowded trading before a sharp drop, or someone quietly accumulating at the bottom.
Looking at the 8-hour candlestick chart, the overall trend is weakening, but the latest candle bounced back from 0.031 to 0.034, suggesting some tentative bottom-fishing by capital.
I wouldn’t rush in right now. For a move like this, either wait for a confirmed rebound or see whether it can hold steady around 0.03.
$COLLECT #山寨币异动 #28% drop
Click the small card below to quickly check the market👇
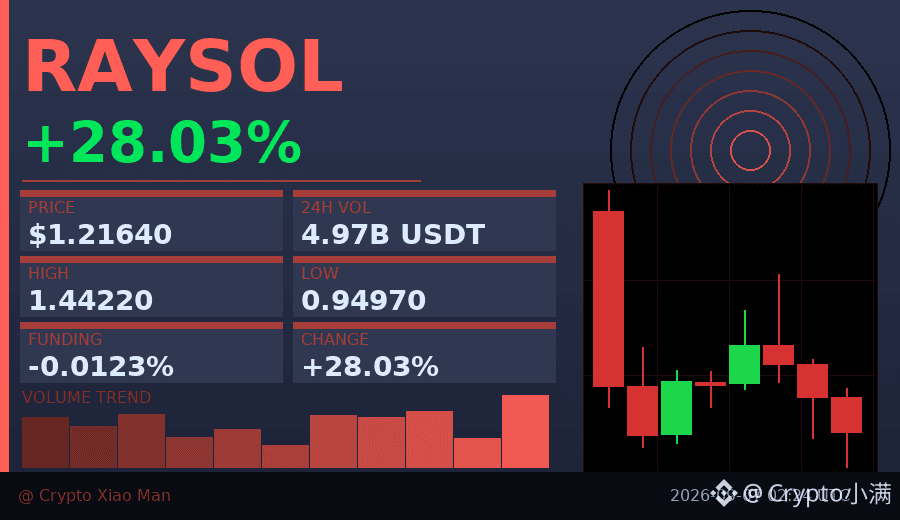
28% gain, but the funding rate is negative?
RAYSOL surged to 1.44 today before pulling back to 1.22, with trading volume approaching $500 million. Normally, such a sharp rally would come with a positive funding rate and crowded longs, but the current rate is -0.012%, and the long/short ratio is also nearly 50/50.
What does this mean? There aren’t many people chasing the move, while profit-taking is actually dominating. The hourly chart has posted consecutive bearish candles, and the short-term move is digesting the gains.
If you’re bullish on what comes next, waiting for signs of stabilization is safer than chasing now; if you want to short, the negative funding rate means you can still collect a subsidy, but be careful about the risk of another sharp pump.
$RAYSOL #资金费率背离 #28%
Click the small card below to quickly view the market 👇
RAYSOL surged to 1.44 today before pulling back to 1.22, with trading volume approaching $500 million. Normally, such a sharp rally would come with a positive funding rate and crowded longs, but the current rate is -0.012%, and the long/short ratio is also nearly 50/50.
What does this mean? There aren’t many people chasing the move, while profit-taking is actually dominating. The hourly chart has posted consecutive bearish candles, and the short-term move is digesting the gains.
If you’re bullish on what comes next, waiting for signs of stabilization is safer than chasing now; if you want to short, the negative funding rate means you can still collect a subsidy, but be careful about the risk of another sharp pump.
$RAYSOL #资金费率背离 #28%
Click the small card below to quickly view the market 👇
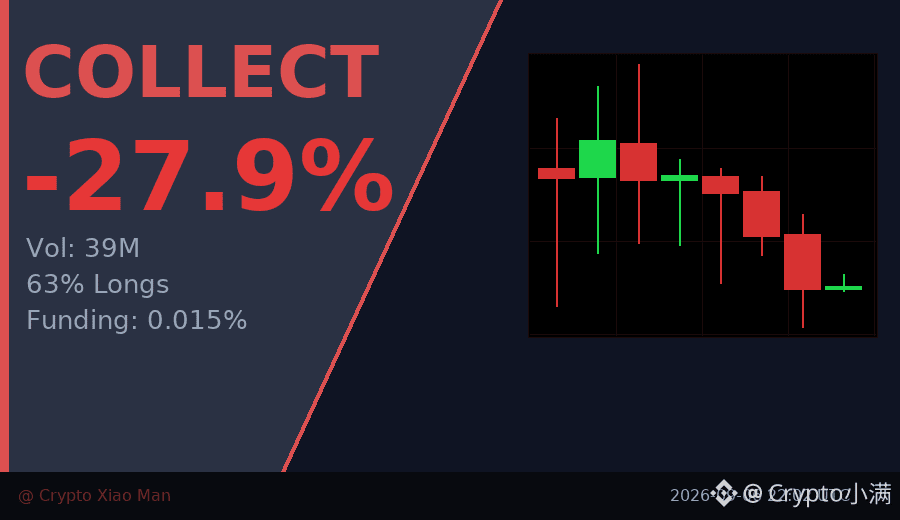
Down nearly 28% in 24 hours, yet longs still account for 63%—that kind of crowding is dangerous.
COLLECT is now at $0.0405, and the 39M USDT trading volume is not low. The trend has been weakening over the past 8 hours, with the price sliding all the way down from the $0.064 high, showing that selling pressure is still present.
The funding rate of 0.015% is not high, but with longs this concentrated against the backdrop of a sharp drop, it can easily trigger a chain of stop-losses. I’ve encountered similar situations before, and it often only truly bottoms out after a round of forced liquidations.
In the short term, watch whether $0.04 can hold. If it breaks below that, the next stop may be around $0.035.
$COLLECT #多杀多风险 #28% decline
Click the small card below to quickly view the market👇
COLLECT is now at $0.0405, and the 39M USDT trading volume is not low. The trend has been weakening over the past 8 hours, with the price sliding all the way down from the $0.064 high, showing that selling pressure is still present.
The funding rate of 0.015% is not high, but with longs this concentrated against the backdrop of a sharp drop, it can easily trigger a chain of stop-losses. I’ve encountered similar situations before, and it often only truly bottoms out after a round of forced liquidations.
In the short term, watch whether $0.04 can hold. If it breaks below that, the next stop may be around $0.035.
$COLLECT #多杀多风险 #28% decline
Click the small card below to quickly view the market👇
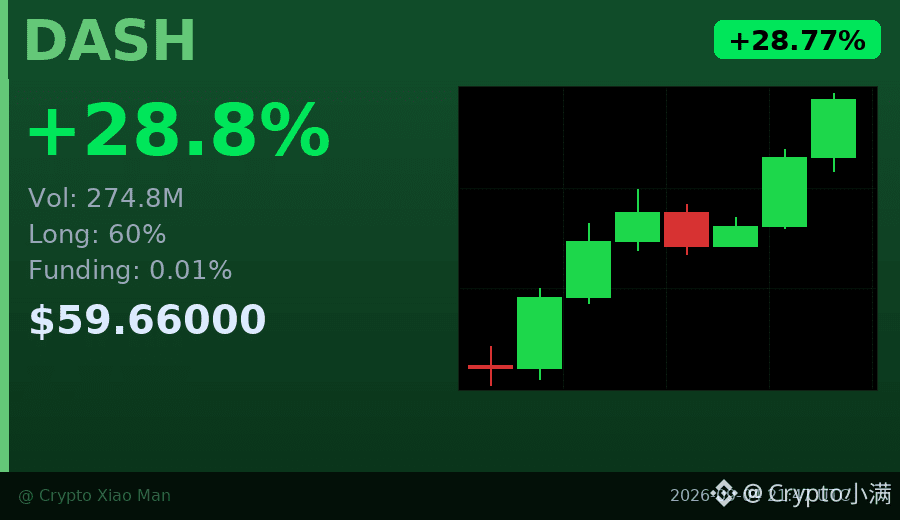
28% gain, but the funding rate is only 0.01%—what does that mean?
DASH moved from 45.77 all the way to 59.66 today, with trading volume of $275 million.
The hourly candles have closed green in a row, and buying pressure is very steady.
The key point is: longs make up only 60%, and the funding rate is nearly zero.
This kind of rally has not yet reached the "crowded" stage; it is not being driven by FOMO.
If volume holds up, there is still room to the upside;
but if volume suddenly surges and the move accelerates, be careful of short-term profit-taking.
$DASH #老币新动 #28%
Click the small card below to quickly check the market👇
DASH moved from 45.77 all the way to 59.66 today, with trading volume of $275 million.
The hourly candles have closed green in a row, and buying pressure is very steady.
The key point is: longs make up only 60%, and the funding rate is nearly zero.
This kind of rally has not yet reached the "crowded" stage; it is not being driven by FOMO.
If volume holds up, there is still room to the upside;
but if volume suddenly surges and the move accelerates, be careful of short-term profit-taking.
$DASH #老币新动 #28%
Click the small card below to quickly check the market👇
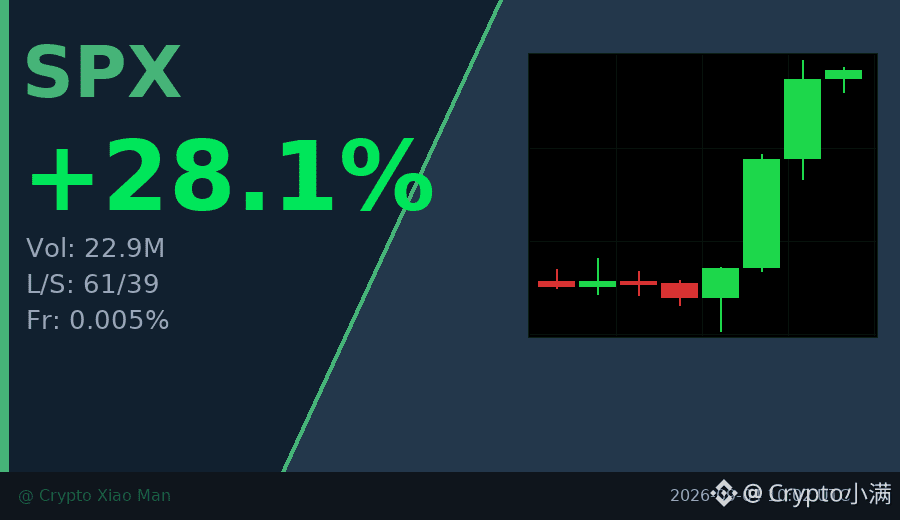
A 28% increase, but what’s truly worth noting is the trading volume—transactions of 22.90 million USDT far exceed the usual levels.
The hourly K-line has continued closing green; it has risen from 0.526 all the way to 0.677, and the bullish rhythm is very clear. The long/short ratio of 61%/39% suggests market sentiment leans bullish, though it isn’t at the point of extreme overcrowding yet.
The funding rate is only 0.005%, relatively low, which indicates that the potential upside may not have been overstretched or fully drained by excessive leverage.
This combination of rising volume and price with healthy funding rates is often more worthy of attention than a price surge alone.
$SPX #SPX #28%
Click the small card below to quickly view the market snapshot👇
The hourly K-line has continued closing green; it has risen from 0.526 all the way to 0.677, and the bullish rhythm is very clear. The long/short ratio of 61%/39% suggests market sentiment leans bullish, though it isn’t at the point of extreme overcrowding yet.
The funding rate is only 0.005%, relatively low, which indicates that the potential upside may not have been overstretched or fully drained by excessive leverage.
This combination of rising volume and price with healthy funding rates is often more worthy of attention than a price surge alone.
$SPX #SPX #28%
Click the small card below to quickly view the market snapshot👇
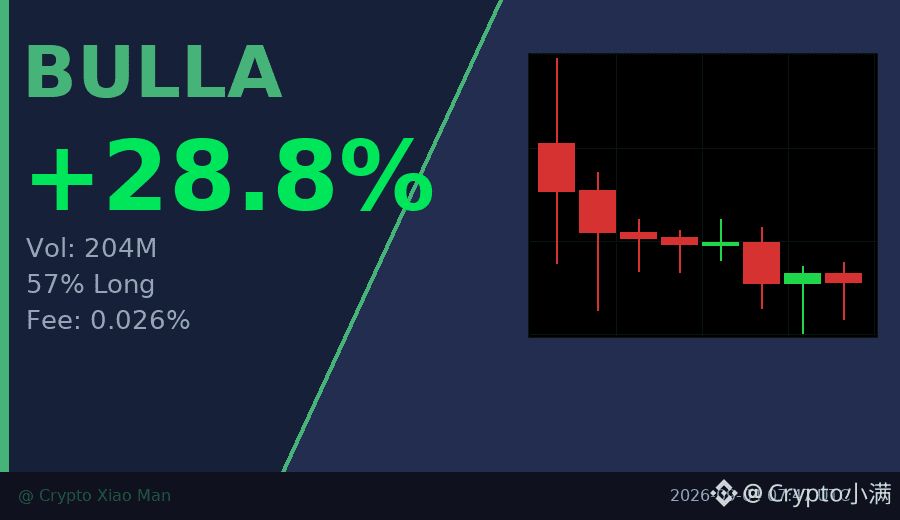
28% surge, but the funding rate is only 0.026%—this is rare among meme coins.
Today, BULLA’s trading volume is 204 million USDT. The long-to-short ratio is 57% long, suggesting most people are still on the sidelines.
Within 8 hours, the price dropped from 0.0356 to 0.031, but the 24-hour gain remains close to 30%. This kind of “pump first, then pull back” pattern usually means early profit-takers are exiting.
The key is whether the 0.03 level can be held. If it holds, it could be a healthy pullback; if it breaks, it may test the low at 0.024.
I noticed I’ve recently posted about TRIA, USELESS, and MAGMA. Today I’m looking at it from a different angle: don’t chase price—wait until the direction is clear.
$BULLA #Meme观察 #28%涨幅
Click the small card below to quickly view the market👇
Today, BULLA’s trading volume is 204 million USDT. The long-to-short ratio is 57% long, suggesting most people are still on the sidelines.
Within 8 hours, the price dropped from 0.0356 to 0.031, but the 24-hour gain remains close to 30%. This kind of “pump first, then pull back” pattern usually means early profit-takers are exiting.
The key is whether the 0.03 level can be held. If it holds, it could be a healthy pullback; if it breaks, it may test the low at 0.024.
I noticed I’ve recently posted about TRIA, USELESS, and MAGMA. Today I’m looking at it from a different angle: don’t chase price—wait until the direction is clear.
$BULLA #Meme观察 #28%涨幅
Click the small card below to quickly view the market👇

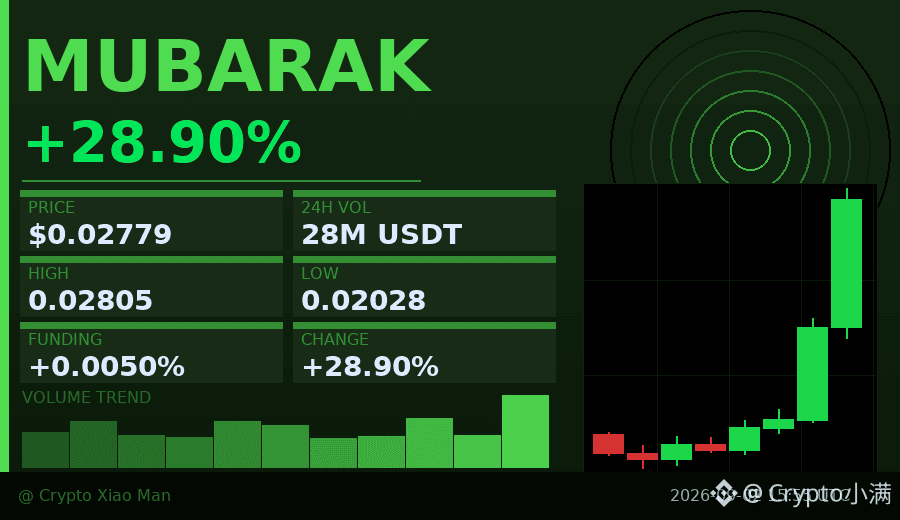
$MUBARAK This surge in volume is a bit scary—I’d like to talk about it.
In the past 24 hours, it’s risen by nearly 29%, but what I’m paying attention to isn’t the price itself—
it’s the trading volume on the last two candlesticks: the previous one suddenly expanded to 5 times its usual level,
followed immediately by the latest one, which exploded to a成交额 of nearly 600 million.
The price moved from today’s low of 0.020 to 0.028, a gain of nearly 40%,
and it’s the kind of structure that spikes upward in one go, with not much pullback.
What’s interesting is the long/short ratio: currently, 42% of people are betting on the upside, and 58% are betting on the downside.
That means this rally has been pushed up “with most shorts fighting against it.”
If the price doesn’t come back in the short term, those short positions will be forced to stop out,
and the stop-outs themselves will keep pushing the price higher—this chain reaction is called a “short squeeze.”
Right now, the funding rate is close to zero, suggesting market sentiment isn’t extremely euphoric yet.
From that perspective, in the short term, it doesn’t look like we’ve reached the typical “danger of chasing longs” signal.
I’ll focus on whether the price can hold around 0.0265.
If the 58% who are short start to concede one after another, there may still be some room for the move;
but if volume starts to dry up and the price chops in a range at high levels, be careful.
$MUBARAK #空头挤压 #28.9% surge
Click the small card below to quickly check the行情👇
In the past 24 hours, it’s risen by nearly 29%, but what I’m paying attention to isn’t the price itself—
it’s the trading volume on the last two candlesticks: the previous one suddenly expanded to 5 times its usual level,
followed immediately by the latest one, which exploded to a成交额 of nearly 600 million.
The price moved from today’s low of 0.020 to 0.028, a gain of nearly 40%,
and it’s the kind of structure that spikes upward in one go, with not much pullback.
What’s interesting is the long/short ratio: currently, 42% of people are betting on the upside, and 58% are betting on the downside.
That means this rally has been pushed up “with most shorts fighting against it.”
If the price doesn’t come back in the short term, those short positions will be forced to stop out,
and the stop-outs themselves will keep pushing the price higher—this chain reaction is called a “short squeeze.”
Right now, the funding rate is close to zero, suggesting market sentiment isn’t extremely euphoric yet.
From that perspective, in the short term, it doesn’t look like we’ve reached the typical “danger of chasing longs” signal.
I’ll focus on whether the price can hold around 0.0265.
If the 58% who are short start to concede one after another, there may still be some room for the move;
but if volume starts to dry up and the price chops in a range at high levels, be careful.
$MUBARAK #空头挤压 #28.9% surge
Click the small card below to quickly check the行情👇

$DASH This 15-minute breakout with increased volume has something to it—up about 2%, and the trading volume has jumped to more than triple the usual level.💥
The key is that the funding rate is in the recent high percentile, and the OI has been showing abnormal persistence across multiple consecutive periods. This is clearly not a one-time pulse; it looks like new leveraged long positions are being steadily added. Nominal changes ranked across the whole pool at #28, abnormal percentile at 95.2%—basically among the very top names in the entire market that are worth watching.
Price has just broken above the highs of the last ~20 5-minute candlesticks. The aggressive buy/sell ratio is 1.46, with a positive difference of 18.6%. The bid side was actively hammered in—not passively filled from resting orders. Structurally it’s relatively strong, but in terms of timing, it’s still near its own historical extreme zone, where you’re prone to see a fast rise followed by a quick shakeout.
Don’t chase. If it pulls back without breaking, then we can talk. If you already have a position, just hold the support at the 15m upper boundary.📊
The key is that the funding rate is in the recent high percentile, and the OI has been showing abnormal persistence across multiple consecutive periods. This is clearly not a one-time pulse; it looks like new leveraged long positions are being steadily added. Nominal changes ranked across the whole pool at #28, abnormal percentile at 95.2%—basically among the very top names in the entire market that are worth watching.
Price has just broken above the highs of the last ~20 5-minute candlesticks. The aggressive buy/sell ratio is 1.46, with a positive difference of 18.6%. The bid side was actively hammered in—not passively filled from resting orders. Structurally it’s relatively strong, but in terms of timing, it’s still near its own historical extreme zone, where you’re prone to see a fast rise followed by a quick shakeout.
Don’t chase. If it pulls back without breaking, then we can talk. If you already have a position, just hold the support at the 15m upper boundary.📊
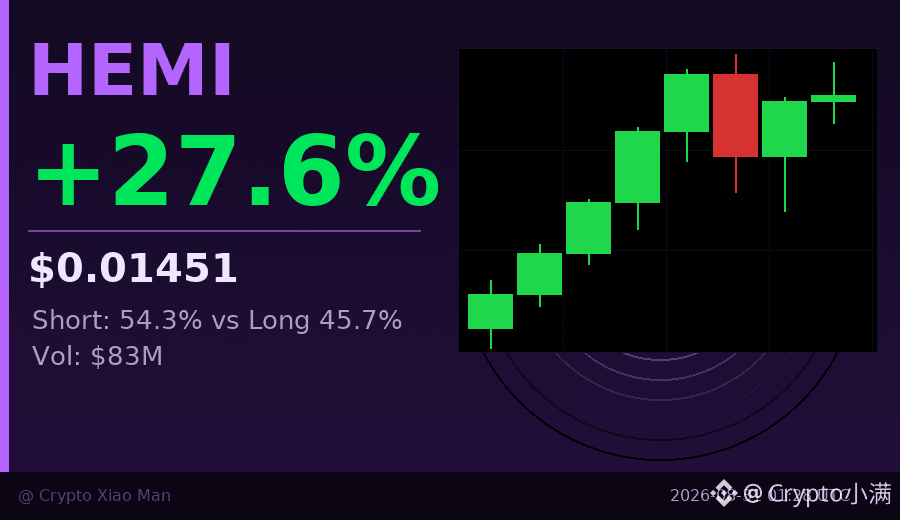
It’s up 28%, but the shorts are actually higher—this is rather unusual.
Today, HEMI’s intraday high touched 0.01493. From the low of 0.0102, that’s a gain of nearly 46%. In the past 24 hours, trading volume exceeded $83 million, and the volume was very high.
But the short position ratio is 54%, while longs are only 45.7%—not something you commonly see in a blow-off rally. Usually when a coin jumps this hard, shorts would have already been squeezed out. What should remain is long dominance—yet it’s the opposite now.
So what does it indicate? Perhaps some people feel this rally is moving too fast and opened shorts at high levels betting on a pullback. It’s also possible that arbitrage positions are hedging. In recent hours, several consecutive hourly candlesticks have closed bullish, but the previous one showed a very long upper wick—peaking at 0.01493 before dropping back. That suggests there is real sell pressure at that level.
The funding rate is 0.000157, which isn’t high. That means the cost paid by longs to shorts is relatively low, so shorts don’t have to feel too uncomfortable. They can likely continue propping this up for a while.
In this situation, focus on two things: If the price keeps pushing higher and breaks above today’s high, shorts will be forced to cover, potentially triggering a cascading squeeze upward. If it drops below 0.013 on lower volume, then those shorts win.
Trading volume is the key—whether it’s there or not makes the chart tell a completely different story.
$HEMI #空头不信涨 #28% unusually many longs and shorts
Click the small card below to quickly check the market👇
Today, HEMI’s intraday high touched 0.01493. From the low of 0.0102, that’s a gain of nearly 46%. In the past 24 hours, trading volume exceeded $83 million, and the volume was very high.
But the short position ratio is 54%, while longs are only 45.7%—not something you commonly see in a blow-off rally. Usually when a coin jumps this hard, shorts would have already been squeezed out. What should remain is long dominance—yet it’s the opposite now.
So what does it indicate? Perhaps some people feel this rally is moving too fast and opened shorts at high levels betting on a pullback. It’s also possible that arbitrage positions are hedging. In recent hours, several consecutive hourly candlesticks have closed bullish, but the previous one showed a very long upper wick—peaking at 0.01493 before dropping back. That suggests there is real sell pressure at that level.
The funding rate is 0.000157, which isn’t high. That means the cost paid by longs to shorts is relatively low, so shorts don’t have to feel too uncomfortable. They can likely continue propping this up for a while.
In this situation, focus on two things: If the price keeps pushing higher and breaks above today’s high, shorts will be forced to cover, potentially triggering a cascading squeeze upward. If it drops below 0.013 on lower volume, then those shorts win.
Trading volume is the key—whether it’s there or not makes the chart tell a completely different story.
$HEMI #空头不信涨 #28% unusually many longs and shorts
Click the small card below to quickly check the market👇

After showering at night, my hair wasn’t fully dry yet, so I leaned on the couch and scrolled through Binance’s TradFi sector. The name $NBIS popped up in the front again.
Honestly, it hasn’t been that dramatic today. Its current price is $209.93, up only +0.31% over the past 24 hours. The high and low have just been drifting between $211.39 and $208.24.
But for some reason, I end up paying more attention to setups like this.
Real strength doesn’t necessarily give you a big green candle every day. A lot of the time, the buzz comes back first, the price moves sideways, and then the market gradually exchanges hands until the chips get rotated.
I’m bullish on $NBIS —not because of this single candlestick, but because it can keep ranking #23 on the US stock perpetuals gains leaderboard and #28 on the trading volume leaderboard.
This kind of position tells you one thing: more people are willing to hold it for trading.
In the last 24 hours, the trading volume reached $2.78M USDT. It’s not a huge spike, but it also isn’t a neglected corner no one touches.
For someone like me who has traded futures for years and now cares more about timing, attention comes first, and only then do you get room for ongoing discussion and pricing.
There’s another detail I care about.
Its funding rate is +0.0000%, with an open interest of 100,680 contracts.
That feels like neither side is fully out of their minds—someone inside the venue is watching, but it hasn’t gotten so one-sided that everyone piles in.
I personally prefer this kind of state.
If the funding rate were already ridiculously high, I’d actually feel uncomfortable—because then you risk stepping in and catching the most crowded, emotion-heavy baton.
Let me say it more plainly.
I’m bullish on a setup like this. The core isn’t how much it’s up today, but whether it’s sitting in a position where capital can repeatedly bring it into trading.
As long as it keeps reappearing on the board, it means the market isn’t treating it like a one-off hot trend.
On the US stock side right now, many problems with various tickers aren’t that there’s no story—it's that there’s no trading-side follow-through. The excitement lasts a couple days and then disappears.
With $NBIS , at least I can see that both the buzz and the open positions are still there.
Of course, this isn’t a “close your eyes and hold” kind of trade.
It’s actually been relatively tight on volatility today, which suggests the bulls haven’t yet reached the point of directly pushing.
If later the trading volume drops quickly and the price can’t hold the consolidation range from these past days, that awkward situation—“people are watching, but nobody’s taking”—will show up.
I’ll put it on my continued tracking list. I’ll lean bullish, but I won’t chase the emotion.
If it were me, I’d rather wait until it keeps having volume and discussion later, then decide how to size the position.
The biggest fear with this kind of ticker isn’t that it moves slowly—it’s misjudging “people are starting to look” as “it’s about to fly immediately.”
Those are my thoughts. Your money is your call. $NBIS #USStocks
Honestly, it hasn’t been that dramatic today. Its current price is $209.93, up only +0.31% over the past 24 hours. The high and low have just been drifting between $211.39 and $208.24.
But for some reason, I end up paying more attention to setups like this.
Real strength doesn’t necessarily give you a big green candle every day. A lot of the time, the buzz comes back first, the price moves sideways, and then the market gradually exchanges hands until the chips get rotated.
I’m bullish on $NBIS —not because of this single candlestick, but because it can keep ranking #23 on the US stock perpetuals gains leaderboard and #28 on the trading volume leaderboard.
This kind of position tells you one thing: more people are willing to hold it for trading.
In the last 24 hours, the trading volume reached $2.78M USDT. It’s not a huge spike, but it also isn’t a neglected corner no one touches.
For someone like me who has traded futures for years and now cares more about timing, attention comes first, and only then do you get room for ongoing discussion and pricing.
There’s another detail I care about.
Its funding rate is +0.0000%, with an open interest of 100,680 contracts.
That feels like neither side is fully out of their minds—someone inside the venue is watching, but it hasn’t gotten so one-sided that everyone piles in.
I personally prefer this kind of state.
If the funding rate were already ridiculously high, I’d actually feel uncomfortable—because then you risk stepping in and catching the most crowded, emotion-heavy baton.
Let me say it more plainly.
I’m bullish on a setup like this. The core isn’t how much it’s up today, but whether it’s sitting in a position where capital can repeatedly bring it into trading.
As long as it keeps reappearing on the board, it means the market isn’t treating it like a one-off hot trend.
On the US stock side right now, many problems with various tickers aren’t that there’s no story—it's that there’s no trading-side follow-through. The excitement lasts a couple days and then disappears.
With $NBIS , at least I can see that both the buzz and the open positions are still there.
Of course, this isn’t a “close your eyes and hold” kind of trade.
It’s actually been relatively tight on volatility today, which suggests the bulls haven’t yet reached the point of directly pushing.
If later the trading volume drops quickly and the price can’t hold the consolidation range from these past days, that awkward situation—“people are watching, but nobody’s taking”—will show up.
I’ll put it on my continued tracking list. I’ll lean bullish, but I won’t chase the emotion.
If it were me, I’d rather wait until it keeps having volume and discussion later, then decide how to size the position.
The biggest fear with this kind of ticker isn’t that it moves slowly—it’s misjudging “people are starting to look” as “it’s about to fly immediately.”
Those are my thoughts. Your money is your call. $NBIS #USStocks


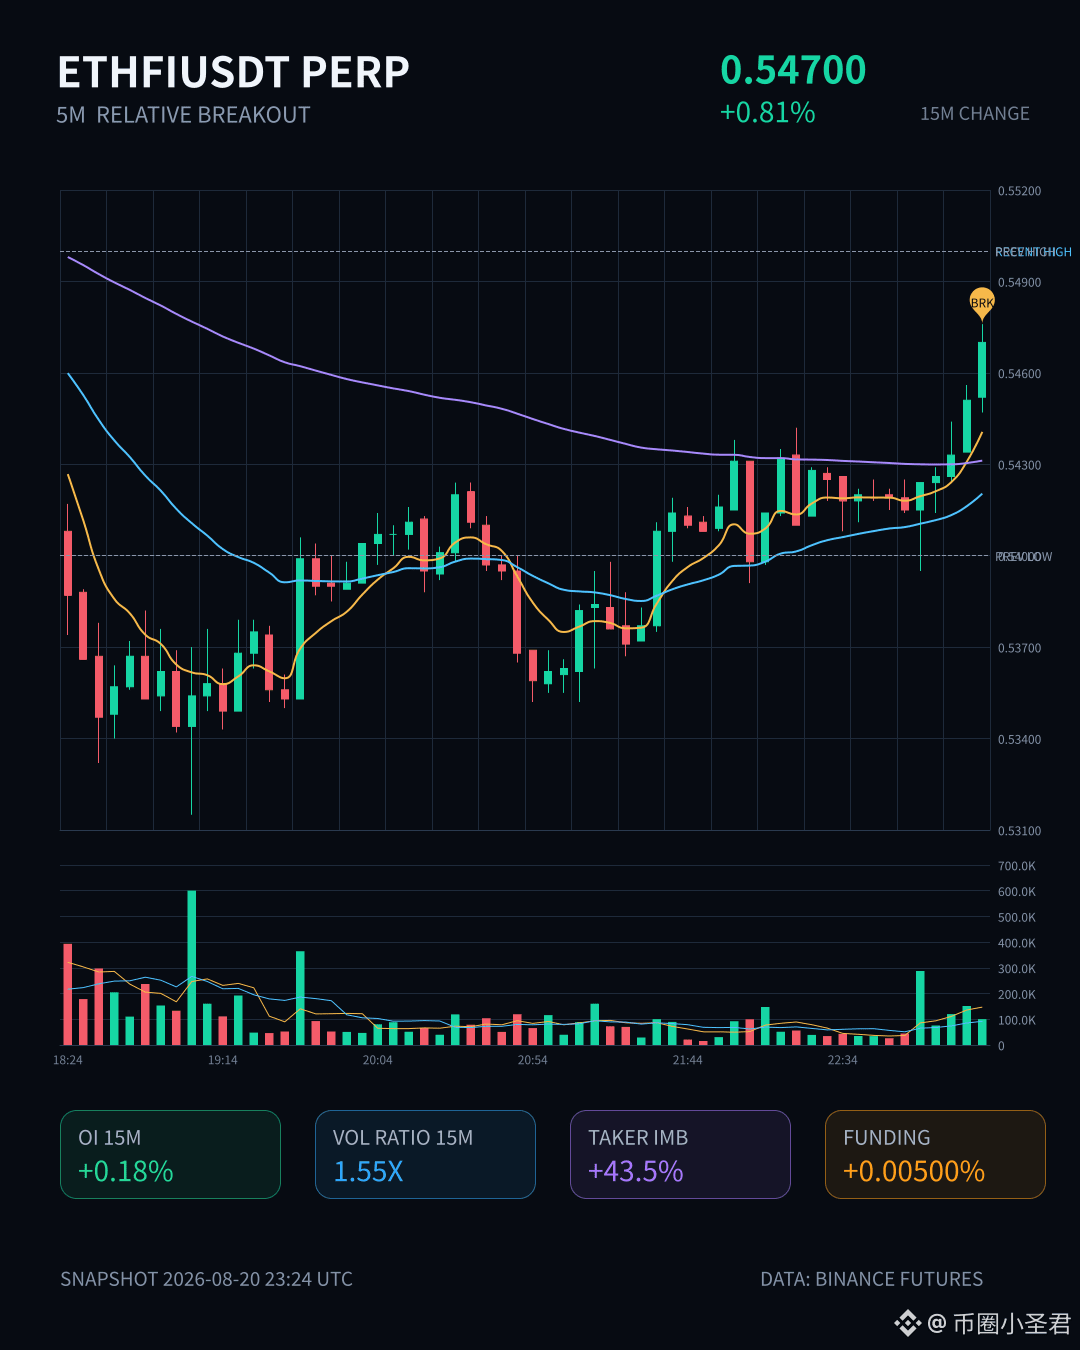
ETHFI has moved in an interesting way.
On the 15-minute timeframe, it directly broke through the upper limit of the range formed by nearly 20 consecutive 5-minute K-lines. Trading volume expanded to 1.55x, and the volatility Z-value reached 2.32—indicating this isn’t a slow, grind-it-out fake breakout, but a real move with volume.
Even more importantly, OI and price are rising in sync. Open interest has increased by 241K USDT in contract notional, and the aggressive buy side has a clear advantage (buy/sell ratio 2.54). This structure—volume expansion + position increase + clear main order aggressive buying—looks more like new incremental capital is coming in to go long, rather than just short covering.
The funding rate is also currently in the higher percentile range recently. Market sentiment is quite hot, and the pool-wide anomalies ranking is relatively high—#17 for nominal change and #28. Although the 1-hour OI has ticked down slightly, it doesn’t matter much. The main story on the 15-minute chart is still that the bulls are in control.
That said, honestly, this kind of short-term breakout structure can surge fast and also pull back easily. The key is whether it can hold the breakout level—don’t chase at the very top. $ETHFI
On the 15-minute timeframe, it directly broke through the upper limit of the range formed by nearly 20 consecutive 5-minute K-lines. Trading volume expanded to 1.55x, and the volatility Z-value reached 2.32—indicating this isn’t a slow, grind-it-out fake breakout, but a real move with volume.
Even more importantly, OI and price are rising in sync. Open interest has increased by 241K USDT in contract notional, and the aggressive buy side has a clear advantage (buy/sell ratio 2.54). This structure—volume expansion + position increase + clear main order aggressive buying—looks more like new incremental capital is coming in to go long, rather than just short covering.
The funding rate is also currently in the higher percentile range recently. Market sentiment is quite hot, and the pool-wide anomalies ranking is relatively high—#17 for nominal change and #28. Although the 1-hour OI has ticked down slightly, it doesn’t matter much. The main story on the 15-minute chart is still that the bulls are in control.
That said, honestly, this kind of short-term breakout structure can surge fast and also pull back easily. The key is whether it can hold the breakout level—don’t chase at the very top. $ETHFI
This energy theme has, in the past few years, been more popular with investors who talk about the generation side and the computing/power-demand side, while the middle layer—“stable energy supply” infrastructure—often gets underestimated. I understand Bloom Energy is broadly headed in this direction: not by grabbing attention with concepts, but by being a bottleneck that helps meet the need for a more flexible, more distributed power system. As long as scenarios like AI computing power, data centers, and industrial parks keep expanding, how stable the power supply is and how fast the dispatch can respond will become increasingly important.
I’m bullish on $BE , not treating it as a pure-play energy stock, but placing it within the trading framework of a “new round of power infrastructure upgrades.” This space has a particular characteristic: the story isn’t as exciting as pure themes, but once the market starts to revalue it, the sustainability is often better than that of pure momentum-driven narratives. Traditional grid expansion moves slowly, while incremental load can arrive quickly. Companies that can fill this gap have valuation upside that comes not only from the business cycle, but also from whether the market is willing to view it as a higher-tier infrastructure asset.
The order book is also starting to price in this expectation. $BE today is ranked #14 on Binance’s US stock perpetuals gainers list, and #28 on the volume list. The 24h volume is $11.41M USDT—not exactly obscure. The perpetual last price is $243.09, with an intraday range from $232.53 to $244.0, which suggests money is chasing, but not running out of control with an acceleration. Funding rate is +0.0701%, open interest is 41,030 contracts. Bulls are pushing, but the funding is already a bit overheated, so I won’t chase by opening a large position at higher prices.
My plan is: if it can stay steady near the upper end of today’s range, I’ll first open a 3% trial position, betting on the thesis of the sector revaluation—not chasing one single candlestick. If it can’t hold and falls back to the middle of the range and I can’t catch it there, then I won’t do it and will wait for the next turnover. The variables here are also clear: for any stock carrying this kind of “energy upgrade” narrative, as soon as the market style shifts back to pure defense, or if the capital’s realization speed doesn’t keep up, the drawdown will be very direct.
I’m adding this one in at a light weight to my watchlist and trading list for now. Not because it’s up today, but because its position is starting to be repriced by more capital.
$BE #美股
This post is just my own thoughts, not investment advice.
I’m bullish on $BE , not treating it as a pure-play energy stock, but placing it within the trading framework of a “new round of power infrastructure upgrades.” This space has a particular characteristic: the story isn’t as exciting as pure themes, but once the market starts to revalue it, the sustainability is often better than that of pure momentum-driven narratives. Traditional grid expansion moves slowly, while incremental load can arrive quickly. Companies that can fill this gap have valuation upside that comes not only from the business cycle, but also from whether the market is willing to view it as a higher-tier infrastructure asset.
The order book is also starting to price in this expectation. $BE today is ranked #14 on Binance’s US stock perpetuals gainers list, and #28 on the volume list. The 24h volume is $11.41M USDT—not exactly obscure. The perpetual last price is $243.09, with an intraday range from $232.53 to $244.0, which suggests money is chasing, but not running out of control with an acceleration. Funding rate is +0.0701%, open interest is 41,030 contracts. Bulls are pushing, but the funding is already a bit overheated, so I won’t chase by opening a large position at higher prices.
My plan is: if it can stay steady near the upper end of today’s range, I’ll first open a 3% trial position, betting on the thesis of the sector revaluation—not chasing one single candlestick. If it can’t hold and falls back to the middle of the range and I can’t catch it there, then I won’t do it and will wait for the next turnover. The variables here are also clear: for any stock carrying this kind of “energy upgrade” narrative, as soon as the market style shifts back to pure defense, or if the capital’s realization speed doesn’t keep up, the drawdown will be very direct.
I’m adding this one in at a light weight to my watchlist and trading list for now. Not because it’s up today, but because its position is starting to be repriced by more capital.
$BE #美股
This post is just my own thoughts, not investment advice.
For this kind of ticket like $MSFT , I’m actually willing to hold and look at it a bit more.
It’s not the kind of ticket that makes people get all hyped the moment they see it. In the past 24 hours it only moved +0.25%. The current price is $497.81, and the high-low range is basically just between $498.41 and $495.8.
But I actually like this kind of feel.
After doing contracts for years, it has a way of making people behave. A lot of tickets rally hard—looks exciting, but once you’re holding it, your heart hurts.
With companies like $MSFT , in my understanding, what’s impressive isn’t how many points it jumps in a single day—it’s that the lane it’s in is too solid.
Whether it’s office software, enterprise services, or the AI direction everyone is watching now, it doesn’t count as a fringe role.
These kinds of companies have one advantage: when market sentiment is hot, it can take in the imagination. When the market is colder, it’s still not like nobody’s looking at it right away.
There’s another detail I care about.
On Binance, in the US stock perpetuals growth leaderboard it’s at #14, and in the volume leaderboard it’s at #28. In the last 24 hours, trading volume is $2.36M USDT.
You say these numbers aren’t that exaggerated—I agree.
But for a ticket of the size of $MSFT , it shows there are people inside the market continuously paying attention. It’s not just there as decoration.
The funding rate is still +0.0000%, and the open interest is 54,474 lots. This feels more like everyone is holding their position at this level, watching to see who makes the first move, not like the places where the emotions have already burned out.
Personally, I’m more bullish. And there’s another very practical reason.
Even if I misread a company like this, my mindset will be steadier than if I go chase those theme-driven tickets.
If you tell me to pull out my phone on the subway and place a trade, I’d rather watch $MSFT more—I don’t want to touch something where a single line can swallow your profit for the day.
That said, it’s not without variables.
Close to a round number like $500, a lot of people naturally hesitate. And the order book has been fairly flat these past couple of days—if you really want it to immediately print a big bullish candle, it might not happen right away.
If the overall market sentiment weakens, these big-name tickets will still get pushed down together.
But if it were my choice, I’d still lean more bullish on this side.
If I’m going to do it, I’d rather wait for it to grind out within this narrow range first, then slowly watch—rather than move on just because it’s not exciting enough.
The market is changing. What’s true today might not be true tomorrow.
$MSFT #美股
It’s not the kind of ticket that makes people get all hyped the moment they see it. In the past 24 hours it only moved +0.25%. The current price is $497.81, and the high-low range is basically just between $498.41 and $495.8.
But I actually like this kind of feel.
After doing contracts for years, it has a way of making people behave. A lot of tickets rally hard—looks exciting, but once you’re holding it, your heart hurts.
With companies like $MSFT , in my understanding, what’s impressive isn’t how many points it jumps in a single day—it’s that the lane it’s in is too solid.
Whether it’s office software, enterprise services, or the AI direction everyone is watching now, it doesn’t count as a fringe role.
These kinds of companies have one advantage: when market sentiment is hot, it can take in the imagination. When the market is colder, it’s still not like nobody’s looking at it right away.
There’s another detail I care about.
On Binance, in the US stock perpetuals growth leaderboard it’s at #14, and in the volume leaderboard it’s at #28. In the last 24 hours, trading volume is $2.36M USDT.
You say these numbers aren’t that exaggerated—I agree.
But for a ticket of the size of $MSFT , it shows there are people inside the market continuously paying attention. It’s not just there as decoration.
The funding rate is still +0.0000%, and the open interest is 54,474 lots. This feels more like everyone is holding their position at this level, watching to see who makes the first move, not like the places where the emotions have already burned out.
Personally, I’m more bullish. And there’s another very practical reason.
Even if I misread a company like this, my mindset will be steadier than if I go chase those theme-driven tickets.
If you tell me to pull out my phone on the subway and place a trade, I’d rather watch $MSFT more—I don’t want to touch something where a single line can swallow your profit for the day.
That said, it’s not without variables.
Close to a round number like $500, a lot of people naturally hesitate. And the order book has been fairly flat these past couple of days—if you really want it to immediately print a big bullish candle, it might not happen right away.
If the overall market sentiment weakens, these big-name tickets will still get pushed down together.
But if it were my choice, I’d still lean more bullish on this side.
If I’m going to do it, I’d rather wait for it to grind out within this narrow range first, then slowly watch—rather than move on just because it’s not exciting enough.
The market is changing. What’s true today might not be true tomorrow.
$MSFT #美股
Log in to explore more content