
#13
13
61,633 views
236 Discussing
Hot
Latest

·
--
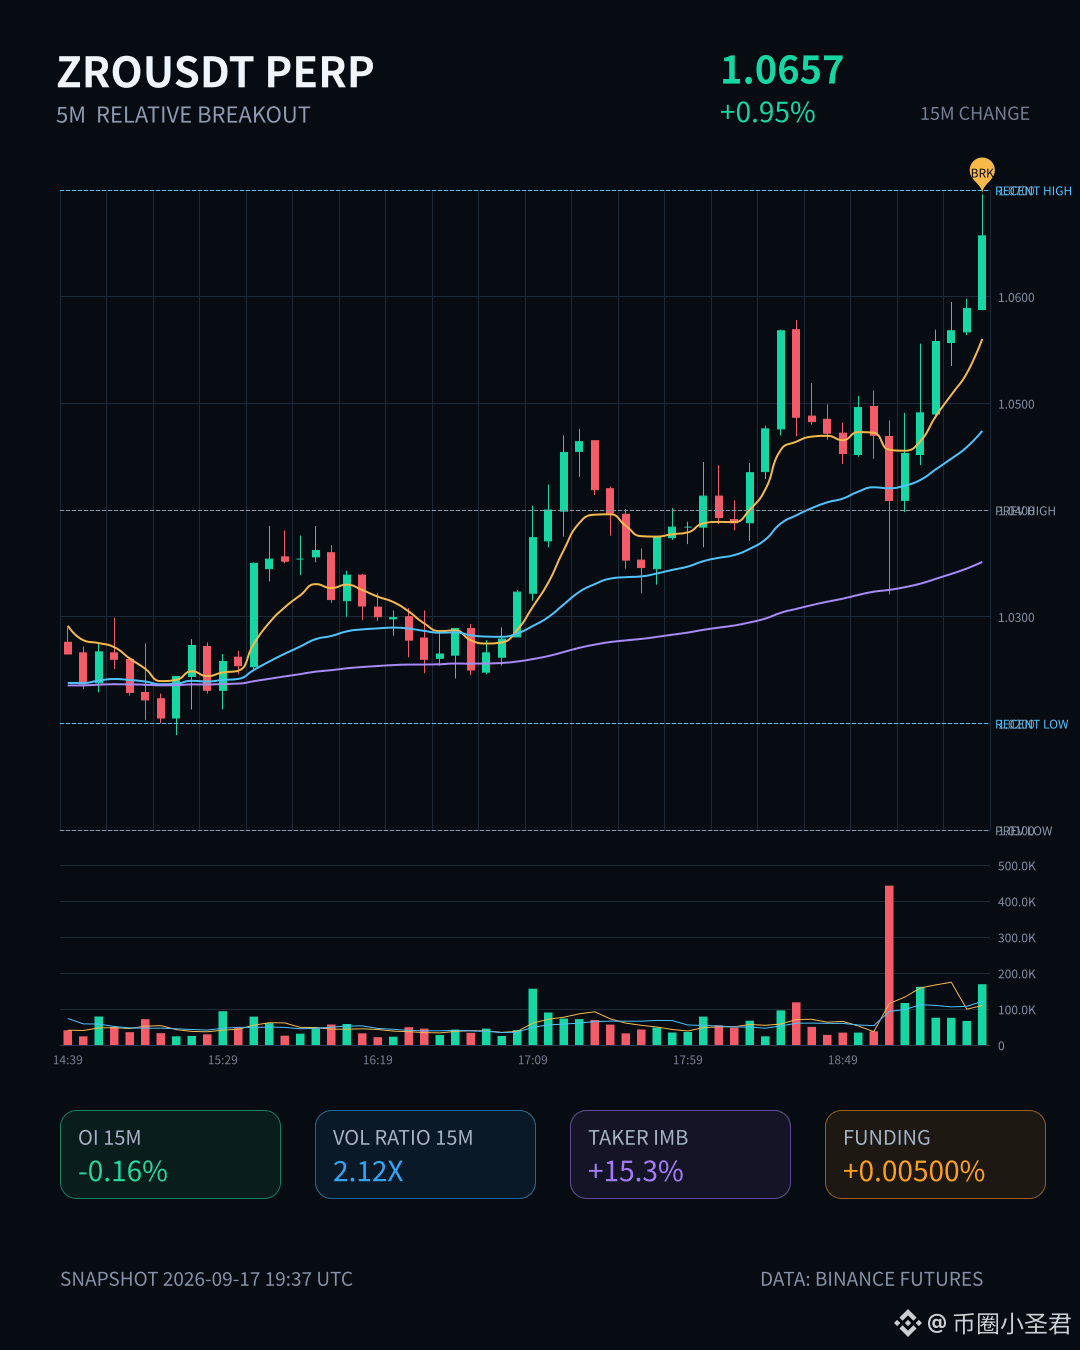
$ZRO This spot is a bit interesting.
Over 15m, it rose 0.95%, and the volume shot directly to 2.12x. The closing price broke above the upper edge of roughly the last 20 five-minute candles. The ratio of aggressive buying to selling is 1.36, and the bulls are fairly resolute.
But the suspicious part is the OI: in both the 15m and 1h periods, it’s net position reduction. Yet as the price went up, the positions actually fell. That structure basically indicates short-covering dominance—not fresh long positions pushing the move. The shorts are forced to close, so the price is pulled up passively, which reduces the “quality” of the rally.
The funding rate has already been pushed to the higher percentiles in the recent period. On the bulls’ side, it’s actually a bit crowded. The abnormal percentile is 87.7%, ranking #13 across the whole pool. Liquidity confirmation is sufficient, but the constituents aren’t very clean.
My take: the short-term momentum is real. However, for a market driven mainly by short-covering, once the shorts finish covering, if the follow-through from the relay orders can’t keep up, it’s easy for the move to leak. Don’t chase—wait for a pullback and see whether it can hold and stabilize above the upper edge of the range.
$ZRO This spot is a bit interesting.
Over 15m, it rose 0.95%, and the volume shot directly to 2.12x. The closing price broke above the upper edge of roughly the last 20 five-minute candles. The ratio of aggressive buying to selling is 1.36, and the bulls are fairly resolute.
But the suspicious part is the OI: in both the 15m and 1h periods, it’s net position reduction. Yet as the price went up, the positions actually fell. That structure basically indicates short-covering dominance—not fresh long positions pushing the move. The shorts are forced to close, so the price is pulled up passively, which reduces the “quality” of the rally.
The funding rate has already been pushed to the higher percentiles in the recent period. On the bulls’ side, it’s actually a bit crowded. The abnormal percentile is 87.7%, ranking #13 across the whole pool. Liquidity confirmation is sufficient, but the constituents aren’t very clean.
My take: the short-term momentum is real. However, for a market driven mainly by short-covering, once the shorts finish covering, if the follow-through from the relay orders can’t keep up, it’s easy for the move to leak. Don’t chase—wait for a pullback and see whether it can hold and stabilize above the upper edge of the range.
Over 15m, it rose 0.95%, and the volume shot directly to 2.12x. The closing price broke above the upper edge of roughly the last 20 five-minute candles. The ratio of aggressive buying to selling is 1.36, and the bulls are fairly resolute.
But the suspicious part is the OI: in both the 15m and 1h periods, it’s net position reduction. Yet as the price went up, the positions actually fell. That structure basically indicates short-covering dominance—not fresh long positions pushing the move. The shorts are forced to close, so the price is pulled up passively, which reduces the “quality” of the rally.
The funding rate has already been pushed to the higher percentiles in the recent period. On the bulls’ side, it’s actually a bit crowded. The abnormal percentile is 87.7%, ranking #13 across the whole pool. Liquidity confirmation is sufficient, but the constituents aren’t very clean.
My take: the short-term momentum is real. However, for a market driven mainly by short-covering, once the shorts finish covering, if the follow-through from the relay orders can’t keep up, it’s easy for the move to leak. Don’t chase—wait for a pullback and see whether it can hold and stabilize above the upper edge of the range.
8

·
--
$SOLV This move is a bit interesting. The price is down 2.67%, yet the OI is actually rising. The 15m abnormal percentile shot straight to 94.2%, and the whole pool ranks at #13. Active volume flow is -39.8%, the buy/sell ratio is 0.43—clearly, shorts are adding leverage and pushing in.
The funding rate is also in a high percentile recently. Coupled with the price breaking below the recent 20 5m lower bounds, it feels like an organized short is probing. Volume is 4.48x, and the volatility Z is 4.27. This volume–price combination doesn’t really look like retail just casually dumping.
However, the nominal OI change is actually negative: -135K, which suggests overall positions are being reduced. But the abnormal percentile is still this high—there’s a strong contradiction. Either old shorts are closing and new shorts are entering, or someone is setting up limit orders at key levels to lure trades.
In the last 24h, the traded value is only 14.34M, and the pool isn’t that deep. In situations like this, if the direction is wrong, liquidation cascades can happen very quickly. Let’s observe whether this 15m candle can hold after closing—don’t rush to catch it.
$SOLV This move is a bit interesting. The price is down 2.67%, yet the OI is actually rising. The 15m abnormal percentile shot straight to 94.2%, and the whole pool ranks at #13. Active volume flow is -39.8%, the buy/sell ratio is 0.43—clearly, shorts are adding leverage and pushing in.
The funding rate is also in a high percentile recently. Coupled with the price breaking below the recent 20 5m lower bounds, it feels like an organized short is probing. Volume is 4.48x, and the volatility Z is 4.27. This volume–price combination doesn’t really look like retail just casually dumping.
However, the nominal OI change is actually negative: -135K, which suggests overall positions are being reduced. But the abnormal percentile is still this high—there’s a strong contradiction. Either old shorts are closing and new shorts are entering, or someone is setting up limit orders at key levels to lure trades.
In the last 24h, the traded value is only 14.34M, and the pool isn’t that deep. In situations like this, if the direction is wrong, liquidation cascades can happen very quickly. Let’s observe whether this 15m candle can hold after closing—don’t rush to catch it.
The funding rate is also in a high percentile recently. Coupled with the price breaking below the recent 20 5m lower bounds, it feels like an organized short is probing. Volume is 4.48x, and the volatility Z is 4.27. This volume–price combination doesn’t really look like retail just casually dumping.
However, the nominal OI change is actually negative: -135K, which suggests overall positions are being reduced. But the abnormal percentile is still this high—there’s a strong contradiction. Either old shorts are closing and new shorts are entering, or someone is setting up limit orders at key levels to lure trades.
In the last 24h, the traded value is only 14.34M, and the pool isn’t that deep. In situations like this, if the direction is wrong, liquidation cascades can happen very quickly. Let’s observe whether this 15m candle can hold after closing—don’t rush to catch it.
28

·
--
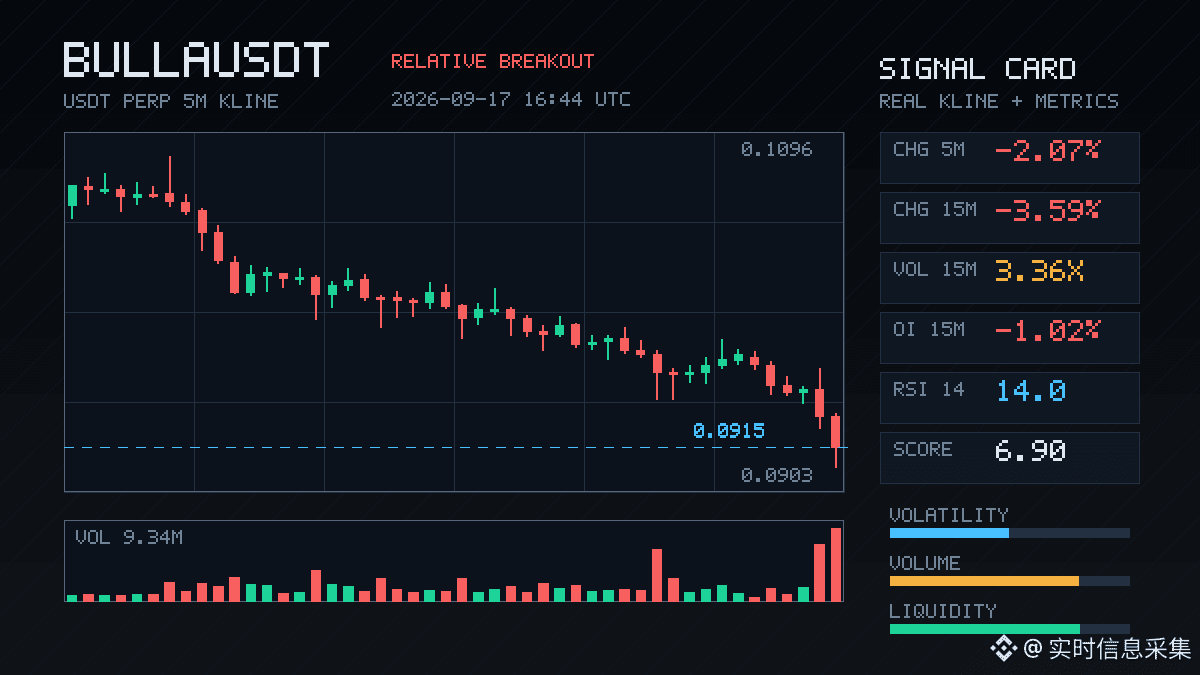
$BULLA That one was a bit brutal.
In 15m, it directly smashed down 3.59%. Volume surged to 3.36x the moving average. The close fell below the lower bound of the last 20 consecutive 5m candles.
Active trades are down by -7.1%, buy-sell ratio is 0.87, and sell pressure is pushing out—solidly, without any softness.
But what’s interesting is the OI: 15m -1.02%, 1h -1.80%. The notional change dropped by nearly 1 million U within an hour. Price is down, and positions are shrinking too. This doesn’t look like fresh shorts entering to press; it looks more like longs are stopping out on their own or being de-leveraged. You could call it liquidation from panic closing, too.
In the past 24h, turnover is still 231M—momentum hasn’t completely faded. OI’s abnormal percentile is 77.2%, and the notional change ranks #13 in the whole pool. When contraction happens at this kind of level, you usually have to watch out for two possibilities: either it’s a shake-out after the first wave of selling, or it’s the beginning of de-leveraging on a larger timeframe.
When it breaks below the lower end of the range, first see whether it can quickly reclaim it. If it can’t be reclaimed, don’t rush to reach in.
$BULLA That one was a bit brutal.
In 15m, it directly smashed down 3.59%. Volume surged to 3.36x the moving average. The close fell below the lower bound of the last 20 consecutive 5m candles.
Active trades are down by -7.1%, buy-sell ratio is 0.87, and sell pressure is pushing out—solidly, without any softness.
But what’s interesting is the OI: 15m -1.02%, 1h -1.80%. The notional change dropped by nearly 1 million U within an hour. Price is down, and positions are shrinking too. This doesn’t look like fresh shorts entering to press; it looks more like longs are stopping out on their own or being de-leveraged. You could call it liquidation from panic closing, too.
In the past 24h, turnover is still 231M—momentum hasn’t completely faded. OI’s abnormal percentile is 77.2%, and the notional change ranks #13 in the whole pool. When contraction happens at this kind of level, you usually have to watch out for two possibilities: either it’s a shake-out after the first wave of selling, or it’s the beginning of de-leveraging on a larger timeframe.
When it breaks below the lower end of the range, first see whether it can quickly reclaim it. If it can’t be reclaimed, don’t rush to reach in.
In 15m, it directly smashed down 3.59%. Volume surged to 3.36x the moving average. The close fell below the lower bound of the last 20 consecutive 5m candles.
Active trades are down by -7.1%, buy-sell ratio is 0.87, and sell pressure is pushing out—solidly, without any softness.
But what’s interesting is the OI: 15m -1.02%, 1h -1.80%. The notional change dropped by nearly 1 million U within an hour. Price is down, and positions are shrinking too. This doesn’t look like fresh shorts entering to press; it looks more like longs are stopping out on their own or being de-leveraged. You could call it liquidation from panic closing, too.
In the past 24h, turnover is still 231M—momentum hasn’t completely faded. OI’s abnormal percentile is 77.2%, and the notional change ranks #13 in the whole pool. When contraction happens at this kind of level, you usually have to watch out for two possibilities: either it’s a shake-out after the first wave of selling, or it’s the beginning of de-leveraging on a larger timeframe.
When it breaks below the lower end of the range, first see whether it can quickly reclaim it. If it can’t be reclaimed, don’t rush to reach in.
7

·
--
$UAI That drop was quite decisive; in 15m it directly fell 2.92%. Volume hit 1.82x, and the active trade imbalance was -30.9%, with the buy/sell ratio at 0.53—clearly someone is smashing it downward, not that slow, indecisive kind of drifting lower.
What’s interesting is that OI is also declining. On 15m it’s -0.45%, on 1h it’s -0.70%, with nominal change around -528K to -719K. Price is down while OI is down—this isn’t fresh short entries; it looks more like longs deleveraging, with stop-losses getting triggered and positions shrinking by choice. In plain terms, someone is admitting defeat and exiting.
The closing price has already broken below the lower edge of the last ~20 5m K-bars. The abnormal percentile for OI hit 93.8%, and the pool-wide abnormal rank is #6; nominal change rank is #13. These are continuation-style anomalies that rank near the top across the whole pool—not an isolated event. 24h turnover is 41.62M, and depth is sufficient too, which suggests this isn’t a fake move in a liquidity vacuum.
But on the flip side: when longs deleverage and sell off like this, it sometimes also means they’re clearing out floating risk. Still, there’s no clear stabilization signal yet—don’t rush to catch the dip.
$UAI That drop was quite decisive; in 15m it directly fell 2.92%. Volume hit 1.82x, and the active trade imbalance was -30.9%, with the buy/sell ratio at 0.53—clearly someone is smashing it downward, not that slow, indecisive kind of drifting lower.
What’s interesting is that OI is also declining. On 15m it’s -0.45%, on 1h it’s -0.70%, with nominal change around -528K to -719K. Price is down while OI is down—this isn’t fresh short entries; it looks more like longs deleveraging, with stop-losses getting triggered and positions shrinking by choice. In plain terms, someone is admitting defeat and exiting.
The closing price has already broken below the lower edge of the last ~20 5m K-bars. The abnormal percentile for OI hit 93.8%, and the pool-wide abnormal rank is #6; nominal change rank is #13. These are continuation-style anomalies that rank near the top across the whole pool—not an isolated event. 24h turnover is 41.62M, and depth is sufficient too, which suggests this isn’t a fake move in a liquidity vacuum.
But on the flip side: when longs deleverage and sell off like this, it sometimes also means they’re clearing out floating risk. Still, there’s no clear stabilization signal yet—don’t rush to catch the dip.
What’s interesting is that OI is also declining. On 15m it’s -0.45%, on 1h it’s -0.70%, with nominal change around -528K to -719K. Price is down while OI is down—this isn’t fresh short entries; it looks more like longs deleveraging, with stop-losses getting triggered and positions shrinking by choice. In plain terms, someone is admitting defeat and exiting.
The closing price has already broken below the lower edge of the last ~20 5m K-bars. The abnormal percentile for OI hit 93.8%, and the pool-wide abnormal rank is #6; nominal change rank is #13. These are continuation-style anomalies that rank near the top across the whole pool—not an isolated event. 24h turnover is 41.62M, and depth is sufficient too, which suggests this isn’t a fake move in a liquidity vacuum.
But on the flip side: when longs deleverage and sell off like this, it sometimes also means they’re clearing out floating risk. Still, there’s no clear stabilization signal yet—don’t rush to catch the dip.
2

·
--
$CRV This move is a bit interesting.
In 15m, it directly dropped 1.13%. Volume surged to 2.22x. The ratio of aggressive buy/sell is 0.56, and the selling pressure is real—not a fakeout. The price broke below the lower edge of the recent ~20 5m range, so the short-term structure has been broken.
But the key is OI—1h contracts are down 0.30%. A notional value of 510,000 U has been run off. In 15m it’s also shrinking. Price falling + OI dropping is not a new wave of shorts coming in to smash it; it looks more like longs deleveraging, with stop-losses being swept, and positions being reduced.
The OI anomaly percentile is 92.7%, ranking #13 in the whole pool, which suggests this action is quite noticeable within the pool—and it has continued across several consecutive cycles, not just one spike.
The question now is: has the deleveraging finished? If OI keeps falling and the price can’t stop, then there may be the next wave. If OI stabilizes and volume contracts, then it could be a shakeout around the short-term low.
No rush to enter—watch what expression this 15m candle closes with.
$CRV This move is a bit interesting.
In 15m, it directly dropped 1.13%. Volume surged to 2.22x. The ratio of aggressive buy/sell is 0.56, and the selling pressure is real—not a fakeout. The price broke below the lower edge of the recent ~20 5m range, so the short-term structure has been broken.
But the key is OI—1h contracts are down 0.30%. A notional value of 510,000 U has been run off. In 15m it’s also shrinking. Price falling + OI dropping is not a new wave of shorts coming in to smash it; it looks more like longs deleveraging, with stop-losses being swept, and positions being reduced.
The OI anomaly percentile is 92.7%, ranking #13 in the whole pool, which suggests this action is quite noticeable within the pool—and it has continued across several consecutive cycles, not just one spike.
The question now is: has the deleveraging finished? If OI keeps falling and the price can’t stop, then there may be the next wave. If OI stabilizes and volume contracts, then it could be a shakeout around the short-term low.
No rush to enter—watch what expression this 15m candle closes with.
In 15m, it directly dropped 1.13%. Volume surged to 2.22x. The ratio of aggressive buy/sell is 0.56, and the selling pressure is real—not a fakeout. The price broke below the lower edge of the recent ~20 5m range, so the short-term structure has been broken.
But the key is OI—1h contracts are down 0.30%. A notional value of 510,000 U has been run off. In 15m it’s also shrinking. Price falling + OI dropping is not a new wave of shorts coming in to smash it; it looks more like longs deleveraging, with stop-losses being swept, and positions being reduced.
The OI anomaly percentile is 92.7%, ranking #13 in the whole pool, which suggests this action is quite noticeable within the pool—and it has continued across several consecutive cycles, not just one spike.
The question now is: has the deleveraging finished? If OI keeps falling and the price can’t stop, then there may be the next wave. If OI stabilizes and volume contracts, then it could be a shakeout around the short-term low.
No rush to enter—watch what expression this 15m candle closes with.
7
·
--
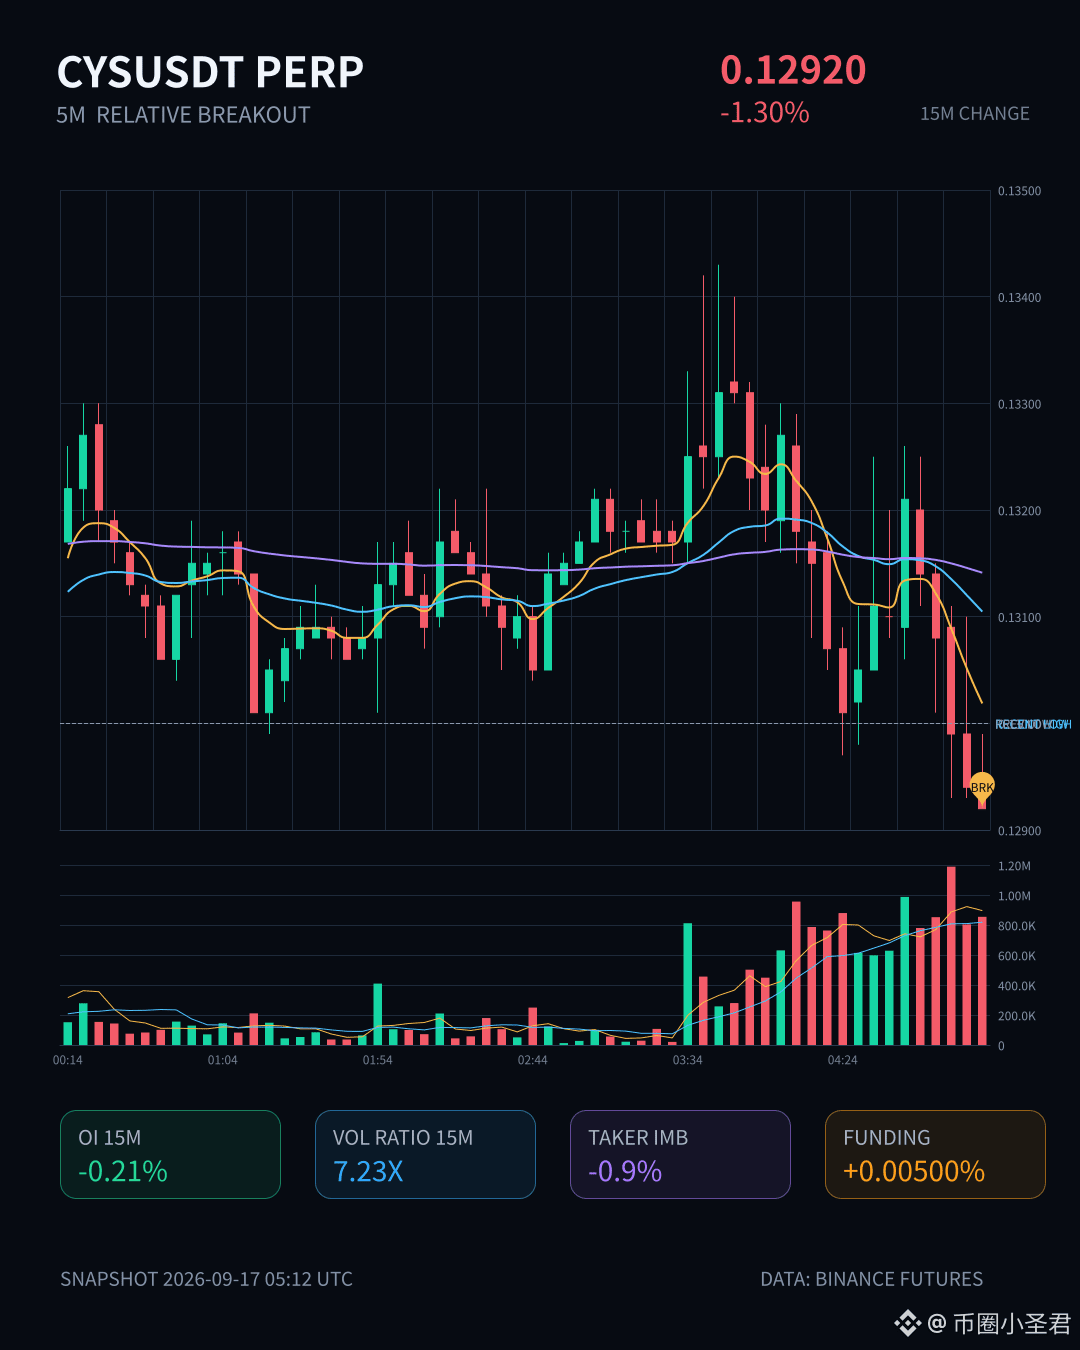
$CYS This dip isn’t that big—on the 15m chart it’s only -1.30%—but the volume surged straight to 7.23x, with a Z-score of 2.20. This is clearly not a normal turnover.
More importantly, OI is dropping: 15m -0.21%, 1h -1.83%. The notional has fallen by nearly 180k U. Price is going down while open interest is shrinking—this is typical long deleveraging / stop-loss, not shorts opening new positions to dump.
It also closed below the lower edge of the last ~20 of the 5m candles. Active volume difference is -0.9%, buy/sell ratio is 0.98. Sell pressure isn’t extremely high, but absorption is weak.
Abnormal percentile is 86.3%, ranking #13 in the whole pool. It has continued across several consecutive periods. In the last 24h, turnover is only 8.12M and the order book/liquidity isn’t thick. Don’t rush to bottom-fish—wait for OI to stabilize first.
$CYS This dip isn’t that big—on the 15m chart it’s only -1.30%—but the volume surged straight to 7.23x, with a Z-score of 2.20. This is clearly not a normal turnover.
More importantly, OI is dropping: 15m -0.21%, 1h -1.83%. The notional has fallen by nearly 180k U. Price is going down while open interest is shrinking—this is typical long deleveraging / stop-loss, not shorts opening new positions to dump.
It also closed below the lower edge of the last ~20 of the 5m candles. Active volume difference is -0.9%, buy/sell ratio is 0.98. Sell pressure isn’t extremely high, but absorption is weak.
Abnormal percentile is 86.3%, ranking #13 in the whole pool. It has continued across several consecutive periods. In the last 24h, turnover is only 8.12M and the order book/liquidity isn’t thick. Don’t rush to bottom-fish—wait for OI to stabilize first.
More importantly, OI is dropping: 15m -0.21%, 1h -1.83%. The notional has fallen by nearly 180k U. Price is going down while open interest is shrinking—this is typical long deleveraging / stop-loss, not shorts opening new positions to dump.
It also closed below the lower edge of the last ~20 of the 5m candles. Active volume difference is -0.9%, buy/sell ratio is 0.98. Sell pressure isn’t extremely high, but absorption is weak.
Abnormal percentile is 86.3%, ranking #13 in the whole pool. It has continued across several consecutive periods. In the last 24h, turnover is only 8.12M and the order book/liquidity isn’t thick. Don’t rush to bottom-fish—wait for OI to stabilize first.
4
·
--
$VVV this position is a bit interesting. On the 15m timeframe, price moved up 1.42%, volume immediately jumped to 1.91x, and the price broke above the upper edge of the recent 20 5m candles. Active buy pressure was +11.6%, with a buy/sell ratio of 1.26 — this is not the kind of fake spike or quick wick; there is real capital pushing it upward.
What is even more worth watching is the OI: 15m +0.08%, 1h +0.72%, and the combined notional change is over 1 million U. The abnormal percentile is 88.5%, ranking #13 in the whole pool. Price rising together with OI rising is the classic structure of new leveraged longs entering, not a rebound driven by short covering. And this has been extending across several consecutive periods; depth has confirmed it too, and volume is above normal.
24h turnover is 43M, which is not a large pool. Under this kind of size, if OI keeps expanding abnormally, either someone knows something in advance, or this is a coordinated accumulation phase. The upper boundary of the 20 5m range has just broken; whether it can hold is the key. If it cannot hold, it is just a false breakout and a round of liquidation; if it holds, the upside space opens up.
I’ll watch first and not chase it. I’ll wait for a pullback confirmation. What this kind of structure fears most is a big green candle followed by a direct fade back down. The higher the OI buildup, the harsher the flush when it comes.
$VVV this position is a bit interesting. On the 15m timeframe, price moved up 1.42%, volume immediately jumped to 1.91x, and the price broke above the upper edge of the recent 20 5m candles. Active buy pressure was +11.6%, with a buy/sell ratio of 1.26 — this is not the kind of fake spike or quick wick; there is real capital pushing it upward.
What is even more worth watching is the OI: 15m +0.08%, 1h +0.72%, and the combined notional change is over 1 million U. The abnormal percentile is 88.5%, ranking #13 in the whole pool. Price rising together with OI rising is the classic structure of new leveraged longs entering, not a rebound driven by short covering. And this has been extending across several consecutive periods; depth has confirmed it too, and volume is above normal.
24h turnover is 43M, which is not a large pool. Under this kind of size, if OI keeps expanding abnormally, either someone knows something in advance, or this is a coordinated accumulation phase. The upper boundary of the 20 5m range has just broken; whether it can hold is the key. If it cannot hold, it is just a false breakout and a round of liquidation; if it holds, the upside space opens up.
I’ll watch first and not chase it. I’ll wait for a pullback confirmation. What this kind of structure fears most is a big green candle followed by a direct fade back down. The higher the OI buildup, the harsher the flush when it comes.
What is even more worth watching is the OI: 15m +0.08%, 1h +0.72%, and the combined notional change is over 1 million U. The abnormal percentile is 88.5%, ranking #13 in the whole pool. Price rising together with OI rising is the classic structure of new leveraged longs entering, not a rebound driven by short covering. And this has been extending across several consecutive periods; depth has confirmed it too, and volume is above normal.
24h turnover is 43M, which is not a large pool. Under this kind of size, if OI keeps expanding abnormally, either someone knows something in advance, or this is a coordinated accumulation phase. The upper boundary of the 20 5m range has just broken; whether it can hold is the key. If it cannot hold, it is just a false breakout and a round of liquidation; if it holds, the upside space opens up.
I’ll watch first and not chase it. I’ll wait for a pullback confirmation. What this kind of structure fears most is a big green candle followed by a direct fade back down. The higher the OI buildup, the harsher the flush when it comes.
54
·
--
$ATOM This spot is a bit interesting.
15m just pulled back up to the upper bound of the recent range. Volume is nearly double the norm. OI is slightly rising on both the 1h and 15m—this isn’t the kind of fake push; it feels more like new long positions entered with leverage.
What really made me take a closer look is that the OI percentile hit 94.6% abnormally, with the entire pool ranking as #13. ATOM usually doesn’t move much; this kind of concentrated leverage isn’t that common for it. Above that would be its own historical extreme range.
For 19M, the 24h turnover isn’t extraordinary, but combined with this breakout structure—if volume can keep following through—I lean toward it attempting to test the previous high. If it can’t continue, then it’s likely a false move.
For now, I’ll log it and see whether it can hold the top of this range.
$ATOM This spot is a bit interesting.
15m just pulled back up to the upper bound of the recent range. Volume is nearly double the norm. OI is slightly rising on both the 1h and 15m—this isn’t the kind of fake push; it feels more like new long positions entered with leverage.
What really made me take a closer look is that the OI percentile hit 94.6% abnormally, with the entire pool ranking as #13. ATOM usually doesn’t move much; this kind of concentrated leverage isn’t that common for it. Above that would be its own historical extreme range.
For 19M, the 24h turnover isn’t extraordinary, but combined with this breakout structure—if volume can keep following through—I lean toward it attempting to test the previous high. If it can’t continue, then it’s likely a false move.
For now, I’ll log it and see whether it can hold the top of this range.
15m just pulled back up to the upper bound of the recent range. Volume is nearly double the norm. OI is slightly rising on both the 1h and 15m—this isn’t the kind of fake push; it feels more like new long positions entered with leverage.
What really made me take a closer look is that the OI percentile hit 94.6% abnormally, with the entire pool ranking as #13. ATOM usually doesn’t move much; this kind of concentrated leverage isn’t that common for it. Above that would be its own historical extreme range.
For 19M, the 24h turnover isn’t extraordinary, but combined with this breakout structure—if volume can keep following through—I lean toward it attempting to test the previous high. If it can’t continue, then it’s likely a false move.
For now, I’ll log it and see whether it can hold the top of this range.
69
·
--
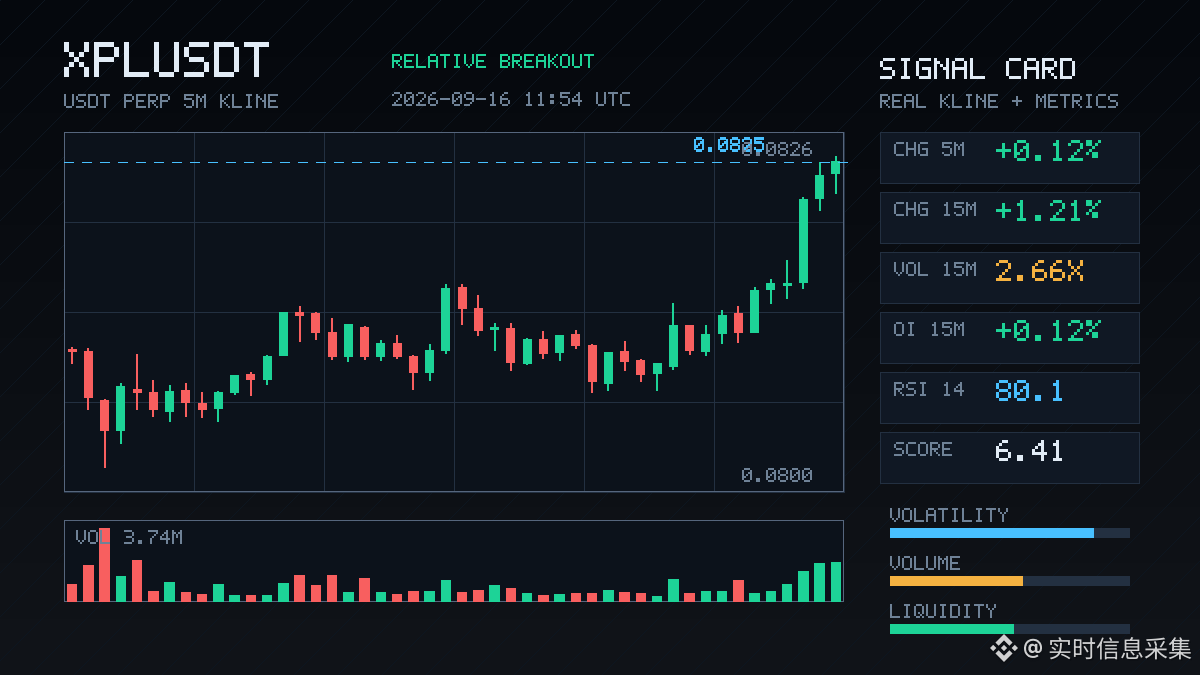
$XPL This move has something.
On the 15m chart, it directly pulled out a 2.66x volume surge. The Z value is 3.40, and the closing price actually stepped over the upper trendline of the recent 20 five-minute candles. This isn’t the kind of hard-pull that just spikes a single needle—active buy-side turnover is +20.5%, and the buy/sell ratio is 1.52, clearly showing someone is chasing it.
As for the OI—this is even more interesting. On the 15m: +0.12%; on the 1h (nominal): +2.17%; the abnormal percentile is 94.6%; and the full-pool ranking is #13. The price is rising while OI is moving up in sync—this is a typical leveraged long-entry structure, not a short-squeeze.
Multiple consecutive periods are continuing, with volume higher than normal, and it’s also hovering right against the historical extreme zone. Chasing at high levels is risky, but with confirmation to this extent, I’d first see whether the breakout can hold. If the pullback doesn’t break, it’s an opportunity to add.
The market doesn’t follow people; your position is up to you.
$XPL This move has something.
On the 15m chart, it directly pulled out a 2.66x volume surge. The Z value is 3.40, and the closing price actually stepped over the upper trendline of the recent 20 five-minute candles. This isn’t the kind of hard-pull that just spikes a single needle—active buy-side turnover is +20.5%, and the buy/sell ratio is 1.52, clearly showing someone is chasing it.
As for the OI—this is even more interesting. On the 15m: +0.12%; on the 1h (nominal): +2.17%; the abnormal percentile is 94.6%; and the full-pool ranking is #13. The price is rising while OI is moving up in sync—this is a typical leveraged long-entry structure, not a short-squeeze.
Multiple consecutive periods are continuing, with volume higher than normal, and it’s also hovering right against the historical extreme zone. Chasing at high levels is risky, but with confirmation to this extent, I’d first see whether the breakout can hold. If the pullback doesn’t break, it’s an opportunity to add.
The market doesn’t follow people; your position is up to you.
On the 15m chart, it directly pulled out a 2.66x volume surge. The Z value is 3.40, and the closing price actually stepped over the upper trendline of the recent 20 five-minute candles. This isn’t the kind of hard-pull that just spikes a single needle—active buy-side turnover is +20.5%, and the buy/sell ratio is 1.52, clearly showing someone is chasing it.
As for the OI—this is even more interesting. On the 15m: +0.12%; on the 1h (nominal): +2.17%; the abnormal percentile is 94.6%; and the full-pool ranking is #13. The price is rising while OI is moving up in sync—this is a typical leveraged long-entry structure, not a short-squeeze.
Multiple consecutive periods are continuing, with volume higher than normal, and it’s also hovering right against the historical extreme zone. Chasing at high levels is risky, but with confirmation to this extent, I’d first see whether the breakout can hold. If the pullback doesn’t break, it’s an opportunity to add.
The market doesn’t follow people; your position is up to you.
8
·
--
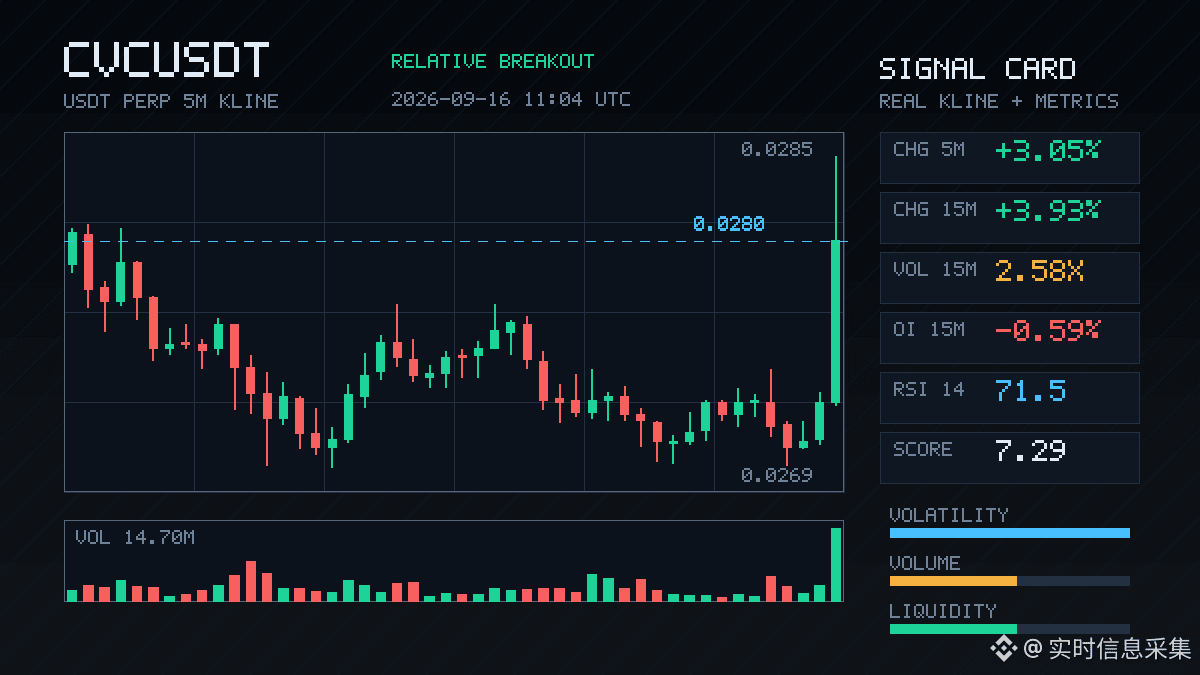
$CVC This 15m move was executed quite decisively—up +3.93%. The volume surged directly to 2.58 times; volatility was Z 4.66. The close even pushed through the upper bound of nearly 20 of the 5m candles. Active trading value was down 26.6%, with a buy/sell ratio of 1.73—clearly there’s money pushing upward.
But what’s interesting is the OI: 15m -0.59%, 1h -0.49%. Price is rising while open interest is falling—typical short-covering or positions being pushed through, not an all-in wave of new longs entering. The nominal change is only 101K and the scale isn’t huge, but the percentile is an unusual 89.5%; it ranks #13 across the whole pool, which means this structure stands out quite a lot among current pools.
In the last 24h, trading value was 37.94M, so there is depth. If this kind of rally doesn’t see OI follow through, it can easily turn into a one-off spike. But if the shorts keep getting squeezed, there may still be short-term momentum. Let’s watch first—don’t rush to chase.
$CVC This 15m move was executed quite decisively—up +3.93%. The volume surged directly to 2.58 times; volatility was Z 4.66. The close even pushed through the upper bound of nearly 20 of the 5m candles. Active trading value was down 26.6%, with a buy/sell ratio of 1.73—clearly there’s money pushing upward.
But what’s interesting is the OI: 15m -0.59%, 1h -0.49%. Price is rising while open interest is falling—typical short-covering or positions being pushed through, not an all-in wave of new longs entering. The nominal change is only 101K and the scale isn’t huge, but the percentile is an unusual 89.5%; it ranks #13 across the whole pool, which means this structure stands out quite a lot among current pools.
In the last 24h, trading value was 37.94M, so there is depth. If this kind of rally doesn’t see OI follow through, it can easily turn into a one-off spike. But if the shorts keep getting squeezed, there may still be short-term momentum. Let’s watch first—don’t rush to chase.
But what’s interesting is the OI: 15m -0.59%, 1h -0.49%. Price is rising while open interest is falling—typical short-covering or positions being pushed through, not an all-in wave of new longs entering. The nominal change is only 101K and the scale isn’t huge, but the percentile is an unusual 89.5%; it ranks #13 across the whole pool, which means this structure stands out quite a lot among current pools.
In the last 24h, trading value was 37.94M, so there is depth. If this kind of rally doesn’t see OI follow through, it can easily turn into a one-off spike. But if the shorts keep getting squeezed, there may still be short-term momentum. Let’s watch first—don’t rush to chase.
1
·
--
VVV This pullback came a bit suddenly.
On the 15m timeframe, it dropped directly by 1.83%. Volume surged to 2.08x, buy/sell ratio was 0.77, and aggressive order imbalance was -13%—sell pressure is clearly taking the lead.
What’s interesting, though, is the OI: on 15m, it’s -0.16%; on 1h, -0.15%. The notional changes are -463K and -657K USDT respectively. Price is falling while OI is also dropping—this combo is more indicative of long deleveraging or stop-outs rather than fresh short entries.
The OI anomaly percentile is 93.8%. The pool’s abnormal ranking puts it at #4, with notional change at #13. At this spot, the anomaly level is among the earlier ones in the whole pool, and the price just broke below the lower band of the last ~20 consecutive 5m K-bars, near its own historical extreme range.
In the past 24h, turnover was 41M—volume is there.
The question now is: has this deleveraging already finished? If OI keeps shrinking and price stops falling, it could mean positions have been cleared. But if OI rebounds while price continues to drop, that would be a real rotation/switch in positions. For now, keep watching.
VVV This pullback came a bit suddenly.
On the 15m timeframe, it dropped directly by 1.83%. Volume surged to 2.08x, buy/sell ratio was 0.77, and aggressive order imbalance was -13%—sell pressure is clearly taking the lead.
What’s interesting, though, is the OI: on 15m, it’s -0.16%; on 1h, -0.15%. The notional changes are -463K and -657K USDT respectively. Price is falling while OI is also dropping—this combo is more indicative of long deleveraging or stop-outs rather than fresh short entries.
The OI anomaly percentile is 93.8%. The pool’s abnormal ranking puts it at #4, with notional change at #13. At this spot, the anomaly level is among the earlier ones in the whole pool, and the price just broke below the lower band of the last ~20 consecutive 5m K-bars, near its own historical extreme range.
In the past 24h, turnover was 41M—volume is there.
The question now is: has this deleveraging already finished? If OI keeps shrinking and price stops falling, it could mean positions have been cleared. But if OI rebounds while price continues to drop, that would be a real rotation/switch in positions. For now, keep watching.
On the 15m timeframe, it dropped directly by 1.83%. Volume surged to 2.08x, buy/sell ratio was 0.77, and aggressive order imbalance was -13%—sell pressure is clearly taking the lead.
What’s interesting, though, is the OI: on 15m, it’s -0.16%; on 1h, -0.15%. The notional changes are -463K and -657K USDT respectively. Price is falling while OI is also dropping—this combo is more indicative of long deleveraging or stop-outs rather than fresh short entries.
The OI anomaly percentile is 93.8%. The pool’s abnormal ranking puts it at #4, with notional change at #13. At this spot, the anomaly level is among the earlier ones in the whole pool, and the price just broke below the lower band of the last ~20 consecutive 5m K-bars, near its own historical extreme range.
In the past 24h, turnover was 41M—volume is there.
The question now is: has this deleveraging already finished? If OI keeps shrinking and price stops falling, it could mean positions have been cleared. But if OI rebounds while price continues to drop, that would be a real rotation/switch in positions. For now, keep watching.
6
·
--
The long side got carried away with another batch. This 15m small bearish candle looks insignificant, but OI on 15m is -0.09%, 1h is -0.19%, and the notional value has decreased by 40 million dollars. This combination of price decline plus OI contraction is the classic deleveraging pattern—not new shorts smashing the market; it’s the insiders running first.
Aggressive trade volume underperformed by -13%, with the buy/sell ratio at 0.77. On 5m, Binance liquidation proxies of 237K are concentrated on the sell side, and the stop-loss chain got hit one after another. The OI abnormal percentile is 93.8%, the whole-pool anomaly is #13, notional change is #1, and depth confirmation is also bearish.
Trading volume is only 0.44x, volatility Z is 0.82. When liquidity is thin, dumping is the easiest. Emotion-driven selling targets longs—not a trend turning bearish. $BTC
The long side got carried away with another batch. This 15m small bearish candle looks insignificant, but OI on 15m is -0.09%, 1h is -0.19%, and the notional value has decreased by 40 million dollars. This combination of price decline plus OI contraction is the classic deleveraging pattern—not new shorts smashing the market; it’s the insiders running first.
Aggressive trade volume underperformed by -13%, with the buy/sell ratio at 0.77. On 5m, Binance liquidation proxies of 237K are concentrated on the sell side, and the stop-loss chain got hit one after another. The OI abnormal percentile is 93.8%, the whole-pool anomaly is #13, notional change is #1, and depth confirmation is also bearish.
Trading volume is only 0.44x, volatility Z is 0.82. When liquidity is thin, dumping is the easiest. Emotion-driven selling targets longs—not a trend turning bearish. $BTC
Aggressive trade volume underperformed by -13%, with the buy/sell ratio at 0.77. On 5m, Binance liquidation proxies of 237K are concentrated on the sell side, and the stop-loss chain got hit one after another. The OI abnormal percentile is 93.8%, the whole-pool anomaly is #13, notional change is #1, and depth confirmation is also bearish.
Trading volume is only 0.44x, volatility Z is 0.82. When liquidity is thin, dumping is the easiest. Emotion-driven selling targets longs—not a trend turning bearish. $BTC
7
·
--
$REZ This is a bit interesting.
In 15m, it only pulled less than 2 points, but the OI has been piling upward for several consecutive cycles. The 1h contract is +3.72%, and the notional increase is also over 270k U. Price is rising while open interest rises in sync—this looks like a typical leveraged long building positions, not just a simple short-covering pulse.
Volume expanded to 3x. The aggressive buy/sell ratio is 1.78, and the difference in aggressive trades is 28%, clearly leaning bullish. The abnormal percentile is 92.7%; in the whole pool it ranks #13 by order book, and the notional change ranks #23. It’s not the very top batch, but the strength comes from continuity and strong confirmation with depth.
In the last 24h, turnover is a little over 42M. The market’s not big; if OI continues making these consecutive moves, short-term volatility can easily be amplified. When longs add leverage, price often moves quite smoothly—but the issue is that once incremental buying stalls, reflexivity can hit just as fast.
First, watch whether OI keeps stacking. We’ll talk after it stops piling.
$REZ This is a bit interesting.
In 15m, it only pulled less than 2 points, but the OI has been piling upward for several consecutive cycles. The 1h contract is +3.72%, and the notional increase is also over 270k U. Price is rising while open interest rises in sync—this looks like a typical leveraged long building positions, not just a simple short-covering pulse.
Volume expanded to 3x. The aggressive buy/sell ratio is 1.78, and the difference in aggressive trades is 28%, clearly leaning bullish. The abnormal percentile is 92.7%; in the whole pool it ranks #13 by order book, and the notional change ranks #23. It’s not the very top batch, but the strength comes from continuity and strong confirmation with depth.
In the last 24h, turnover is a little over 42M. The market’s not big; if OI continues making these consecutive moves, short-term volatility can easily be amplified. When longs add leverage, price often moves quite smoothly—but the issue is that once incremental buying stalls, reflexivity can hit just as fast.
First, watch whether OI keeps stacking. We’ll talk after it stops piling.
In 15m, it only pulled less than 2 points, but the OI has been piling upward for several consecutive cycles. The 1h contract is +3.72%, and the notional increase is also over 270k U. Price is rising while open interest rises in sync—this looks like a typical leveraged long building positions, not just a simple short-covering pulse.
Volume expanded to 3x. The aggressive buy/sell ratio is 1.78, and the difference in aggressive trades is 28%, clearly leaning bullish. The abnormal percentile is 92.7%; in the whole pool it ranks #13 by order book, and the notional change ranks #23. It’s not the very top batch, but the strength comes from continuity and strong confirmation with depth.
In the last 24h, turnover is a little over 42M. The market’s not big; if OI continues making these consecutive moves, short-term volatility can easily be amplified. When longs add leverage, price often moves quite smoothly—but the issue is that once incremental buying stalls, reflexivity can hit just as fast.
First, watch whether OI keeps stacking. We’ll talk after it stops piling.
4
·
--
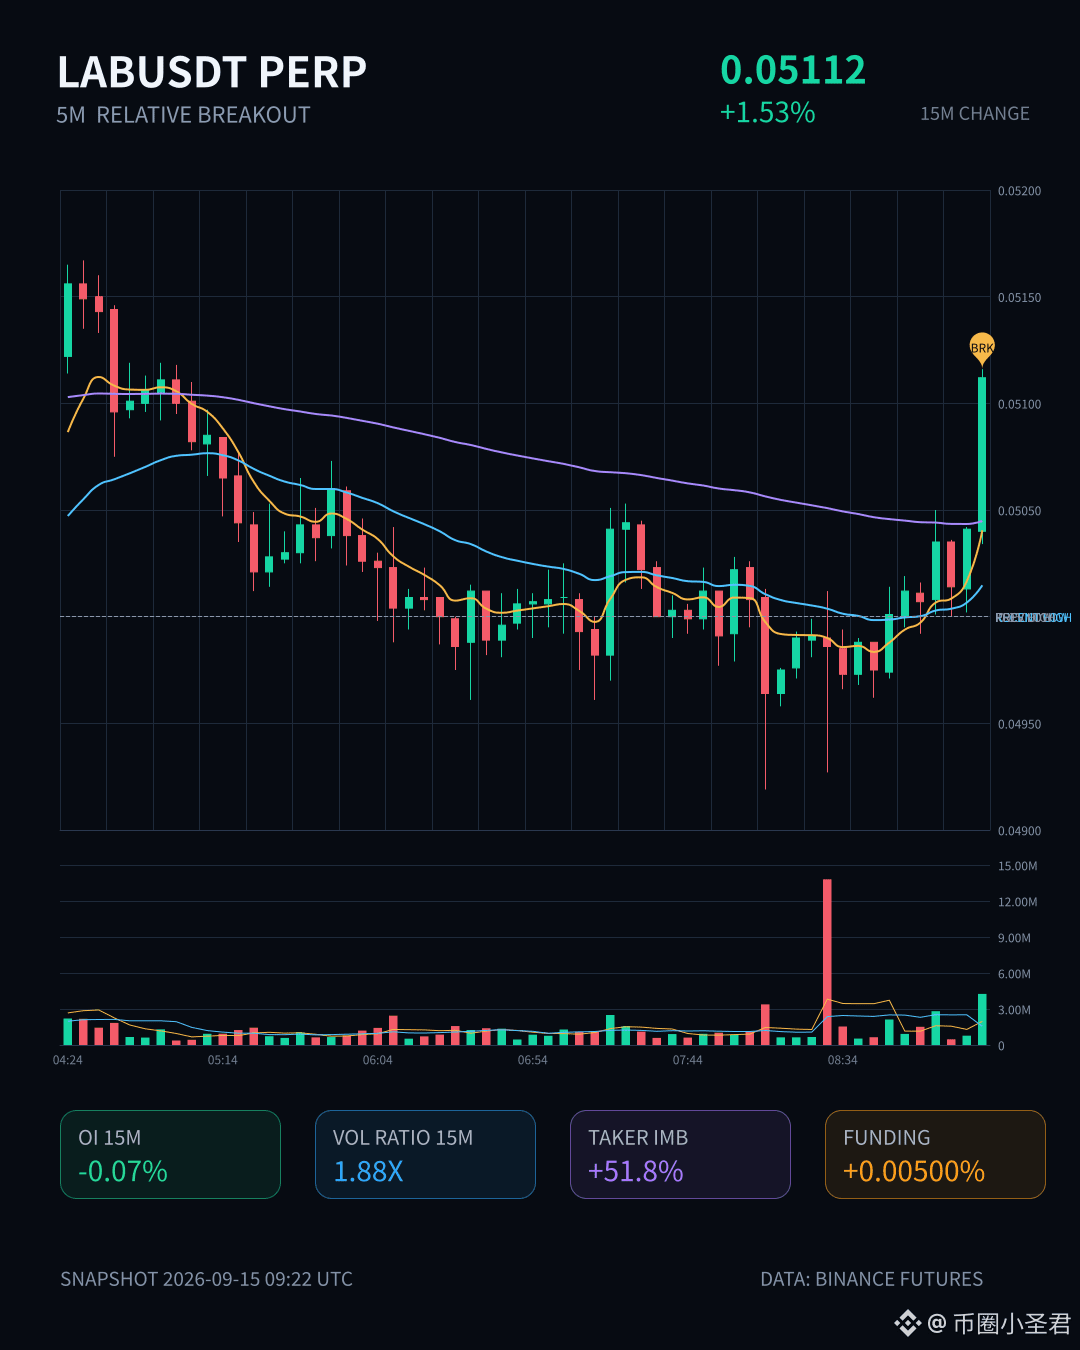
$LAB This 15-minute move is kind of interesting—the price is up 1.53%. The aggressive buy/sell imbalance reached 3.15 compared to simply pushing it directly. The bid side is skewed toward 51.8%, and the close even broke above the upper edge of the last 20 (5m) candles.
But OI is falling—15m -0.07%, 1h -1.30%. Price is rising while open interest declines—typical short-covering, not new long positions being driven in. Volume is 1.88x, Z value is 2.87, the abnormal percentile is 81.9%, the whole pool ranks at #13, and depth confirmation looks solid.
With this kind of structure, I generally take a closer look: if it’s purely short covering, once the pull continues but volume can’t keep up, it’s easier for price to retrace; but if aggressive buying remains persistently strong, it could be that someone is accumulating on the spot side while the futures just passively follow.
Over the past 24h, traded value is 36M—not a huge pool. One 15m candle can move about 1.5 points, so watch out for slippage. First, observe whether real buying continues after this short-covering run ends—don’t rush to chase.
$LAB This 15-minute move is kind of interesting—the price is up 1.53%. The aggressive buy/sell imbalance reached 3.15 compared to simply pushing it directly. The bid side is skewed toward 51.8%, and the close even broke above the upper edge of the last 20 (5m) candles.
But OI is falling—15m -0.07%, 1h -1.30%. Price is rising while open interest declines—typical short-covering, not new long positions being driven in. Volume is 1.88x, Z value is 2.87, the abnormal percentile is 81.9%, the whole pool ranks at #13, and depth confirmation looks solid.
With this kind of structure, I generally take a closer look: if it’s purely short covering, once the pull continues but volume can’t keep up, it’s easier for price to retrace; but if aggressive buying remains persistently strong, it could be that someone is accumulating on the spot side while the futures just passively follow.
Over the past 24h, traded value is 36M—not a huge pool. One 15m candle can move about 1.5 points, so watch out for slippage. First, observe whether real buying continues after this short-covering run ends—don’t rush to chase.
But OI is falling—15m -0.07%, 1h -1.30%. Price is rising while open interest declines—typical short-covering, not new long positions being driven in. Volume is 1.88x, Z value is 2.87, the abnormal percentile is 81.9%, the whole pool ranks at #13, and depth confirmation looks solid.
With this kind of structure, I generally take a closer look: if it’s purely short covering, once the pull continues but volume can’t keep up, it’s easier for price to retrace; but if aggressive buying remains persistently strong, it could be that someone is accumulating on the spot side while the futures just passively follow.
Over the past 24h, traded value is 36M—not a huge pool. One 15m candle can move about 1.5 points, so watch out for slippage. First, observe whether real buying continues after this short-covering run ends—don’t rush to chase.
17
·
--
$XLM This spot is a bit interesting.
In the 15m timeframe, volume surged and it was lifted by 3.88x. OI also moved in sync, increasing by 0.43%. Even though the nominal increase is only 520k U, on the 1h dimension it has been continuously adding for more than an hour. The anomaly percentile has climbed to 93.3%, ranking 6th in the whole pool. This isn’t the kind of move where a single needle spikes and it’s over; it’s more like someone has been continuously levering longs at this level.
Just now the close broke above the recent swing high on the 5m chart (around 20 lines). The buy-sell ratio is 1.16, and the passive buy order share is 7.3%. Funding rate is also in a high percentile recently. Price is rising, OI is rising, and the funding rate is lifting—this is a classic “new long” structure. Sentiment isn’t overheated yet, but it’s already starting to push upward.
24h trading volume is 116M. In terms of nominal changes within the pool, it ranks #13. Honestly, it’s not a huge ticket size, but this kind of anomaly that keeps extending across multiple consecutive cycles is often more worth watching than a single big bullish candle. Either someone got wind of something in advance, or it’s really time to pick a direction.
I’ll post an observation level first. I won’t chase; I’ll wait for a pullback to see how it holds.
$XLM This spot is a bit interesting.
In the 15m timeframe, volume surged and it was lifted by 3.88x. OI also moved in sync, increasing by 0.43%. Even though the nominal increase is only 520k U, on the 1h dimension it has been continuously adding for more than an hour. The anomaly percentile has climbed to 93.3%, ranking 6th in the whole pool. This isn’t the kind of move where a single needle spikes and it’s over; it’s more like someone has been continuously levering longs at this level.
Just now the close broke above the recent swing high on the 5m chart (around 20 lines). The buy-sell ratio is 1.16, and the passive buy order share is 7.3%. Funding rate is also in a high percentile recently. Price is rising, OI is rising, and the funding rate is lifting—this is a classic “new long” structure. Sentiment isn’t overheated yet, but it’s already starting to push upward.
24h trading volume is 116M. In terms of nominal changes within the pool, it ranks #13. Honestly, it’s not a huge ticket size, but this kind of anomaly that keeps extending across multiple consecutive cycles is often more worth watching than a single big bullish candle. Either someone got wind of something in advance, or it’s really time to pick a direction.
I’ll post an observation level first. I won’t chase; I’ll wait for a pullback to see how it holds.
In the 15m timeframe, volume surged and it was lifted by 3.88x. OI also moved in sync, increasing by 0.43%. Even though the nominal increase is only 520k U, on the 1h dimension it has been continuously adding for more than an hour. The anomaly percentile has climbed to 93.3%, ranking 6th in the whole pool. This isn’t the kind of move where a single needle spikes and it’s over; it’s more like someone has been continuously levering longs at this level.
Just now the close broke above the recent swing high on the 5m chart (around 20 lines). The buy-sell ratio is 1.16, and the passive buy order share is 7.3%. Funding rate is also in a high percentile recently. Price is rising, OI is rising, and the funding rate is lifting—this is a classic “new long” structure. Sentiment isn’t overheated yet, but it’s already starting to push upward.
24h trading volume is 116M. In terms of nominal changes within the pool, it ranks #13. Honestly, it’s not a huge ticket size, but this kind of anomaly that keeps extending across multiple consecutive cycles is often more worth watching than a single big bullish candle. Either someone got wind of something in advance, or it’s really time to pick a direction.
I’ll post an observation level first. I won’t chase; I’ll wait for a pullback to see how it holds.
43

Article
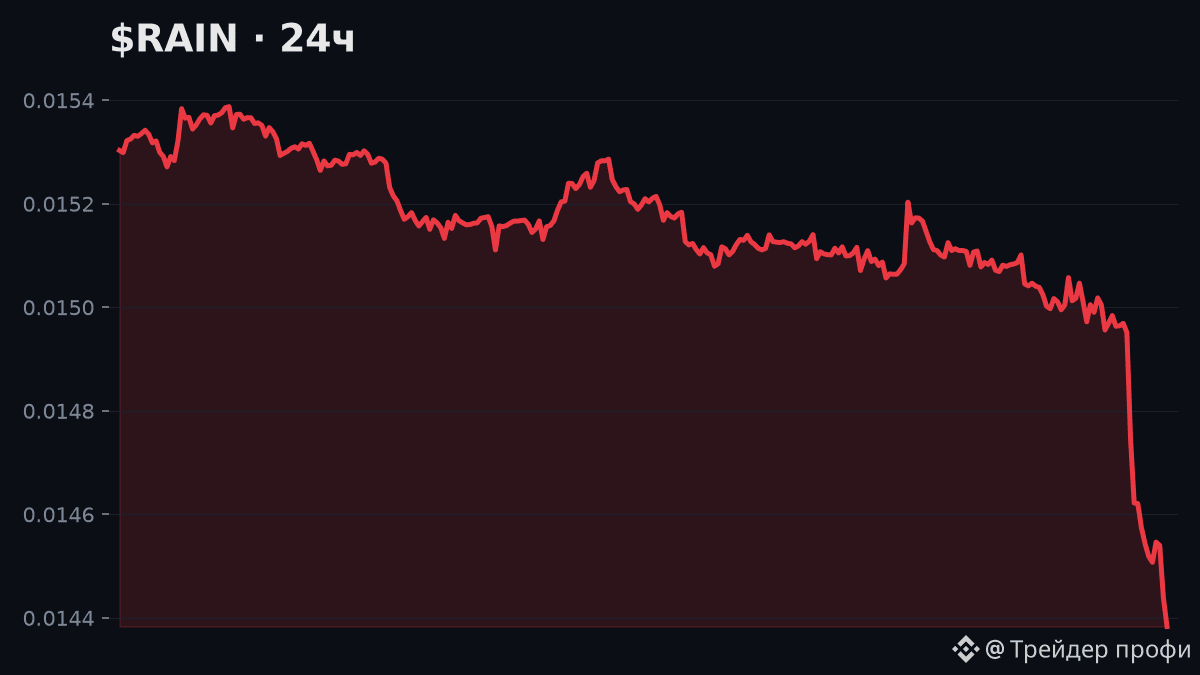
$RAIN -6.0% in 24h — dropped the most in the top-100!💥 $RAIN -6.0% in 24h — dropped the most in the top-100!
One ticker today is clearly not in its best shape.
🧭 Summary: the picture across timeframes is mixed — no single clear trend is visible; volume is low — the move may be unstable.
🌍 Market context: out of 56 major coins with notable movement over the past 24h — 🔼 39 rose, 🔽 17 fell
$RAIN -6.0% in 24h — dropped the most in the top-100!
💥 $RAIN -6.0% in 24h — dropped the most in the top-100!
One ticker today is clearly not in its best shape.
🧭 Summary: the picture across timeframes is mixed — no single clear trend is visible; volume is low — the move may be unstable.
🌍 Market context: out of 56 major coins with notable movement over the past 24h — 🔼 39 rose, 🔽 17 fell
One ticker today is clearly not in its best shape.
🧭 Summary: the picture across timeframes is mixed — no single clear trend is visible; volume is low — the move may be unstable.
🌍 Market context: out of 56 major coins with notable movement over the past 24h — 🔼 39 rose, 🔽 17 fell
88
·
--
MINA—this move is a bit too fast.
At 15m it surged straight up 3.53%, volume at 1.75x, volatility Z hit 3.35, and the close was near the upper edge of the last ~20 consecutive 5m range candles—classic boundary breakout.
But what really makes me take a second look is the OI: at 15m -1.64%, at 1h -1.71%. Price is rising while open interest is falling. This doesn’t look like new longs just entered aggressively—it’s more like shorts being forced to cover. The active trade ratio is only 0.4%, buy/sell is 1.01, which means the aggressive buy side isn’t really that strong, and it’s following only reluctantly.
Full-pool anomaly #13: the OI anomaly percentile is 92.5%, and it continues across several consecutive periods, so the confirmation is there. But structurally, I need to be clear—this is a positioning buyback-type move: it runs fast, and it also snaps back fast. Without fresh money coming in, don’t treat it as a trend start.
Over 24h, turnover is 17.95M. The pool isn’t that deep. At this volume level, a quick OI squeeze alone can push price. It looks exciting, but whether it can hold up is another question.
My approach: I don’t chase this kind of structure. I wait for the pullback and see whether there are any real longs willing to build positions during the retracement. If the pullback comes with no volume, then this 3.53% today is basically just a short-squeeze fireworks show.
MINA—this move is a bit too fast.
At 15m it surged straight up 3.53%, volume at 1.75x, volatility Z hit 3.35, and the close was near the upper edge of the last ~20 consecutive 5m range candles—classic boundary breakout.
But what really makes me take a second look is the OI: at 15m -1.64%, at 1h -1.71%. Price is rising while open interest is falling. This doesn’t look like new longs just entered aggressively—it’s more like shorts being forced to cover. The active trade ratio is only 0.4%, buy/sell is 1.01, which means the aggressive buy side isn’t really that strong, and it’s following only reluctantly.
Full-pool anomaly #13: the OI anomaly percentile is 92.5%, and it continues across several consecutive periods, so the confirmation is there. But structurally, I need to be clear—this is a positioning buyback-type move: it runs fast, and it also snaps back fast. Without fresh money coming in, don’t treat it as a trend start.
Over 24h, turnover is 17.95M. The pool isn’t that deep. At this volume level, a quick OI squeeze alone can push price. It looks exciting, but whether it can hold up is another question.
My approach: I don’t chase this kind of structure. I wait for the pullback and see whether there are any real longs willing to build positions during the retracement. If the pullback comes with no volume, then this 3.53% today is basically just a short-squeeze fireworks show.
At 15m it surged straight up 3.53%, volume at 1.75x, volatility Z hit 3.35, and the close was near the upper edge of the last ~20 consecutive 5m range candles—classic boundary breakout.
But what really makes me take a second look is the OI: at 15m -1.64%, at 1h -1.71%. Price is rising while open interest is falling. This doesn’t look like new longs just entered aggressively—it’s more like shorts being forced to cover. The active trade ratio is only 0.4%, buy/sell is 1.01, which means the aggressive buy side isn’t really that strong, and it’s following only reluctantly.
Full-pool anomaly #13: the OI anomaly percentile is 92.5%, and it continues across several consecutive periods, so the confirmation is there. But structurally, I need to be clear—this is a positioning buyback-type move: it runs fast, and it also snaps back fast. Without fresh money coming in, don’t treat it as a trend start.
Over 24h, turnover is 17.95M. The pool isn’t that deep. At this volume level, a quick OI squeeze alone can push price. It looks exciting, but whether it can hold up is another question.
My approach: I don’t chase this kind of structure. I wait for the pullback and see whether there are any real longs willing to build positions during the retracement. If the pullback comes with no volume, then this 3.53% today is basically just a short-squeeze fireworks show.
3
·
--
$VVV This move is a bit interesting. In the 15m timeframe, it pulled up 1.1%, and the volume even spiked to 1.75x. The closing price also broke above the upper band of the past 20 consecutive 5m candles. But note the OI: the 15m contract is -0.03% and the 1h is -0.46%. Price is up while open interest is down—this is the classic short covering script, not new longs entering.
Taker/active volume is 5.1% lower; buy/sell ratio is 1.11. The order book looks slightly buyer-favored, with a 24h trading value of 49M. The anomaly percentile is 86.5%, the whole pool is #13, nominal change is #18, and the depth confirmation has passed too.
With this kind of structure, I usually don’t chase the first candle. In a trend pushed up by short covering, once that covering momentum fades, it’s easy for price to get stuck and churn in place. Let’s see if it can hold above the upper edge of this range. If it can’t, then it’s a false breakout.
$VVV This move is a bit interesting. In the 15m timeframe, it pulled up 1.1%, and the volume even spiked to 1.75x. The closing price also broke above the upper band of the past 20 consecutive 5m candles. But note the OI: the 15m contract is -0.03% and the 1h is -0.46%. Price is up while open interest is down—this is the classic short covering script, not new longs entering.
Taker/active volume is 5.1% lower; buy/sell ratio is 1.11. The order book looks slightly buyer-favored, with a 24h trading value of 49M. The anomaly percentile is 86.5%, the whole pool is #13, nominal change is #18, and the depth confirmation has passed too.
With this kind of structure, I usually don’t chase the first candle. In a trend pushed up by short covering, once that covering momentum fades, it’s easy for price to get stuck and churn in place. Let’s see if it can hold above the upper edge of this range. If it can’t, then it’s a false breakout.
Taker/active volume is 5.1% lower; buy/sell ratio is 1.11. The order book looks slightly buyer-favored, with a 24h trading value of 49M. The anomaly percentile is 86.5%, the whole pool is #13, nominal change is #18, and the depth confirmation has passed too.
With this kind of structure, I usually don’t chase the first candle. In a trend pushed up by short covering, once that covering momentum fades, it’s easy for price to get stuck and churn in place. Let’s see if it can hold above the upper edge of this range. If it can’t, then it’s a false breakout.
21
·
--
$GPS This one is a bit interesting—on the 15m timeframe it directly surged 1.45%. Volume picked up by 3.85x, the Z value is 3.57, and it’s no longer at the “just shake it a bit” level.
What’s key is the structure: as price moved up, OI (open interest) was also rising. Over 1h it’s +0.44%, over 15m it’s +0.37%. The nominal increase isn’t huge, but the abnormal percentile has already reached 95.4%, in the whole pool #13. This kind of continuous OI abnormality sustained across multiple consecutive cycles is more worth watching than a single spike; it looks more like fresh leveraged long positions pushing, rather than a fake move from shorts covering.
In the order book, active trades differ by 22.9%, buy/sell ratio is 1.59—direction is pretty clear. The closing price just broke above the upper edge of the recent 20x 5m range, and the funding rate is also in a high percentile recently. Across the four dimensions—volume, price, OI, and funding—everything aligns well; the coordination level is fairly high.
24h turnover is 15.82M. The pool isn’t that thick, so if it keeps going, amplified volatility is likely. Also, this level is close to its own historical extreme zone. Before chasing, think through your position sizing and stop-loss—don’t get shaken out by this kind of abnormality leading the pool.
$GPS This one is a bit interesting—on the 15m timeframe it directly surged 1.45%. Volume picked up by 3.85x, the Z value is 3.57, and it’s no longer at the “just shake it a bit” level.
What’s key is the structure: as price moved up, OI (open interest) was also rising. Over 1h it’s +0.44%, over 15m it’s +0.37%. The nominal increase isn’t huge, but the abnormal percentile has already reached 95.4%, in the whole pool #13. This kind of continuous OI abnormality sustained across multiple consecutive cycles is more worth watching than a single spike; it looks more like fresh leveraged long positions pushing, rather than a fake move from shorts covering.
In the order book, active trades differ by 22.9%, buy/sell ratio is 1.59—direction is pretty clear. The closing price just broke above the upper edge of the recent 20x 5m range, and the funding rate is also in a high percentile recently. Across the four dimensions—volume, price, OI, and funding—everything aligns well; the coordination level is fairly high.
24h turnover is 15.82M. The pool isn’t that thick, so if it keeps going, amplified volatility is likely. Also, this level is close to its own historical extreme zone. Before chasing, think through your position sizing and stop-loss—don’t get shaken out by this kind of abnormality leading the pool.
What’s key is the structure: as price moved up, OI (open interest) was also rising. Over 1h it’s +0.44%, over 15m it’s +0.37%. The nominal increase isn’t huge, but the abnormal percentile has already reached 95.4%, in the whole pool #13. This kind of continuous OI abnormality sustained across multiple consecutive cycles is more worth watching than a single spike; it looks more like fresh leveraged long positions pushing, rather than a fake move from shorts covering.
In the order book, active trades differ by 22.9%, buy/sell ratio is 1.59—direction is pretty clear. The closing price just broke above the upper edge of the recent 20x 5m range, and the funding rate is also in a high percentile recently. Across the four dimensions—volume, price, OI, and funding—everything aligns well; the coordination level is fairly high.
24h turnover is 15.82M. The pool isn’t that thick, so if it keeps going, amplified volatility is likely. Also, this level is close to its own historical extreme zone. Before chasing, think through your position sizing and stop-loss—don’t get shaken out by this kind of abnormality leading the pool.
45
·
--
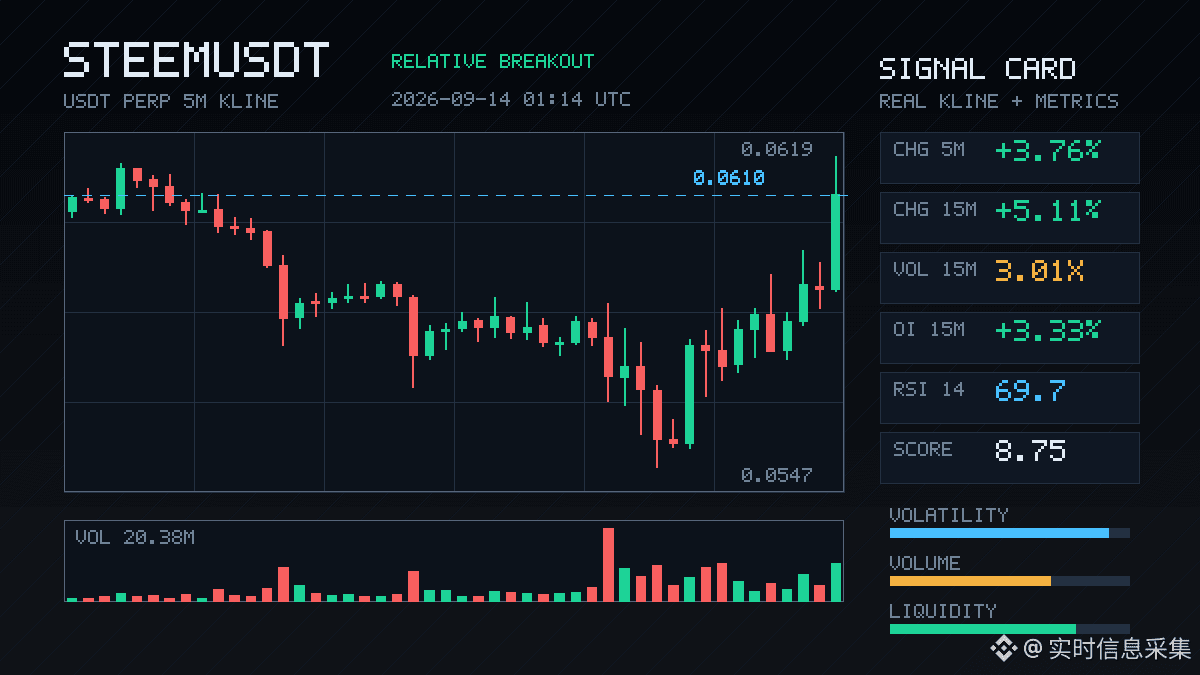
$STEEM This move is kind of interesting.
In the 15m timeframe, it directly surged 5.11%, with volume hitting 3x the usual level. The closing price also broke through the upper edge of the most recent 20 consecutive 5m candles. The key point is that OI is rising in sync—15m is +3.33%, 1h is +2.87%, and the anomaly percentile is 92.3%, ranking #13 across the whole pool. Price rising together with OI rising makes this structure look more like fresh leveraged long positions entering, rather than some kind of short-covering “false heat.”
The aggressive trade gap is 7.7%, the buy/sell ratio is 1.17, and the funding rate has also climbed to a recent high percentile. Volume, price, and OI are all aligned across these three dimensions, and the short-term momentum is indeed strong.
But honestly, with the funding rate already at a high percentile and OI stacking up over several consecutive periods, this combination becomes more and more something to be careful about the further it goes. If you chase, keep your stop-loss tight—don’t get taken out by a sudden liquidation wave.
$STEEM This move is kind of interesting.
In the 15m timeframe, it directly surged 5.11%, with volume hitting 3x the usual level. The closing price also broke through the upper edge of the most recent 20 consecutive 5m candles. The key point is that OI is rising in sync—15m is +3.33%, 1h is +2.87%, and the anomaly percentile is 92.3%, ranking #13 across the whole pool. Price rising together with OI rising makes this structure look more like fresh leveraged long positions entering, rather than some kind of short-covering “false heat.”
The aggressive trade gap is 7.7%, the buy/sell ratio is 1.17, and the funding rate has also climbed to a recent high percentile. Volume, price, and OI are all aligned across these three dimensions, and the short-term momentum is indeed strong.
But honestly, with the funding rate already at a high percentile and OI stacking up over several consecutive periods, this combination becomes more and more something to be careful about the further it goes. If you chase, keep your stop-loss tight—don’t get taken out by a sudden liquidation wave.
In the 15m timeframe, it directly surged 5.11%, with volume hitting 3x the usual level. The closing price also broke through the upper edge of the most recent 20 consecutive 5m candles. The key point is that OI is rising in sync—15m is +3.33%, 1h is +2.87%, and the anomaly percentile is 92.3%, ranking #13 across the whole pool. Price rising together with OI rising makes this structure look more like fresh leveraged long positions entering, rather than some kind of short-covering “false heat.”
The aggressive trade gap is 7.7%, the buy/sell ratio is 1.17, and the funding rate has also climbed to a recent high percentile. Volume, price, and OI are all aligned across these three dimensions, and the short-term momentum is indeed strong.
But honestly, with the funding rate already at a high percentile and OI stacking up over several consecutive periods, this combination becomes more and more something to be careful about the further it goes. If you chase, keep your stop-loss tight—don’t get taken out by a sudden liquidation wave.
50
Log in to explore more content
Join global crypto users on Binance Square
⚡️ Get latest and useful information about crypto.
💬 Trusted by the world’s largest crypto exchange.
👍 Discover real insights from verified creators.
Email / Phone number
Trending Topics
1
#StellarActivatesProtocol28At211TPS
1,832 views
77 Discussing
2
#SECGrantsInnovationExemptionForTokenizedStocks
1,833 views
105 Discussing
3
#XRPGains3%AsRippleAddsMPPSupport
1,094 views
74 Discussing
4
#SPGlobalToAcquireOpenZeppelin
907 views
52 Discussing
5
#BitcoinSurpasses$77000
19,523 views
234 Discussing
6
#ParadigmDisclosesZECHolding
80,542 views
1,165 Discussing
7
#BitcoinETFsShed$450M
27,854 views
222 Discussing
8
#USWeeklyJoblessClaimsFallTo196K
44,406 views
670 Discussing
9
#ArkhamSaysBlackRockBuys$1.5BInETH
7,502 views
74 Discussing
10
#FCARaidsThreeLondonIllegalCryptoSites
3,248 views
88 Discussing