
Crypto PM
14.3k Posts

Crypto PM
 Square Verified+
Report
Block User
x.com/cryptopm_

Creator of the Year
Frequent Trader
9.1 Years
28 Following
322.5K+ Followers
389.2K+ Liked
4 Badges
Posts
All
Quotes
Videos
Live
PINNED
·
--
Bullish
What's your single-day biggest loss on Binance?
Back in 2021, my biggest single-trade loss was around $900K on a $BTC trade.
I managed to make it back eventually, but that loss taught me a lot about risk management.
And here's my PNL for this year 👇
Be honest, bro. Don’t lie - we’re traders. 😅📉
What's your single-day biggest loss on Binance?
Back in 2021, my biggest single-trade loss was around $900K on a $BTC trade.
I managed to make it back eventually, but that loss taught me a lot about risk management.
And here's my PNL for this year 👇
Be honest, bro. Don’t lie - we’re traders. 😅📉
Back in 2021, my biggest single-trade loss was around $900K on a $BTC trade.
I managed to make it back eventually, but that loss taught me a lot about risk management.
And here's my PNL for this year 👇
Be honest, bro. Don’t lie - we’re traders. 😅📉

111
4
113
110.6k
·
--
Bullish
🚀 $AXL is showing strong bullish momentum.
{future}(AXLUSDT)
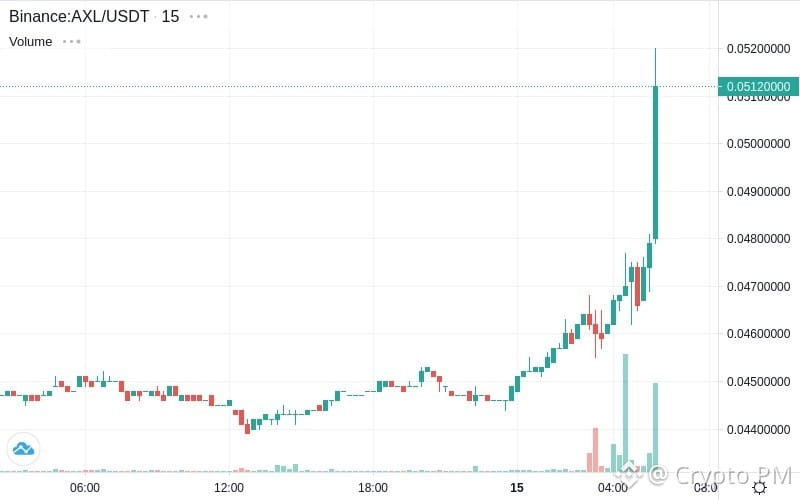
The price moved from $0.0467 to $0.0509, recording a +8.99% gain.
Trading volume surged to $1.12M, up 47.61%, with an additional $361.47K in volume - a strong confirmation that buying activity is increasing alongside the price breakout.
The 15m chart shows a clear acceleration from the $0.044–$0.046 consolidation zone. $AXL has been printing higher highs and higher lows, with the latest candles pushing decisively above $0.048.
The immediate level to watch is $0.051–$0.052. A clean breakout and hold above this zone could open the way toward $0.054–$0.056.
$AXL is showing a convincing momentum shift. The 47%+ volume expansion makes this move notable, but the latest candle is already quite extended. A retest around $0.048–$0.050 would be healthier than chasing the current spike.
🚀 $AXL is showing strong bullish momentum.
The price moved from $0.0467 to $0.0509, recording a +8.99% gain.
Trading volume surged to $1.12M, up 47.61%, with an additional $361.47K in volume - a strong confirmation that buying activity is increasing alongside the price breakout.
The 15m chart shows a clear acceleration from the $0.044–$0.046 consolidation zone. $AXL has been printing higher highs and higher lows, with the latest candles pushing decisively above $0.048.
The immediate level to watch is $0.051–$0.052. A clean breakout and hold above this zone could open the way toward $0.054–$0.056.
$AXL is showing a convincing momentum shift. The 47%+ volume expansion makes this move notable, but the latest candle is already quite extended. A retest around $0.048–$0.050 would be healthier than chasing the current spike.
The price moved from $0.0467 to $0.0509, recording a +8.99% gain.
Trading volume surged to $1.12M, up 47.61%, with an additional $361.47K in volume - a strong confirmation that buying activity is increasing alongside the price breakout.
The 15m chart shows a clear acceleration from the $0.044–$0.046 consolidation zone. $AXL has been printing higher highs and higher lows, with the latest candles pushing decisively above $0.048.
The immediate level to watch is $0.051–$0.052. A clean breakout and hold above this zone could open the way toward $0.054–$0.056.
$AXL is showing a convincing momentum shift. The 47%+ volume expansion makes this move notable, but the latest candle is already quite extended. A retest around $0.048–$0.050 would be healthier than chasing the current spike.
2
165
·
--
Bullish
🚀 $VTHO is showing a strong bullish reversal.
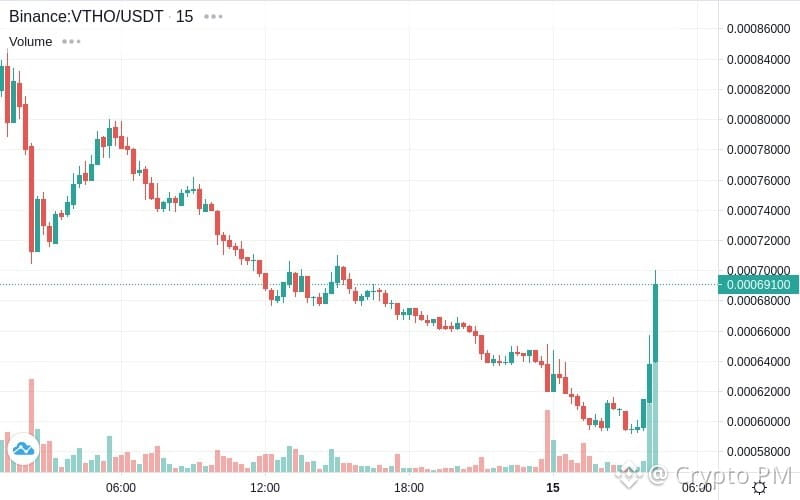
The price moved from $0.000597 to $0.000690, recording a +15.58% gain.
Trading volume surged to $6.17M, up 32.84%, with an additional $1.52M in volume - a strong increase in market activity accompanying the breakout.
{future}(VTHOUSDT)
The 15m chart is particularly interesting here. $VTHO had been stuck in a clear downtrend, but the latest move has completely changed the short-term structure. Price broke sharply above the $0.00064–$0.00066 area with a massive volume expansion.
The immediate level to watch is $0.00070. A clean break and hold above it could open the way toward $0.00072–$0.00076.
$VTHO is showing a serious momentum shift. The volume confirmation makes this move much more interesting than a simple low-volume bounce. Still, after a 15%+ move, chasing the candle is risky - a retest of $0.00066–$0.00068 would provide a much cleaner setup.
🚀 $VTHO is showing a strong bullish reversal.
The price moved from $0.000597 to $0.000690, recording a +15.58% gain.
Trading volume surged to $6.17M, up 32.84%, with an additional $1.52M in volume - a strong increase in market activity accompanying the breakout.
The 15m chart is particularly interesting here. $VTHO had been stuck in a clear downtrend, but the latest move has completely changed the short-term structure. Price broke sharply above the $0.00064–$0.00066 area with a massive volume expansion.
The immediate level to watch is $0.00070. A clean break and hold above it could open the way toward $0.00072–$0.00076.
$VTHO is showing a serious momentum shift. The volume confirmation makes this move much more interesting than a simple low-volume bounce. Still, after a 15%+ move, chasing the candle is risky - a retest of $0.00066–$0.00068 would provide a much cleaner setup.
The price moved from $0.000597 to $0.000690, recording a +15.58% gain.
Trading volume surged to $6.17M, up 32.84%, with an additional $1.52M in volume - a strong increase in market activity accompanying the breakout.
The 15m chart is particularly interesting here. $VTHO had been stuck in a clear downtrend, but the latest move has completely changed the short-term structure. Price broke sharply above the $0.00064–$0.00066 area with a massive volume expansion.
The immediate level to watch is $0.00070. A clean break and hold above it could open the way toward $0.00072–$0.00076.
$VTHO is showing a serious momentum shift. The volume confirmation makes this move much more interesting than a simple low-volume bounce. Still, after a 15%+ move, chasing the candle is risky - a retest of $0.00066–$0.00068 would provide a much cleaner setup.
4
671
·
--
Bearish
$ICP is showing strong bearish pressure.
{future}(ICPUSDT)
A large whale sell order just hit the market:
Price: $2.64 (-2.91%)
Sold: 83.92K ICP
Order Size: $224.91K
Duration: 11 minutes
24H Volume: $4.50M
Order = ~5% of 24H volume
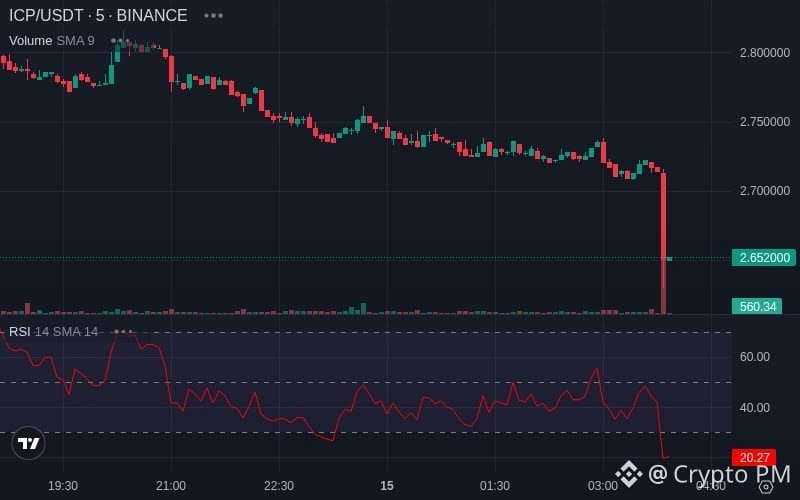
The 5m chart shows a sharp breakdown from the $2.70–$2.72 area, with a massive volume spike accompanying the sell-off.
The key point is that this wasn't just a gradual decline - 83.92K ICP was sold within 11 minutes, while price simultaneously broke below the recent trading range.
RSI has also dropped to around 20, putting short-term momentum firmly in oversold territory. That increases the probability of a relief bounce, but oversold does not automatically mean bullish reversal.
For now, $2.70–$2.72 becomes the key resistance zone. Unless ICP can reclaim that area, the bearish structure remains intact.
$ICP needs to stabilize before considering a meaningful reversal. A bounce is possible from oversold conditions, but the whale selling pressure is the signal I'd take seriously here.
$ICP is showing strong bearish pressure.
A large whale sell order just hit the market:
Price: $2.64 (-2.91%)
Sold: 83.92K ICP
Order Size: $224.91K
Duration: 11 minutes
24H Volume: $4.50M
Order = ~5% of 24H volume
The 5m chart shows a sharp breakdown from the $2.70–$2.72 area, with a massive volume spike accompanying the sell-off.
The key point is that this wasn't just a gradual decline - 83.92K ICP was sold within 11 minutes, while price simultaneously broke below the recent trading range.
RSI has also dropped to around 20, putting short-term momentum firmly in oversold territory. That increases the probability of a relief bounce, but oversold does not automatically mean bullish reversal.
For now, $2.70–$2.72 becomes the key resistance zone. Unless ICP can reclaim that area, the bearish structure remains intact.
$ICP needs to stabilize before considering a meaningful reversal. A bounce is possible from oversold conditions, but the whale selling pressure is the signal I'd take seriously here.
A large whale sell order just hit the market:
Price: $2.64 (-2.91%)
Sold: 83.92K ICP
Order Size: $224.91K
Duration: 11 minutes
24H Volume: $4.50M
Order = ~5% of 24H volume
The 5m chart shows a sharp breakdown from the $2.70–$2.72 area, with a massive volume spike accompanying the sell-off.
The key point is that this wasn't just a gradual decline - 83.92K ICP was sold within 11 minutes, while price simultaneously broke below the recent trading range.
RSI has also dropped to around 20, putting short-term momentum firmly in oversold territory. That increases the probability of a relief bounce, but oversold does not automatically mean bullish reversal.
For now, $2.70–$2.72 becomes the key resistance zone. Unless ICP can reclaim that area, the bearish structure remains intact.
$ICP needs to stabilize before considering a meaningful reversal. A bounce is possible from oversold conditions, but the whale selling pressure is the signal I'd take seriously here.
3
985
·
--
Bullish
$ZIL is showing explosive bullish momentum.
{future}(ZILUSDT)
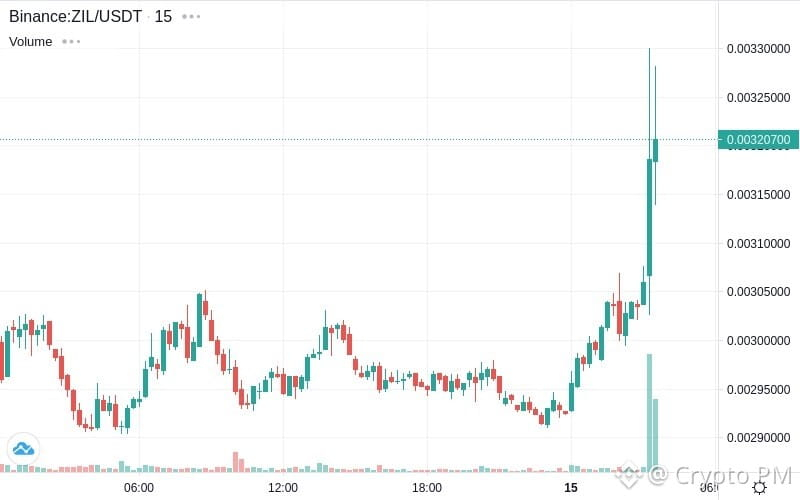
The price moved from $0.00303 to $0.00325, recording a +7.09% gain.
Trading volume surged to $1.41M, up a massive 75.61%, with an additional $607.96K in volume - a major increase in market activity accompanying the price breakout.
The 15m chart shows $ZIL breaking out from the $0.00295–$0.00305 consolidation range, followed by a sharp vertical move above $0.00310. The latest candles are backed by a significant volume spike.
If buyers can hold above $0.00320, the $0.00330–$0.00350 zone could be the next area of interest.
$ZIL is showing a clear momentum shift. The 75%+ volume expansion is the standout signal here, but the latest move is extremely aggressive. A retest of $0.00310–$0.00320 would be healthy before expecting another leg higher. Don't blindly chase the spike.
$ZIL is showing explosive bullish momentum.
The price moved from $0.00303 to $0.00325, recording a +7.09% gain.
Trading volume surged to $1.41M, up a massive 75.61%, with an additional $607.96K in volume - a major increase in market activity accompanying the price breakout.
The 15m chart shows $ZIL breaking out from the $0.00295–$0.00305 consolidation range, followed by a sharp vertical move above $0.00310. The latest candles are backed by a significant volume spike.
If buyers can hold above $0.00320, the $0.00330–$0.00350 zone could be the next area of interest.
$ZIL is showing a clear momentum shift. The 75%+ volume expansion is the standout signal here, but the latest move is extremely aggressive. A retest of $0.00310–$0.00320 would be healthy before expecting another leg higher. Don't blindly chase the spike.
The price moved from $0.00303 to $0.00325, recording a +7.09% gain.
Trading volume surged to $1.41M, up a massive 75.61%, with an additional $607.96K in volume - a major increase in market activity accompanying the price breakout.
The 15m chart shows $ZIL breaking out from the $0.00295–$0.00305 consolidation range, followed by a sharp vertical move above $0.00310. The latest candles are backed by a significant volume spike.
If buyers can hold above $0.00320, the $0.00330–$0.00350 zone could be the next area of interest.
$ZIL is showing a clear momentum shift. The 75%+ volume expansion is the standout signal here, but the latest move is extremely aggressive. A retest of $0.00310–$0.00320 would be healthy before expecting another leg higher. Don't blindly chase the spike.
2
581
·
--
Bullish
$TREE is showing strong bullish momentum.
{future}(TREEUSDT)
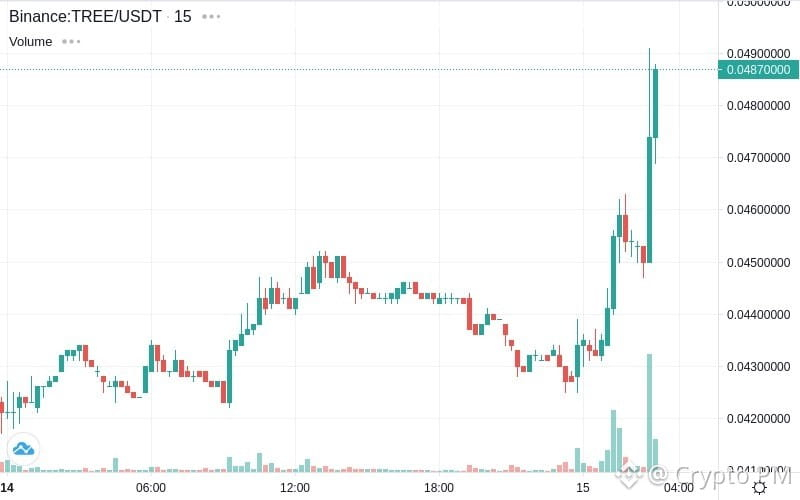
The price moved from $0.0454 to $0.0486, recording a +7.05% gain.
Trading volume surged to $1.99M, up a massive 45.20%, with an additional $620.81K in volume - a strong confirmation that market participation is increasing alongside the price move.
The 15m chart shows a sharp breakout from the $0.043–$0.045 consolidation range. The latest move is backed by a significant volume spike, with price now pushing toward the $0.049–$0.050 resistance zone.
If buyers can break and hold above $0.050, the next area of interest could be around $0.052–$0.055.
$TREE is showing a clear momentum shift. The volume expansion makes the breakout more convincing, but after such a fast move, a retest around $0.046–$0.047 would be completely normal. Avoid blindly chasing the pump.
$TREE is showing strong bullish momentum.
The price moved from $0.0454 to $0.0486, recording a +7.05% gain.
Trading volume surged to $1.99M, up a massive 45.20%, with an additional $620.81K in volume - a strong confirmation that market participation is increasing alongside the price move.
The 15m chart shows a sharp breakout from the $0.043–$0.045 consolidation range. The latest move is backed by a significant volume spike, with price now pushing toward the $0.049–$0.050 resistance zone.
If buyers can break and hold above $0.050, the next area of interest could be around $0.052–$0.055.
$TREE is showing a clear momentum shift. The volume expansion makes the breakout more convincing, but after such a fast move, a retest around $0.046–$0.047 would be completely normal. Avoid blindly chasing the pump.
The price moved from $0.0454 to $0.0486, recording a +7.05% gain.
Trading volume surged to $1.99M, up a massive 45.20%, with an additional $620.81K in volume - a strong confirmation that market participation is increasing alongside the price move.
The 15m chart shows a sharp breakout from the $0.043–$0.045 consolidation range. The latest move is backed by a significant volume spike, with price now pushing toward the $0.049–$0.050 resistance zone.
If buyers can break and hold above $0.050, the next area of interest could be around $0.052–$0.055.
$TREE is showing a clear momentum shift. The volume expansion makes the breakout more convincing, but after such a fast move, a retest around $0.046–$0.047 would be completely normal. Avoid blindly chasing the pump.
2
649
·
--
Bearish
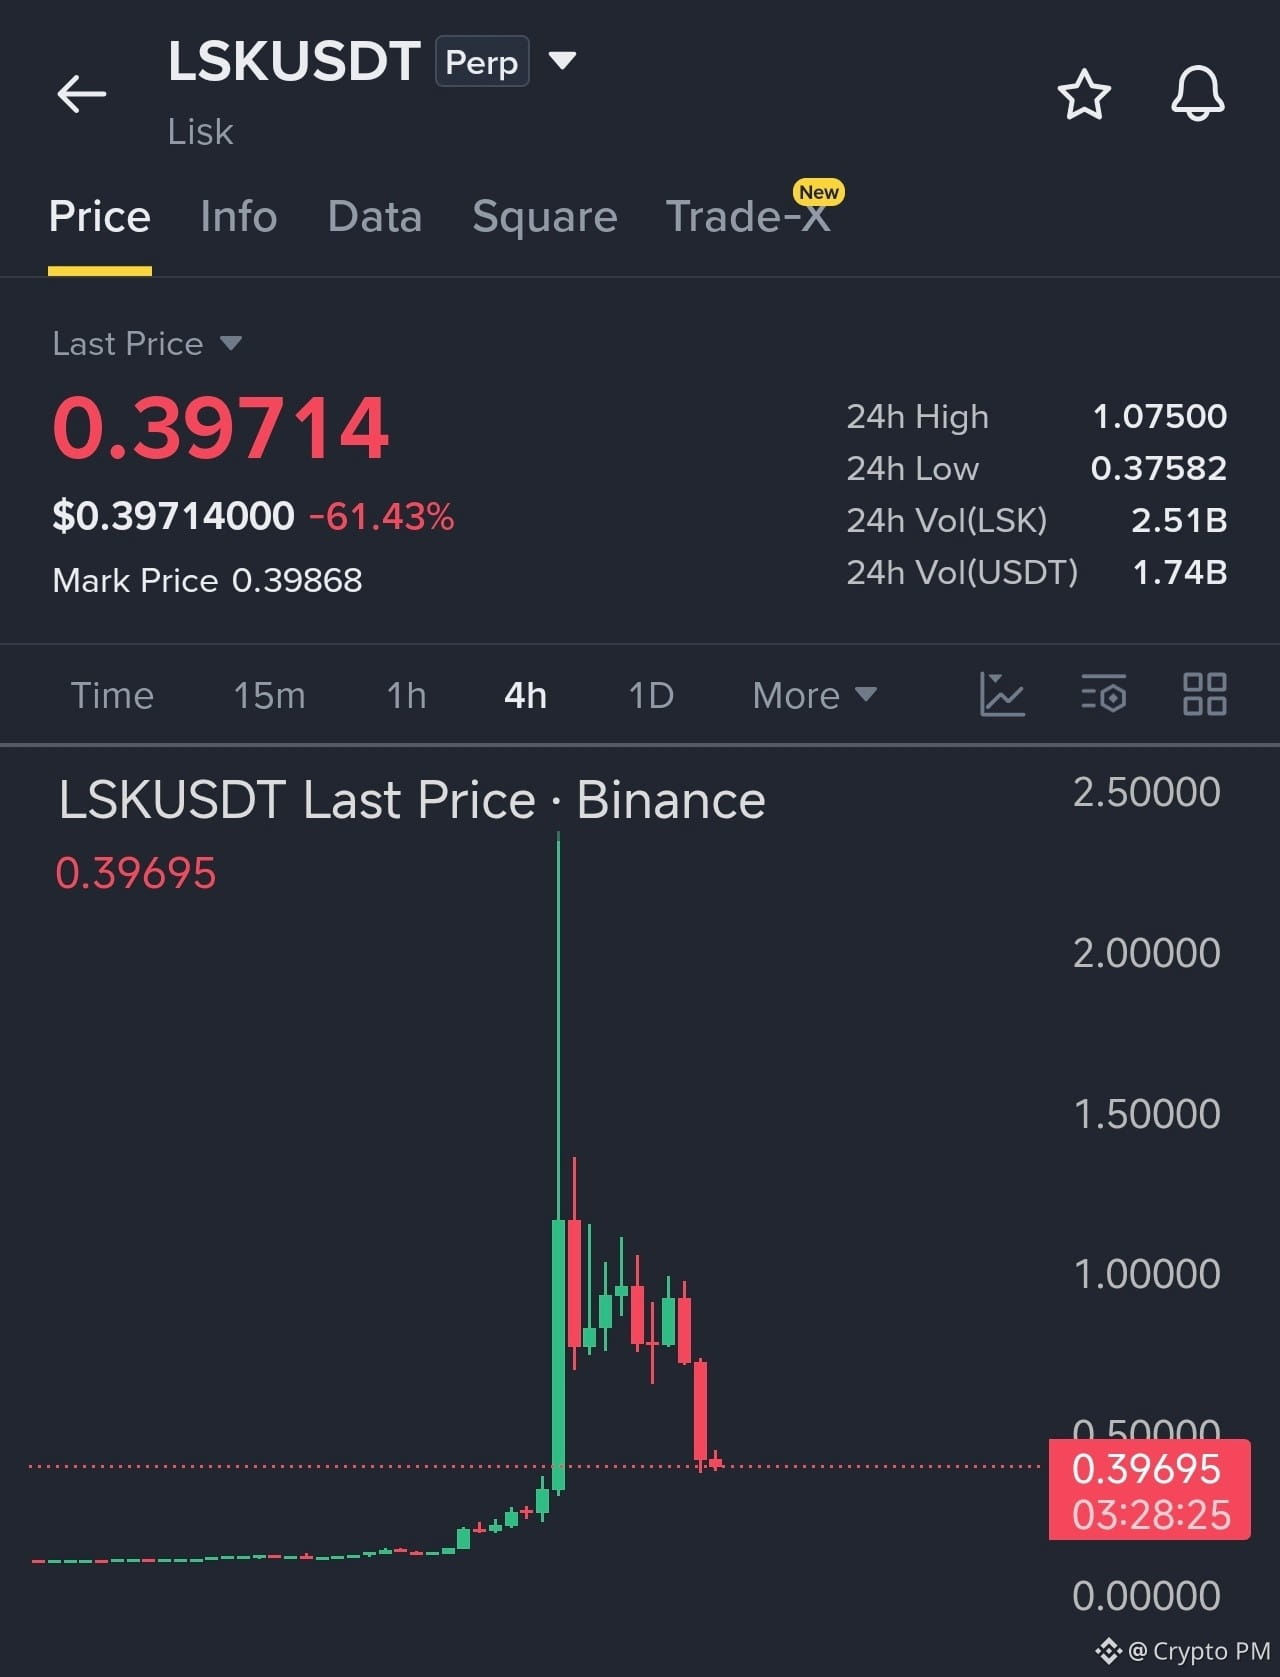
Bro i have a genuine question about $LSK price action.
What's the highest punishment for this type of pump/dump crime..? 😂
Bro i have a genuine question about $LSK price action.
What's the highest punishment for this type of pump/dump crime..? 😂
What's the highest punishment for this type of pump/dump crime..? 😂
10
12
13.5k
·
--
Bullish
$HEMI is showing strong bullish momentum.
{future}(HEMIUSDT)
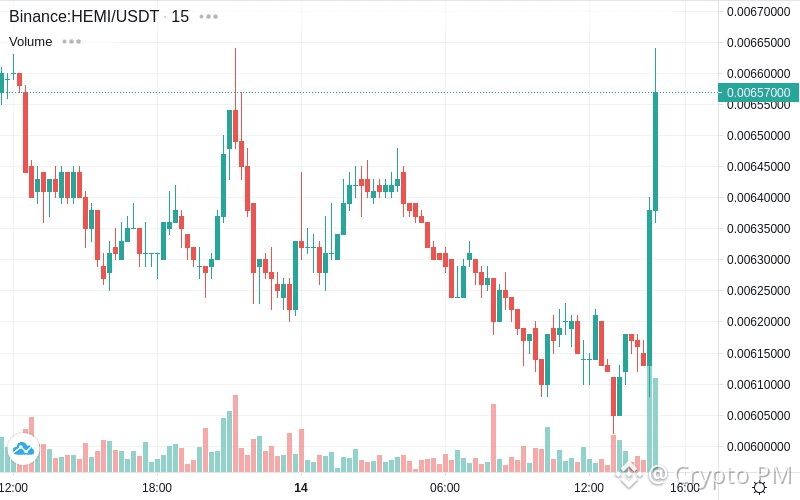
The price moved from $0.00616 to $0.00663, recording a +7.63% gain.
Trading volume surged to $3.05M, up 17.47%, with an additional $453.56K in volume - showing a clear increase in market activity as buyers stepped in aggressively.
The 15m chart shows a sharp reversal from the $0.0060–$0.0062 area, followed by a powerful breakout candle that pushed $HEMI toward the $0.0066 region.
If buyers can hold above $0.0065, the $0.0067–$0.0070 zone could be the next area of interest.
$HEMI is showing a strong momentum shift.
The volume expansion supports the move, but the latest candle is extremely aggressive, so a pullback or retest of $0.0064–$0.0065 would be completely normal before any continuation.
Don't blindly chase the spike.
$HEMI is showing strong bullish momentum.
The price moved from $0.00616 to $0.00663, recording a +7.63% gain.
Trading volume surged to $3.05M, up 17.47%, with an additional $453.56K in volume - showing a clear increase in market activity as buyers stepped in aggressively.
The 15m chart shows a sharp reversal from the $0.0060–$0.0062 area, followed by a powerful breakout candle that pushed $HEMI toward the $0.0066 region.
If buyers can hold above $0.0065, the $0.0067–$0.0070 zone could be the next area of interest.
$HEMI is showing a strong momentum shift.
The volume expansion supports the move, but the latest candle is extremely aggressive, so a pullback or retest of $0.0064–$0.0065 would be completely normal before any continuation.
Don't blindly chase the spike.
The price moved from $0.00616 to $0.00663, recording a +7.63% gain.
Trading volume surged to $3.05M, up 17.47%, with an additional $453.56K in volume - showing a clear increase in market activity as buyers stepped in aggressively.
The 15m chart shows a sharp reversal from the $0.0060–$0.0062 area, followed by a powerful breakout candle that pushed $HEMI toward the $0.0066 region.
If buyers can hold above $0.0065, the $0.0067–$0.0070 zone could be the next area of interest.
$HEMI is showing a strong momentum shift.
The volume expansion supports the move, but the latest candle is extremely aggressive, so a pullback or retest of $0.0064–$0.0065 would be completely normal before any continuation.
Don't blindly chase the spike.
5
1.7k
·
--
Bullish
$REZ is showing strong bullish momentum.
{future}(REZUSDT)
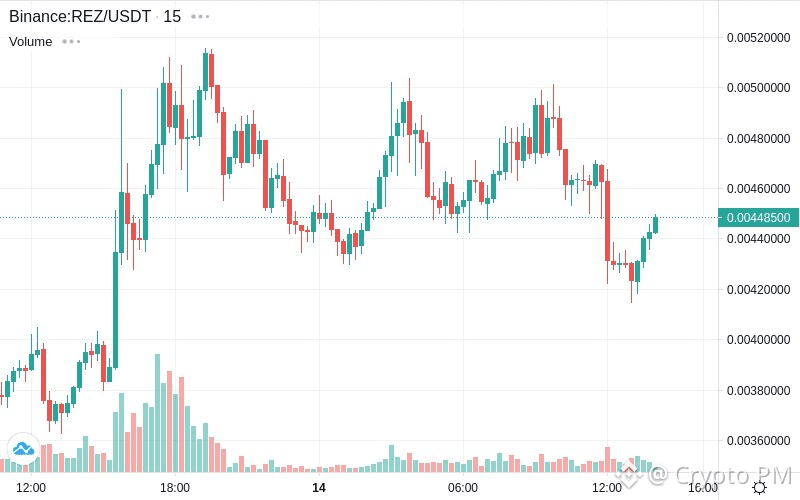
The price moved from $0.00418 to $0.00448, recording a +7.30% gain.
Trading volume surged to $40.15M, up 6.12%, with an additional $2.31M in volume - showing strong market activity alongside the price recovery.
The 15m chart shows a sharp rebound from the $0.0042 area after the recent sell-off. Buyers have pushed price back above $0.0044, but the bigger test is around the $0.0046–$0.0048 resistance zone.
If $REZ can reclaim that area with sustained volume, $0.0050–$0.0052 could become the next area of interest.
$REZ is showing a strong short-term recovery.
But let's be realistic: the chart is still inside a broader range, so this isn't a confirmed breakout yet.
A clean reclaim of $0.0048 would make the bullish case much stronger.
$REZ is showing strong bullish momentum.
The price moved from $0.00418 to $0.00448, recording a +7.30% gain.
Trading volume surged to $40.15M, up 6.12%, with an additional $2.31M in volume - showing strong market activity alongside the price recovery.
The 15m chart shows a sharp rebound from the $0.0042 area after the recent sell-off. Buyers have pushed price back above $0.0044, but the bigger test is around the $0.0046–$0.0048 resistance zone.
If $REZ can reclaim that area with sustained volume, $0.0050–$0.0052 could become the next area of interest.
$REZ is showing a strong short-term recovery.
But let's be realistic: the chart is still inside a broader range, so this isn't a confirmed breakout yet.
A clean reclaim of $0.0048 would make the bullish case much stronger.
The price moved from $0.00418 to $0.00448, recording a +7.30% gain.
Trading volume surged to $40.15M, up 6.12%, with an additional $2.31M in volume - showing strong market activity alongside the price recovery.
The 15m chart shows a sharp rebound from the $0.0042 area after the recent sell-off. Buyers have pushed price back above $0.0044, but the bigger test is around the $0.0046–$0.0048 resistance zone.
If $REZ can reclaim that area with sustained volume, $0.0050–$0.0052 could become the next area of interest.
$REZ is showing a strong short-term recovery.
But let's be realistic: the chart is still inside a broader range, so this isn't a confirmed breakout yet.
A clean reclaim of $0.0048 would make the bullish case much stronger.
3
573
·
--
Bullish
$牛来 is showing strong bullish momentum.
{future}(牛来USDT)
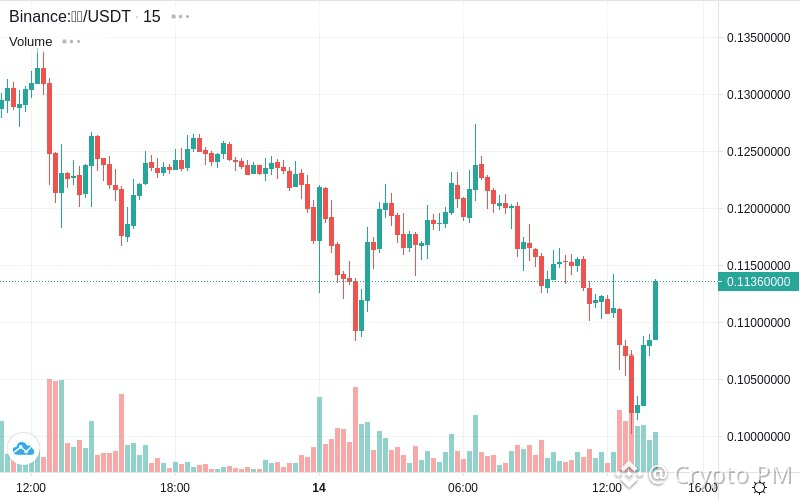
The price moved from $0.106 to $0.113, recording a +7.15% gain.
Trading volume surged to $26.80M, up 11.00%, with an additional $2.65M in volume - showing a significant increase in market activity as buyers stepped in.
The 15m chart shows a sharp rebound from the $0.103–$0.106 area after a prolonged decline.
The latest candles have pushed price back above $0.110, suggesting buyers are attempting to regain control.
If the rebound continues, $0.115 is the immediate level to watch, followed by the $0.120–$0.125 zone.
$牛来 is showing a strong short-term recovery.
The volume expansion is encouraging, but the broader chart is still recovering from a downtrend - so I'd want to see price reclaim higher resistance levels before calling it a full trend reversal.
$牛来 is showing strong bullish momentum.
The price moved from $0.106 to $0.113, recording a +7.15% gain.
Trading volume surged to $26.80M, up 11.00%, with an additional $2.65M in volume - showing a significant increase in market activity as buyers stepped in.
The 15m chart shows a sharp rebound from the $0.103–$0.106 area after a prolonged decline.
The latest candles have pushed price back above $0.110, suggesting buyers are attempting to regain control.
If the rebound continues, $0.115 is the immediate level to watch, followed by the $0.120–$0.125 zone.
$牛来 is showing a strong short-term recovery.
The volume expansion is encouraging, but the broader chart is still recovering from a downtrend - so I'd want to see price reclaim higher resistance levels before calling it a full trend reversal.
The price moved from $0.106 to $0.113, recording a +7.15% gain.
Trading volume surged to $26.80M, up 11.00%, with an additional $2.65M in volume - showing a significant increase in market activity as buyers stepped in.
The 15m chart shows a sharp rebound from the $0.103–$0.106 area after a prolonged decline.
The latest candles have pushed price back above $0.110, suggesting buyers are attempting to regain control.
If the rebound continues, $0.115 is the immediate level to watch, followed by the $0.120–$0.125 zone.
$牛来 is showing a strong short-term recovery.
The volume expansion is encouraging, but the broader chart is still recovering from a downtrend - so I'd want to see price reclaim higher resistance levels before calling it a full trend reversal.
3
809
·
--
Bullish
$KAVA is showing strong bullish momentum.
{future}(KAVAUSDT)
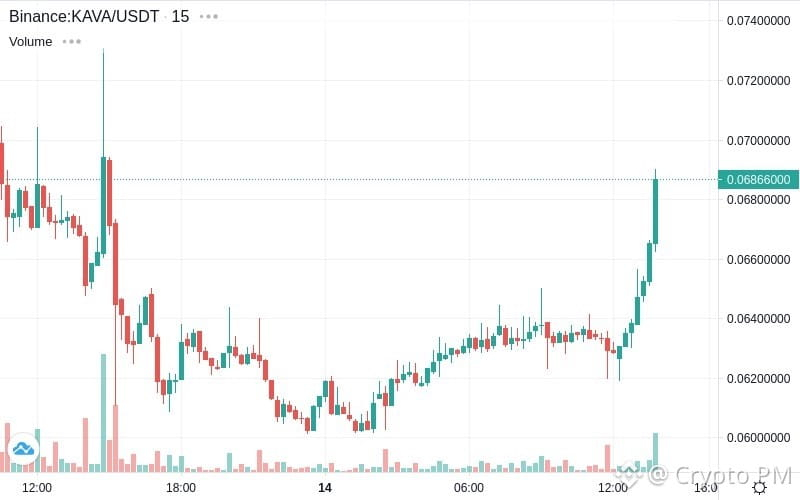
The price moved from $0.0636 to $0.0687, recording a +7.95% gain.
Trading volume increased to $3.93M, up 9.45%, with an additional $339.91K in volume - showing stronger market participation alongside the price expansion.
The 15m chart shows a clean recovery from the $0.060–$0.062 area, followed by a steady series of higher highs and higher lows. The latest move has broken above the $0.064–$0.065 consolidation zone with a strong bullish candle.
If buyers can hold above $0.068, the $0.070–$0.074 zone could be the next area of interest.
$KAVA is gaining momentum again. The structure is bullish, but the latest candle is aggressive, so a retest of the breakout zone is possible before continuation. Avoid blindly chasing the move.
$KAVA is showing strong bullish momentum.
The price moved from $0.0636 to $0.0687, recording a +7.95% gain.
Trading volume increased to $3.93M, up 9.45%, with an additional $339.91K in volume - showing stronger market participation alongside the price expansion.
The 15m chart shows a clean recovery from the $0.060–$0.062 area, followed by a steady series of higher highs and higher lows. The latest move has broken above the $0.064–$0.065 consolidation zone with a strong bullish candle.
If buyers can hold above $0.068, the $0.070–$0.074 zone could be the next area of interest.
$KAVA is gaining momentum again. The structure is bullish, but the latest candle is aggressive, so a retest of the breakout zone is possible before continuation. Avoid blindly chasing the move.
The price moved from $0.0636 to $0.0687, recording a +7.95% gain.
Trading volume increased to $3.93M, up 9.45%, with an additional $339.91K in volume - showing stronger market participation alongside the price expansion.
The 15m chart shows a clean recovery from the $0.060–$0.062 area, followed by a steady series of higher highs and higher lows. The latest move has broken above the $0.064–$0.065 consolidation zone with a strong bullish candle.
If buyers can hold above $0.068, the $0.070–$0.074 zone could be the next area of interest.
$KAVA is gaining momentum again. The structure is bullish, but the latest candle is aggressive, so a retest of the breakout zone is possible before continuation. Avoid blindly chasing the move.
3
1.3k
·
--
Bullish
$RONIN is showing strong bullish momentum.
{future}(RONINUSDT)
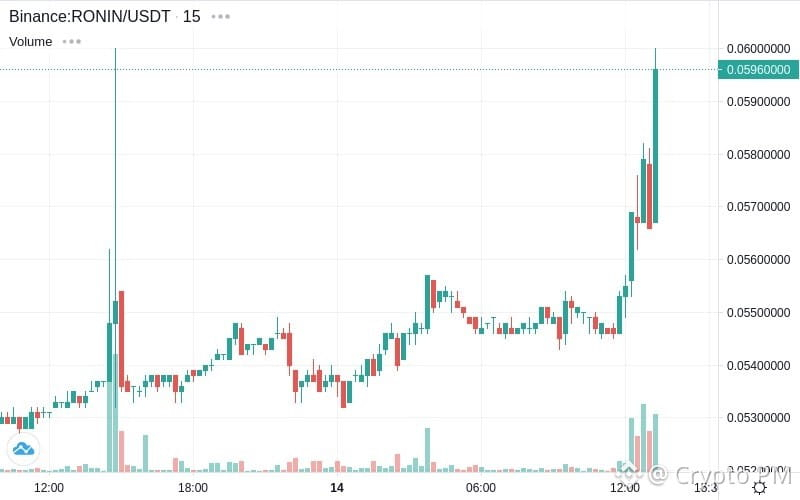
The price moved from $0.0555 to $0.0598, recording a +7.75% gain.
Trading volume surged to $1.38M, up 44.06%, with an additional $423.66K in volume - a strong increase in market activity accompanying the price breakout.
The 15m chart shows $RONIN breaking out from the $0.054–$0.055 consolidation zone, followed by a sharp push toward the $0.060 psychological resistance with strong volume.
If buyers can break and hold above $0.060, the $0.062–$0.065 zone could become the next area of interest.
$RONIN is showing a clear momentum shift. The volume expansion makes the move more convincing, but after such a sharp breakout, a retest around $0.058–$0.060 is possible. Don't blindly chase the spike.
$RONIN is showing strong bullish momentum.
The price moved from $0.0555 to $0.0598, recording a +7.75% gain.
Trading volume surged to $1.38M, up 44.06%, with an additional $423.66K in volume - a strong increase in market activity accompanying the price breakout.
The 15m chart shows $RONIN breaking out from the $0.054–$0.055 consolidation zone, followed by a sharp push toward the $0.060 psychological resistance with strong volume.
If buyers can break and hold above $0.060, the $0.062–$0.065 zone could become the next area of interest.
$RONIN is showing a clear momentum shift. The volume expansion makes the move more convincing, but after such a sharp breakout, a retest around $0.058–$0.060 is possible. Don't blindly chase the spike.
The price moved from $0.0555 to $0.0598, recording a +7.75% gain.
Trading volume surged to $1.38M, up 44.06%, with an additional $423.66K in volume - a strong increase in market activity accompanying the price breakout.
The 15m chart shows $RONIN breaking out from the $0.054–$0.055 consolidation zone, followed by a sharp push toward the $0.060 psychological resistance with strong volume.
If buyers can break and hold above $0.060, the $0.062–$0.065 zone could become the next area of interest.
$RONIN is showing a clear momentum shift. The volume expansion makes the move more convincing, but after such a sharp breakout, a retest around $0.058–$0.060 is possible. Don't blindly chase the spike.
4
593
·
--
Bullish
$LA is showing strong bullish momentum.
{future}(LAUSDT)
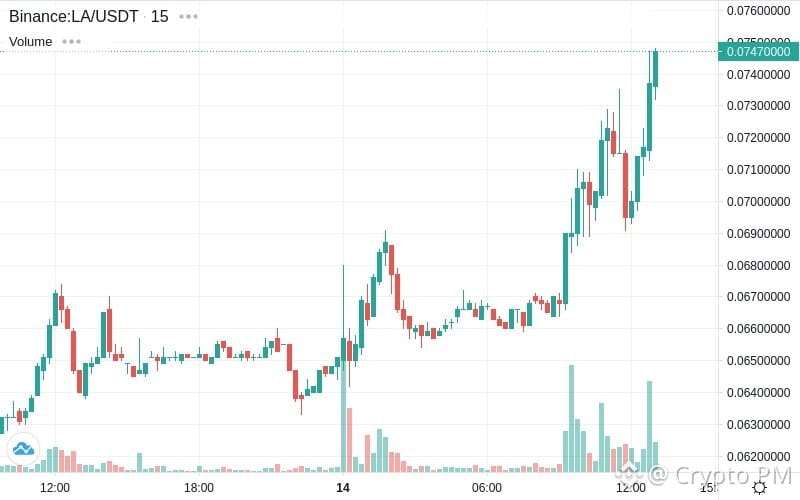
The price moved from $0.0698 to $0.0747, recording a +7.02% gain.
Trading volume increased to $4.21M, up 15.23%, with an additional $557.45K in volume - showing stronger market participation as buyers continue stepping in.
The 15m chart shows a clear breakout from the $0.066–$0.068 consolidation range, followed by a strong series of higher highs and higher lows. The latest move has pushed $LA toward the $0.075 psychological resistance.
If buyers can reclaim and hold above $0.075, the $0.077–$0.080 zone could be the next area of interest.
$LA is gaining momentum and looks interesting here. However, the move has already accelerated significantly, so a retest of the breakout zone is possible. Don't blindly chase the pump.
$LA is showing strong bullish momentum.
The price moved from $0.0698 to $0.0747, recording a +7.02% gain.
Trading volume increased to $4.21M, up 15.23%, with an additional $557.45K in volume - showing stronger market participation as buyers continue stepping in.
The 15m chart shows a clear breakout from the $0.066–$0.068 consolidation range, followed by a strong series of higher highs and higher lows. The latest move has pushed $LA toward the $0.075 psychological resistance.
If buyers can reclaim and hold above $0.075, the $0.077–$0.080 zone could be the next area of interest.
$LA is gaining momentum and looks interesting here. However, the move has already accelerated significantly, so a retest of the breakout zone is possible. Don't blindly chase the pump.
The price moved from $0.0698 to $0.0747, recording a +7.02% gain.
Trading volume increased to $4.21M, up 15.23%, with an additional $557.45K in volume - showing stronger market participation as buyers continue stepping in.
The 15m chart shows a clear breakout from the $0.066–$0.068 consolidation range, followed by a strong series of higher highs and higher lows. The latest move has pushed $LA toward the $0.075 psychological resistance.
If buyers can reclaim and hold above $0.075, the $0.077–$0.080 zone could be the next area of interest.
$LA is gaining momentum and looks interesting here. However, the move has already accelerated significantly, so a retest of the breakout zone is possible. Don't blindly chase the pump.
3
532
·
--
Bullish
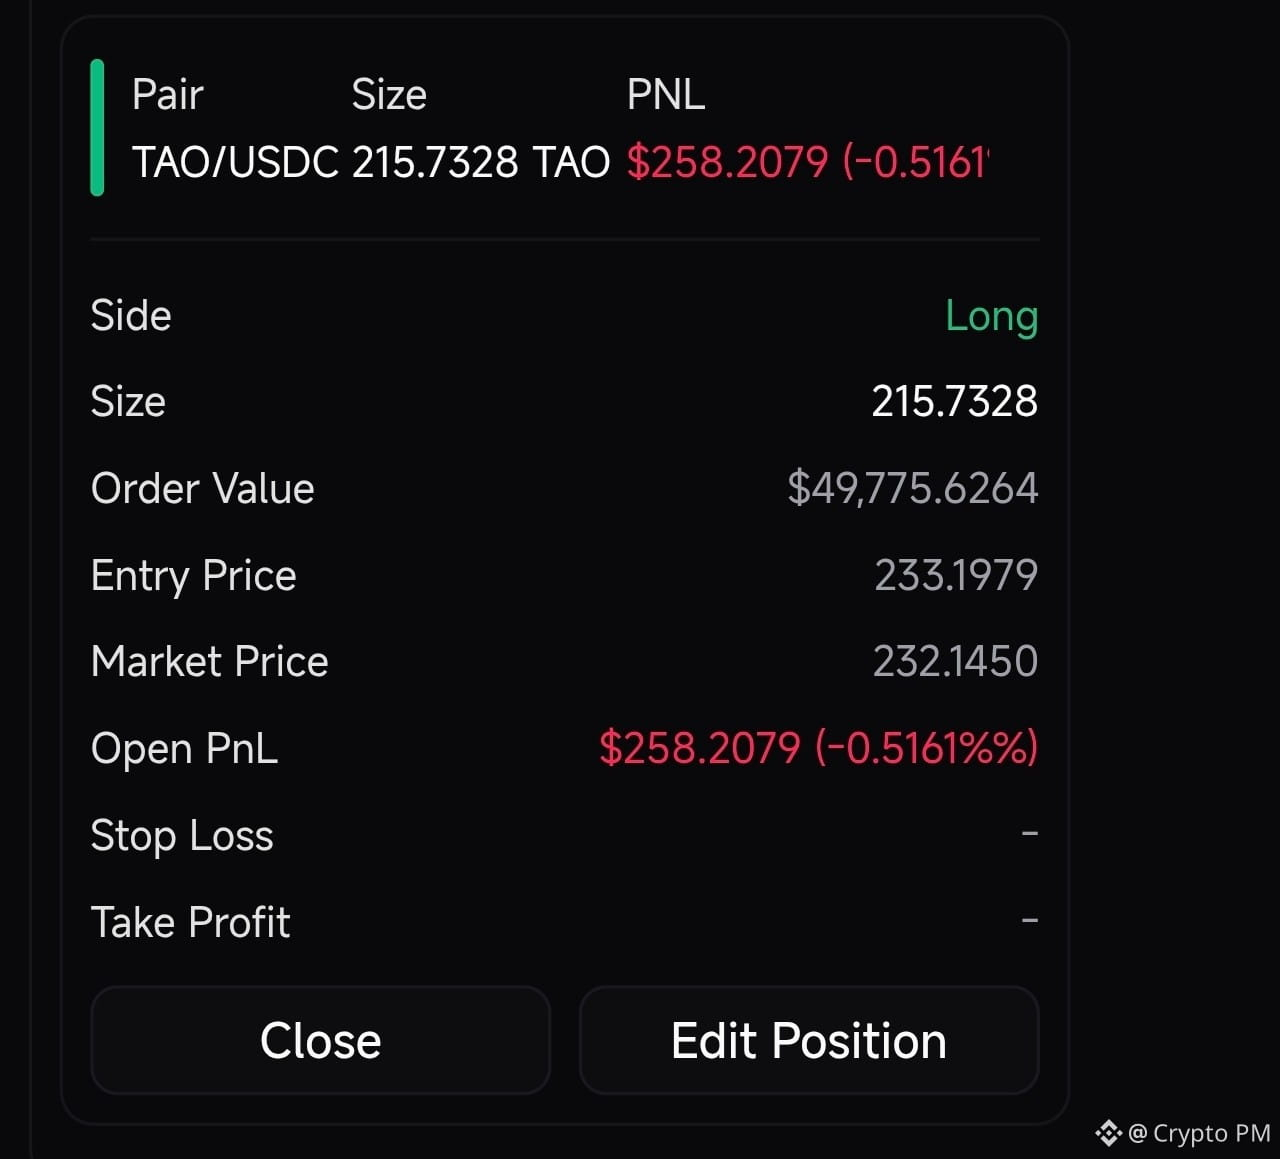
I just went long on $TAO
{future}(TAOUSDT)
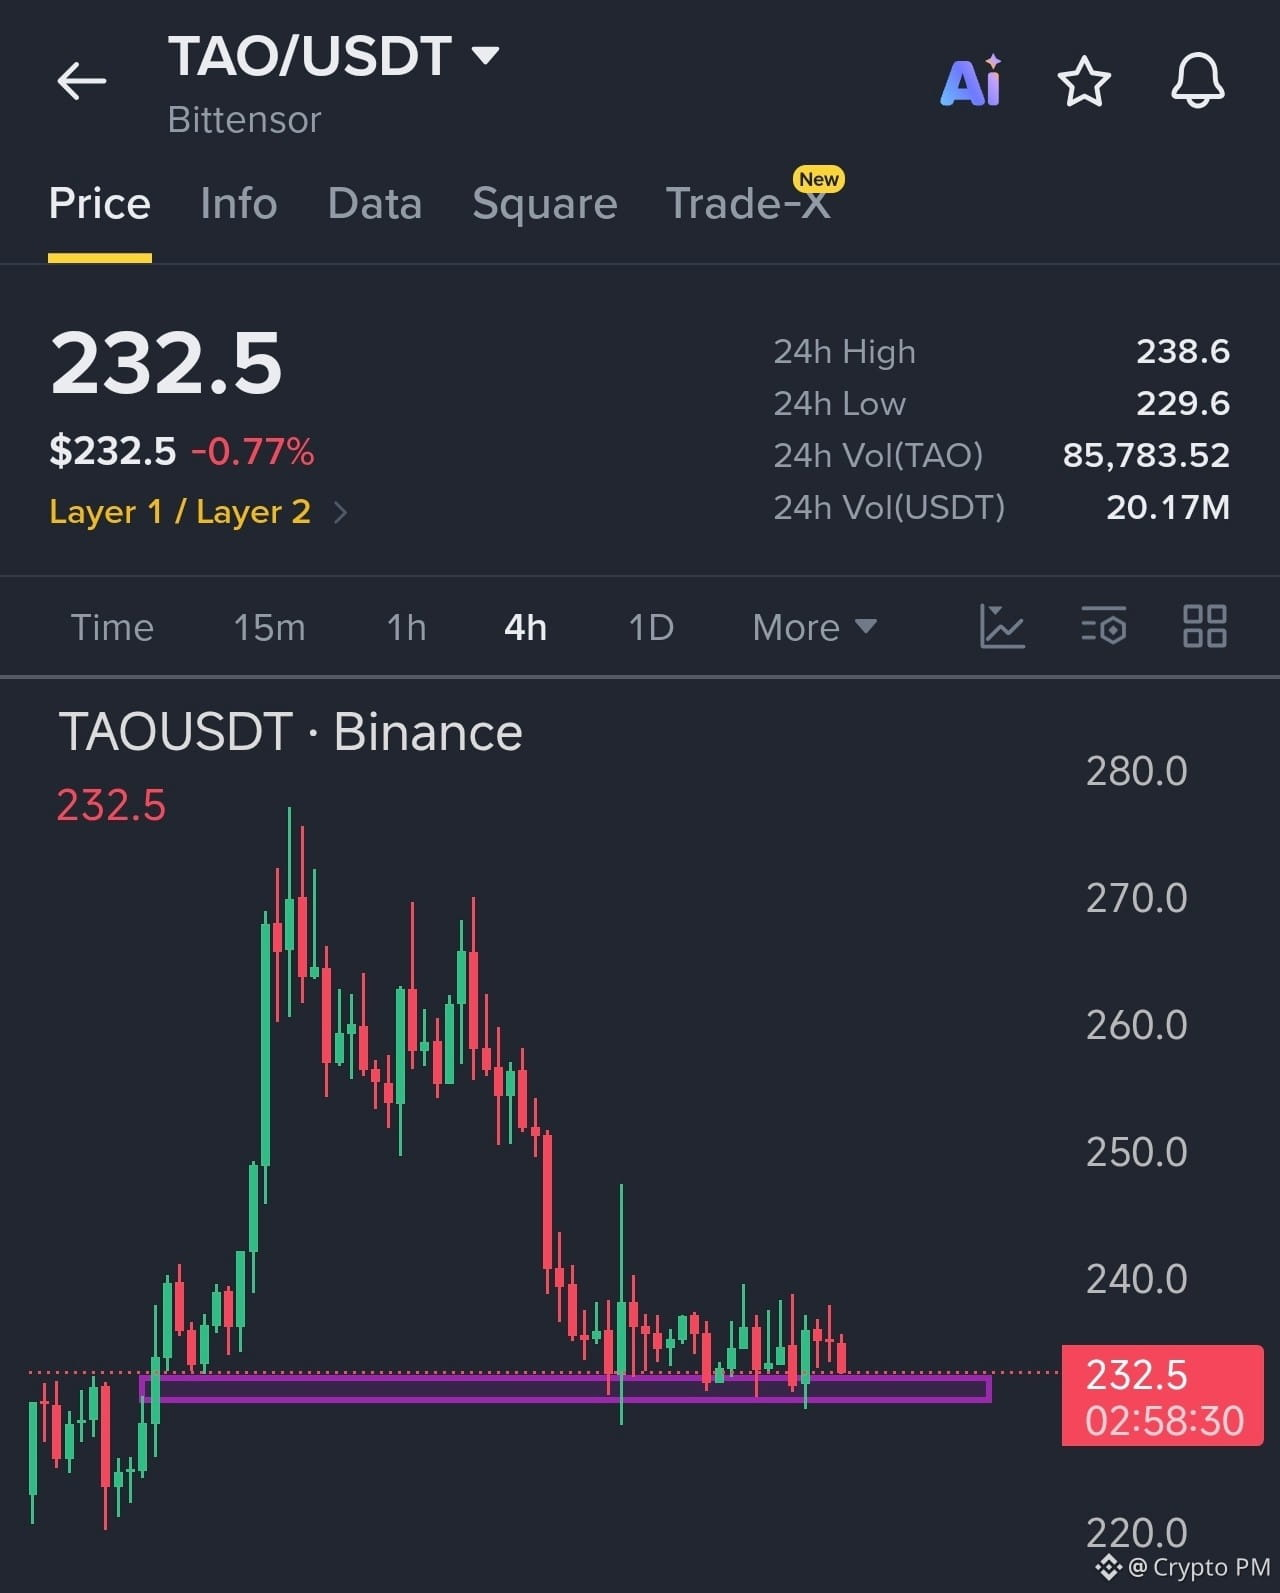
Currently sitting on a key 4H support zone around $230–$233, which has been acting as a demand area on the chart.
The recent price action shows repeated reactions from this zone, while sellers have struggled to push decisively below it.
My thesis is simple: if this 4H support holds, I expect a relief bounce from here.
🎯 Entry: ~$233.20
🟢 Bias: Long
📍 Key support: $230–$233
🎯 Upside: $240 → $250+
The setup is invalid if this support breaks with strong 4H confirmation. I’m not interested in blindly holding a losing thesis just because I entered the trade.
Let's see if the support does its job. 👀
I just went long on $TAO
Currently sitting on a key 4H support zone around $230–$233, which has been acting as a demand area on the chart.
The recent price action shows repeated reactions from this zone, while sellers have struggled to push decisively below it.
My thesis is simple: if this 4H support holds, I expect a relief bounce from here.
🎯 Entry: ~$233.20
🟢 Bias: Long
📍 Key support: $230–$233
🎯 Upside: $240 → $250+
The setup is invalid if this support breaks with strong 4H confirmation. I’m not interested in blindly holding a losing thesis just because I entered the trade.
Let's see if the support does its job. 👀
Currently sitting on a key 4H support zone around $230–$233, which has been acting as a demand area on the chart.
The recent price action shows repeated reactions from this zone, while sellers have struggled to push decisively below it.
My thesis is simple: if this 4H support holds, I expect a relief bounce from here.
🎯 Entry: ~$233.20
🟢 Bias: Long
📍 Key support: $230–$233
🎯 Upside: $240 → $250+
The setup is invalid if this support breaks with strong 4H confirmation. I’m not interested in blindly holding a losing thesis just because I entered the trade.
Let's see if the support does its job. 👀
3
5
1.6k
·
--
Bullish
$STRAX is showing strong bullish momentum.
{spot}(STRAXUSDT)
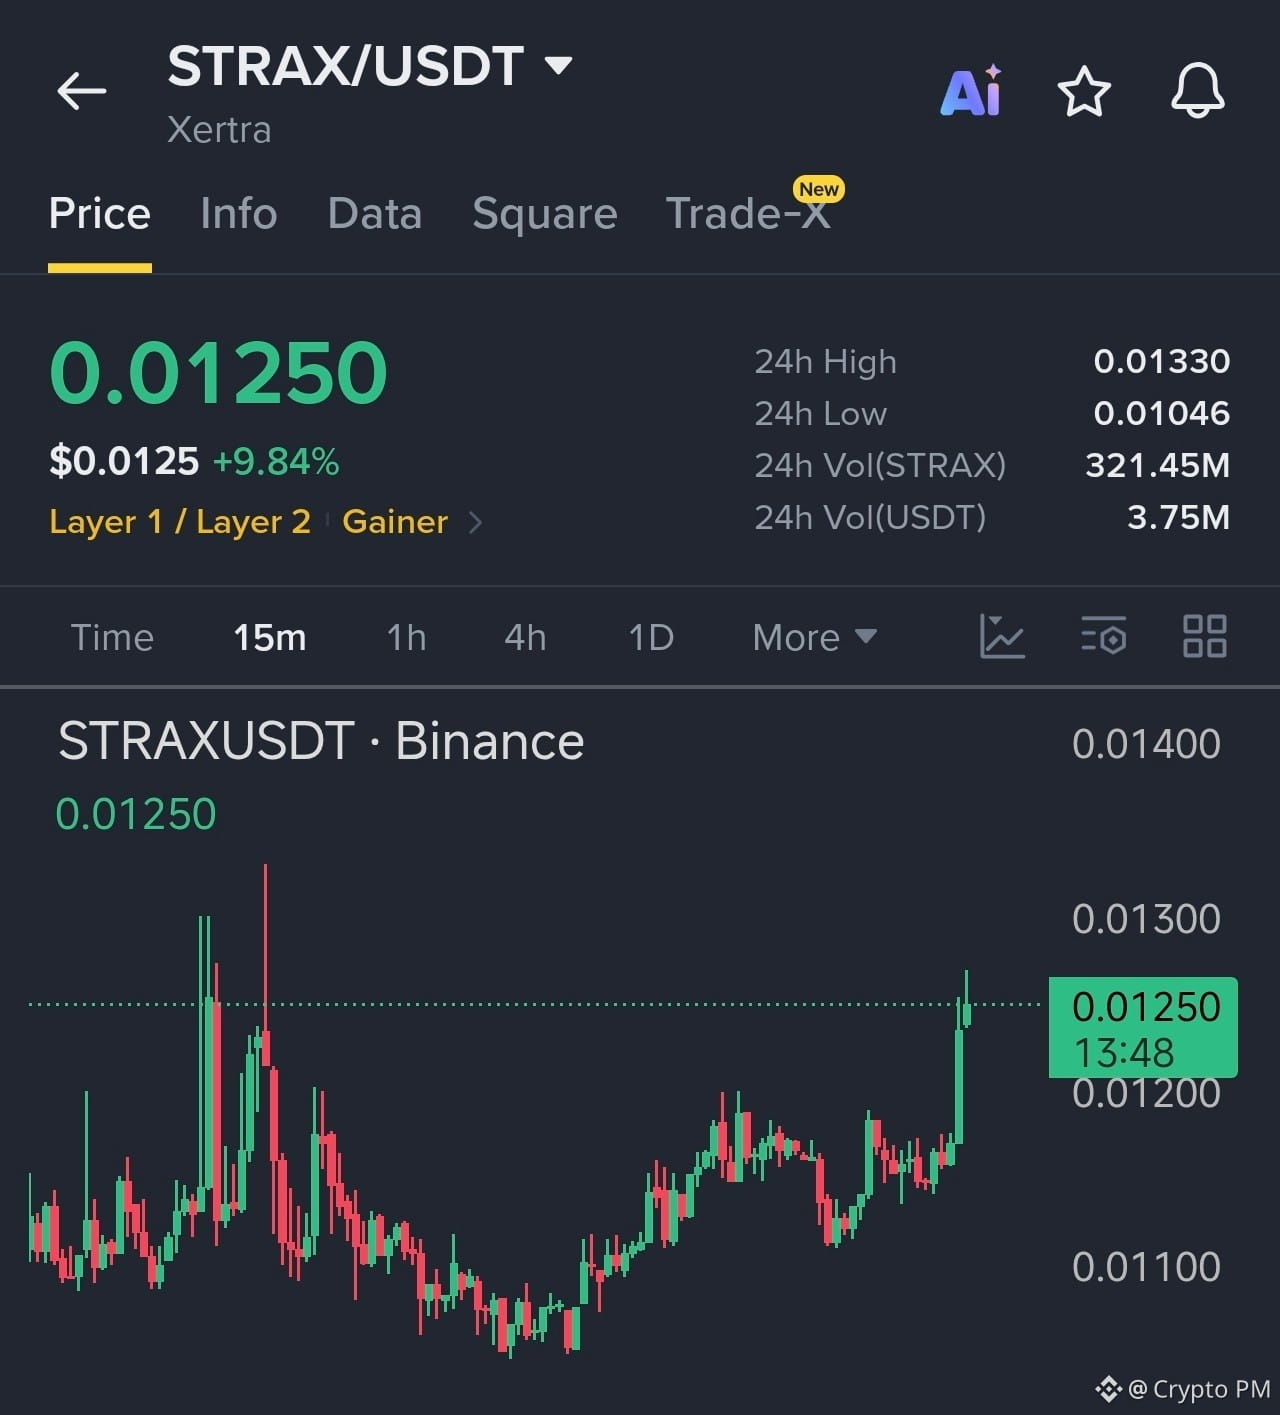
The price moved from $0.0115 to $0.0123, recording a +7.41% gain.
Trading volume increased to $3.89M, up 6.96%, with an additional $253.59K in volume - showing rising market activity as buyers step in.
The 15m chart shows $STRAX recovering from the $0.0105–$0.0110 area and gradually building higher highs and higher lows. The latest breakout above $0.012 is the key move to watch.
If buyers can hold above $0.0122–$0.0123, the $0.0125–$0.0130 zone could be the next area of interest.
$STRAX is gaining momentum. The volume increase is constructive, but it's not explosive, so I'd want to see sustained buying volume before calling this a major breakout. A rejection near the previous highs could still lead to a pullback.
$STRAX is showing strong bullish momentum.
The price moved from $0.0115 to $0.0123, recording a +7.41% gain.
Trading volume increased to $3.89M, up 6.96%, with an additional $253.59K in volume - showing rising market activity as buyers step in.
The 15m chart shows $STRAX recovering from the $0.0105–$0.0110 area and gradually building higher highs and higher lows. The latest breakout above $0.012 is the key move to watch.
If buyers can hold above $0.0122–$0.0123, the $0.0125–$0.0130 zone could be the next area of interest.
$STRAX is gaining momentum. The volume increase is constructive, but it's not explosive, so I'd want to see sustained buying volume before calling this a major breakout. A rejection near the previous highs could still lead to a pullback.
The price moved from $0.0115 to $0.0123, recording a +7.41% gain.
Trading volume increased to $3.89M, up 6.96%, with an additional $253.59K in volume - showing rising market activity as buyers step in.
The 15m chart shows $STRAX recovering from the $0.0105–$0.0110 area and gradually building higher highs and higher lows. The latest breakout above $0.012 is the key move to watch.
If buyers can hold above $0.0122–$0.0123, the $0.0125–$0.0130 zone could be the next area of interest.
$STRAX is gaining momentum. The volume increase is constructive, but it's not explosive, so I'd want to see sustained buying volume before calling this a major breakout. A rejection near the previous highs could still lead to a pullback.
7
530
·
--
Bearish
Even 100th times loss in a row doesn't feel real in $BTC 😂
Even 100th times loss in a row doesn't feel real in $BTC 😂

2
20
7.3k
·
--
Bullish
$QKC is showing strong bullish momentum with whale activity.
{spot}(QKCUSDT)
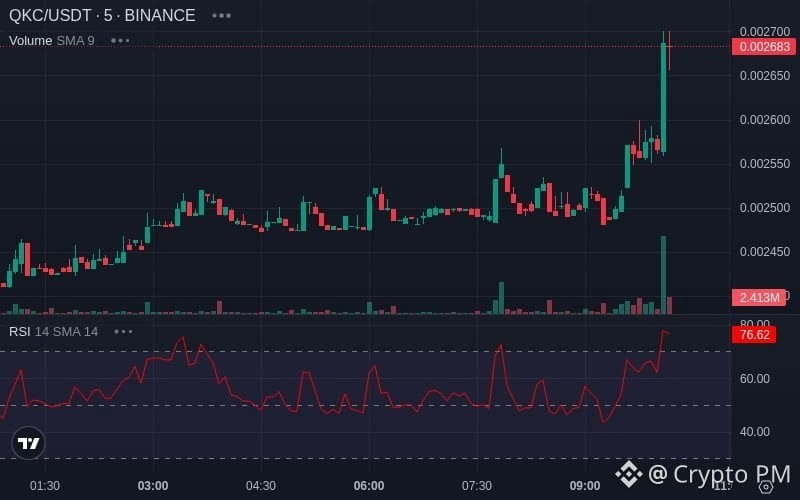
A large buy of 6.63M QKC was executed around $0.00270, with an order size of $17.74K completed within just 9 minutes.
The 5m chart shows a sharp breakout from the $0.00250–$0.00260 consolidation range, backed by a significant volume spike.
📊 24H Volume: $345.52K
🚨 Buy Order: $17.74K
⏱️ Duration: 9 minutes
📈 Price: $0.00270 (+5.43%)
Momentum is clearly strong, but there’s one thing to watch: RSI is around 76.6, meaning the short-term move is already overbought.
If buyers can hold above $0.00265–$0.00270, continuation toward $0.00280–$0.00300 could come into focus.
$QKC is one to watch here. Strong buying + volume expansion is bullish, but chasing an already extended move carries higher risk. A breakout retest would be much cleaner than blindly entering the spike.
$QKC is showing strong bullish momentum with whale activity.
A large buy of 6.63M QKC was executed around $0.00270, with an order size of $17.74K completed within just 9 minutes.
The 5m chart shows a sharp breakout from the $0.00250–$0.00260 consolidation range, backed by a significant volume spike.
📊 24H Volume: $345.52K
🚨 Buy Order: $17.74K
⏱️ Duration: 9 minutes
📈 Price: $0.00270 (+5.43%)
Momentum is clearly strong, but there’s one thing to watch: RSI is around 76.6, meaning the short-term move is already overbought.
If buyers can hold above $0.00265–$0.00270, continuation toward $0.00280–$0.00300 could come into focus.
$QKC is one to watch here. Strong buying + volume expansion is bullish, but chasing an already extended move carries higher risk. A breakout retest would be much cleaner than blindly entering the spike.
A large buy of 6.63M QKC was executed around $0.00270, with an order size of $17.74K completed within just 9 minutes.
The 5m chart shows a sharp breakout from the $0.00250–$0.00260 consolidation range, backed by a significant volume spike.
📊 24H Volume: $345.52K
🚨 Buy Order: $17.74K
⏱️ Duration: 9 minutes
📈 Price: $0.00270 (+5.43%)
Momentum is clearly strong, but there’s one thing to watch: RSI is around 76.6, meaning the short-term move is already overbought.
If buyers can hold above $0.00265–$0.00270, continuation toward $0.00280–$0.00300 could come into focus.
$QKC is one to watch here. Strong buying + volume expansion is bullish, but chasing an already extended move carries higher risk. A breakout retest would be much cleaner than blindly entering the spike.
4
1k
·
--
Bullish
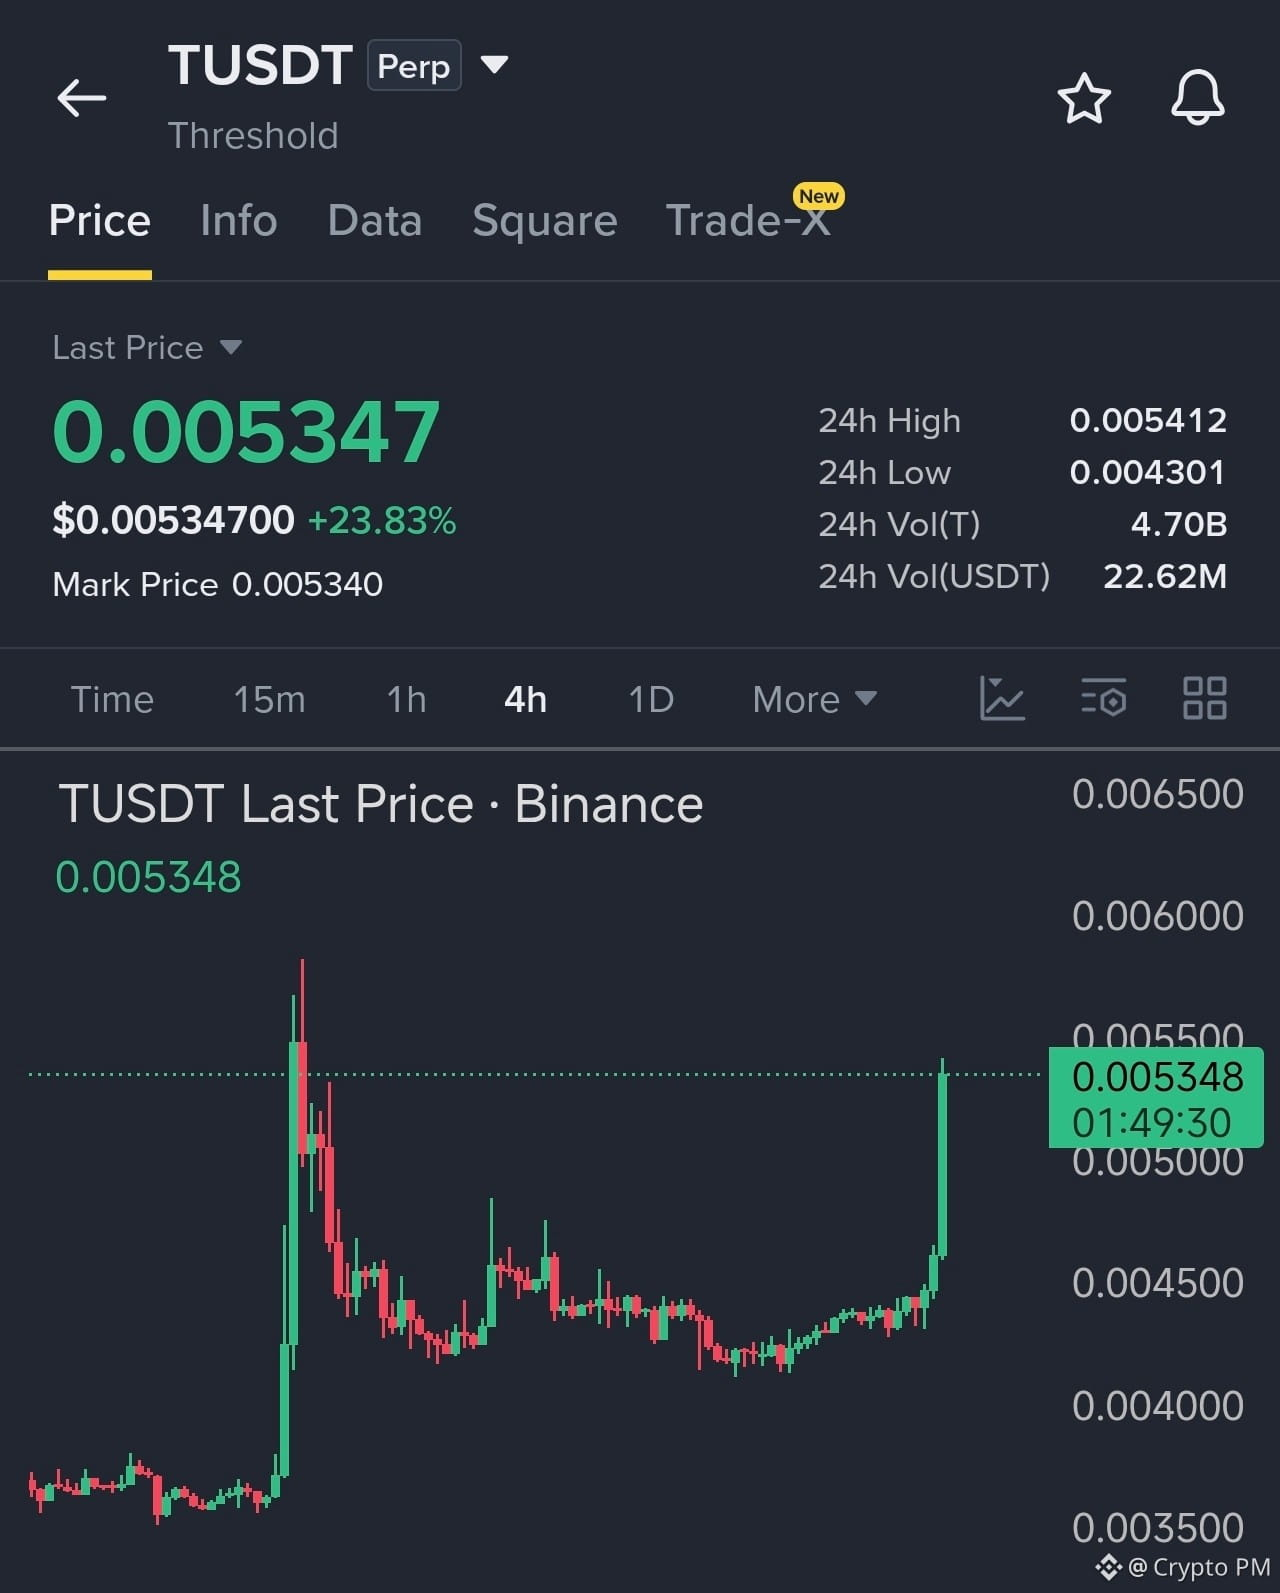
$T is showing strong bullish momentum.
The price moved from $0.00471 to $0.00505, recording a +7.22% gain.
Trading volume surged to $1.85M, up a massive 86.60%, with an additional $862.75K in volume - a significant increase in market activity and buyer participation.
The 4H chart shows a strong breakout from the $0.0042–$0.0045 consolidation range, with the latest candle pushing sharply toward the previous $0.0054–$0.0055 resistance area.
If buyers can hold the breakout, a reclaim of $0.0055 could open the way toward $0.0058–$0.0060.
$T is showing a notable momentum shift. The volume expansion is the key factor here, but the move is already aggressive, so a retest or pullback is possible before continuation. Avoid blindly chasing the pump.
$T is showing strong bullish momentum.
The price moved from $0.00471 to $0.00505, recording a +7.22% gain.
Trading volume surged to $1.85M, up a massive 86.60%, with an additional $862.75K in volume - a significant increase in market activity and buyer participation.
The 4H chart shows a strong breakout from the $0.0042–$0.0045 consolidation range, with the latest candle pushing sharply toward the previous $0.0054–$0.0055 resistance area.
If buyers can hold the breakout, a reclaim of $0.0055 could open the way toward $0.0058–$0.0060.
$T is showing a notable momentum shift. The volume expansion is the key factor here, but the move is already aggressive, so a retest or pullback is possible before continuation. Avoid blindly chasing the pump.
The price moved from $0.00471 to $0.00505, recording a +7.22% gain.
Trading volume surged to $1.85M, up a massive 86.60%, with an additional $862.75K in volume - a significant increase in market activity and buyer participation.
The 4H chart shows a strong breakout from the $0.0042–$0.0045 consolidation range, with the latest candle pushing sharply toward the previous $0.0054–$0.0055 resistance area.
If buyers can hold the breakout, a reclaim of $0.0055 could open the way toward $0.0058–$0.0060.
$T is showing a notable momentum shift. The volume expansion is the key factor here, but the move is already aggressive, so a retest or pullback is possible before continuation. Avoid blindly chasing the pump.
5
11
5.4k
·
--
Bullish
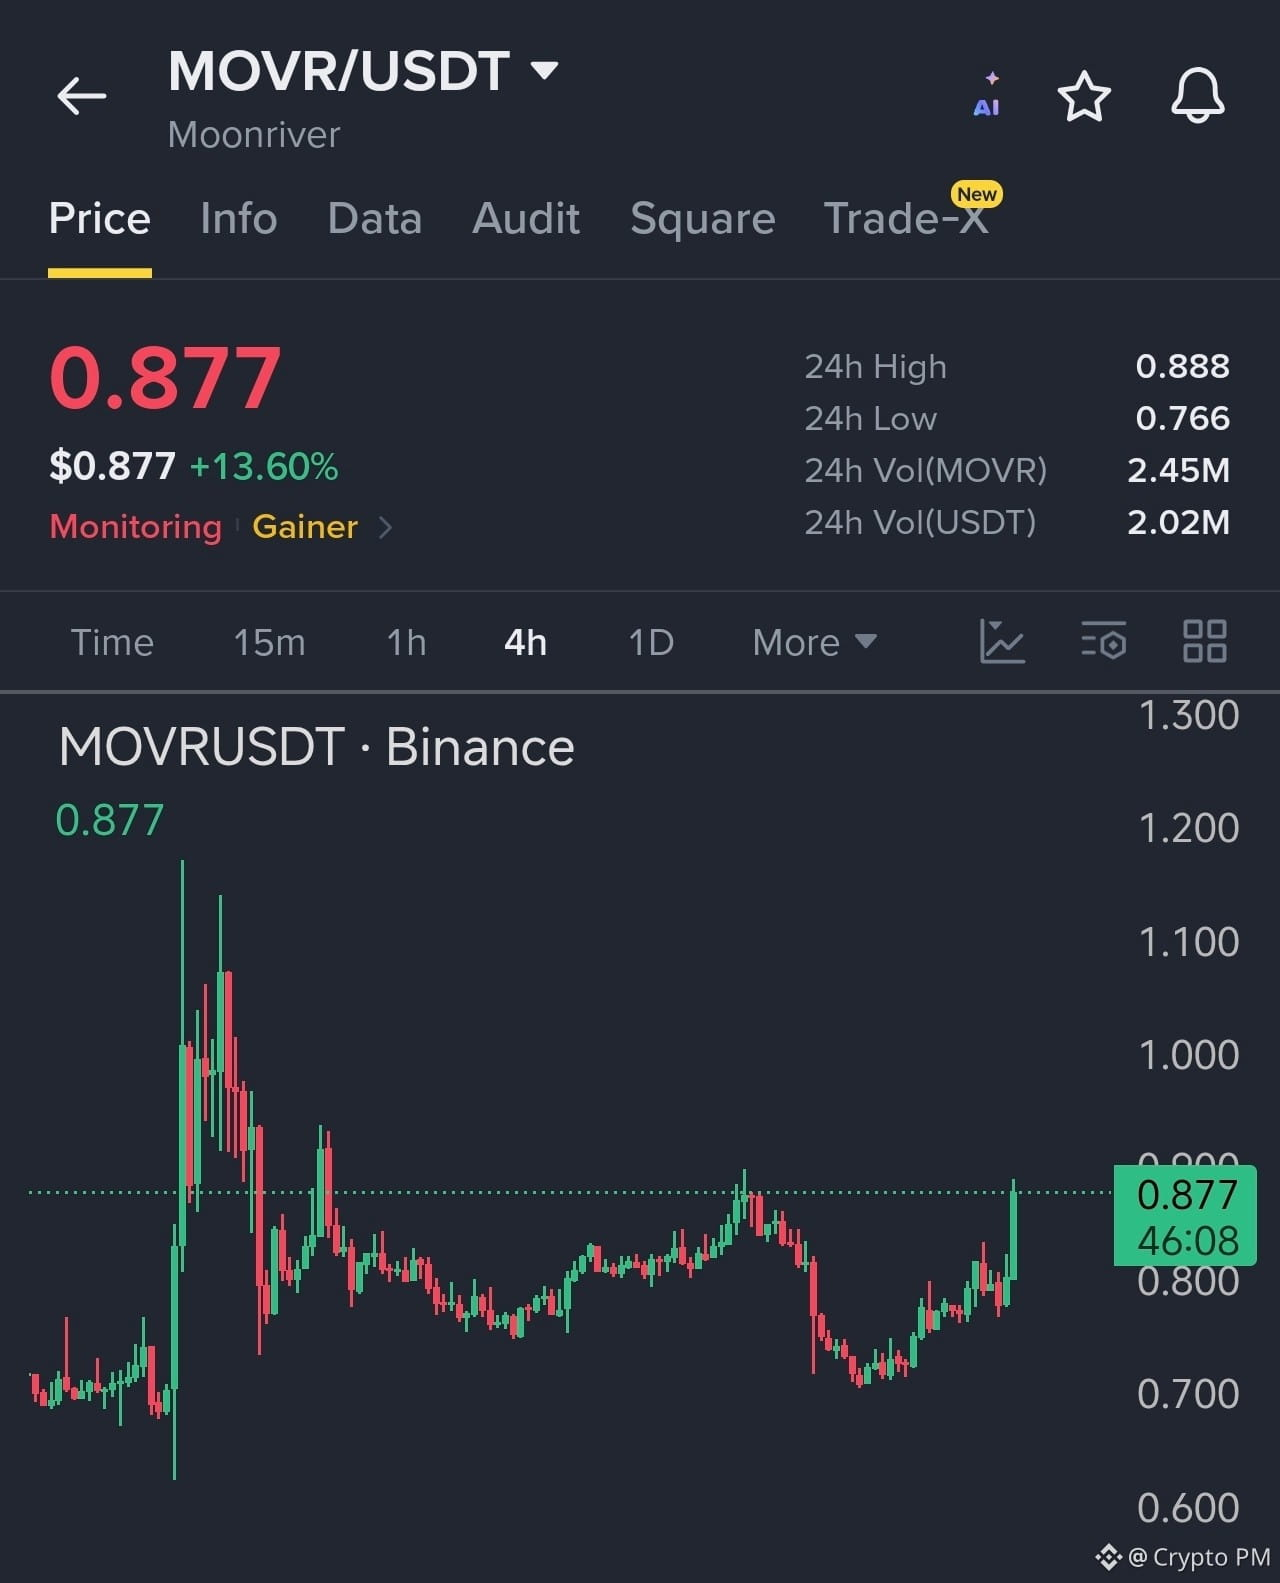
$MOVR is showing strong bullish momentum.
{future}(MOVRUSDT)
The price moved from $0.817 to $0.876, recording a +7.22% gain.
Trading volume surged to $2.01M, up a massive 46.45%, with an additional $639.28K in volume - a strong indication that market participation is increasing alongside the price move.
The 4H chart shows a clear recovery from the $0.70–$0.72 area, followed by a series of higher lows. The latest candle has pushed through the $0.85–$0.87 region with strong momentum.
If buyers can hold above $0.87, the $0.90–$0.95 zone could be the next area of interest.
$MOVR is showing a meaningful momentum shift. But with price approaching the previous resistance around $0.88–$0.90, a rejection or retest is possible. Don't blindly chase the move.
$MOVR is showing strong bullish momentum.
The price moved from $0.817 to $0.876, recording a +7.22% gain.
Trading volume surged to $2.01M, up a massive 46.45%, with an additional $639.28K in volume - a strong indication that market participation is increasing alongside the price move.
The 4H chart shows a clear recovery from the $0.70–$0.72 area, followed by a series of higher lows. The latest candle has pushed through the $0.85–$0.87 region with strong momentum.
If buyers can hold above $0.87, the $0.90–$0.95 zone could be the next area of interest.
$MOVR is showing a meaningful momentum shift. But with price approaching the previous resistance around $0.88–$0.90, a rejection or retest is possible. Don't blindly chase the move.
The price moved from $0.817 to $0.876, recording a +7.22% gain.
Trading volume surged to $2.01M, up a massive 46.45%, with an additional $639.28K in volume - a strong indication that market participation is increasing alongside the price move.
The 4H chart shows a clear recovery from the $0.70–$0.72 area, followed by a series of higher lows. The latest candle has pushed through the $0.85–$0.87 region with strong momentum.
If buyers can hold above $0.87, the $0.90–$0.95 zone could be the next area of interest.
$MOVR is showing a meaningful momentum shift. But with price approaching the previous resistance around $0.88–$0.90, a rejection or retest is possible. Don't blindly chase the move.
1
942
·
--
Bullish
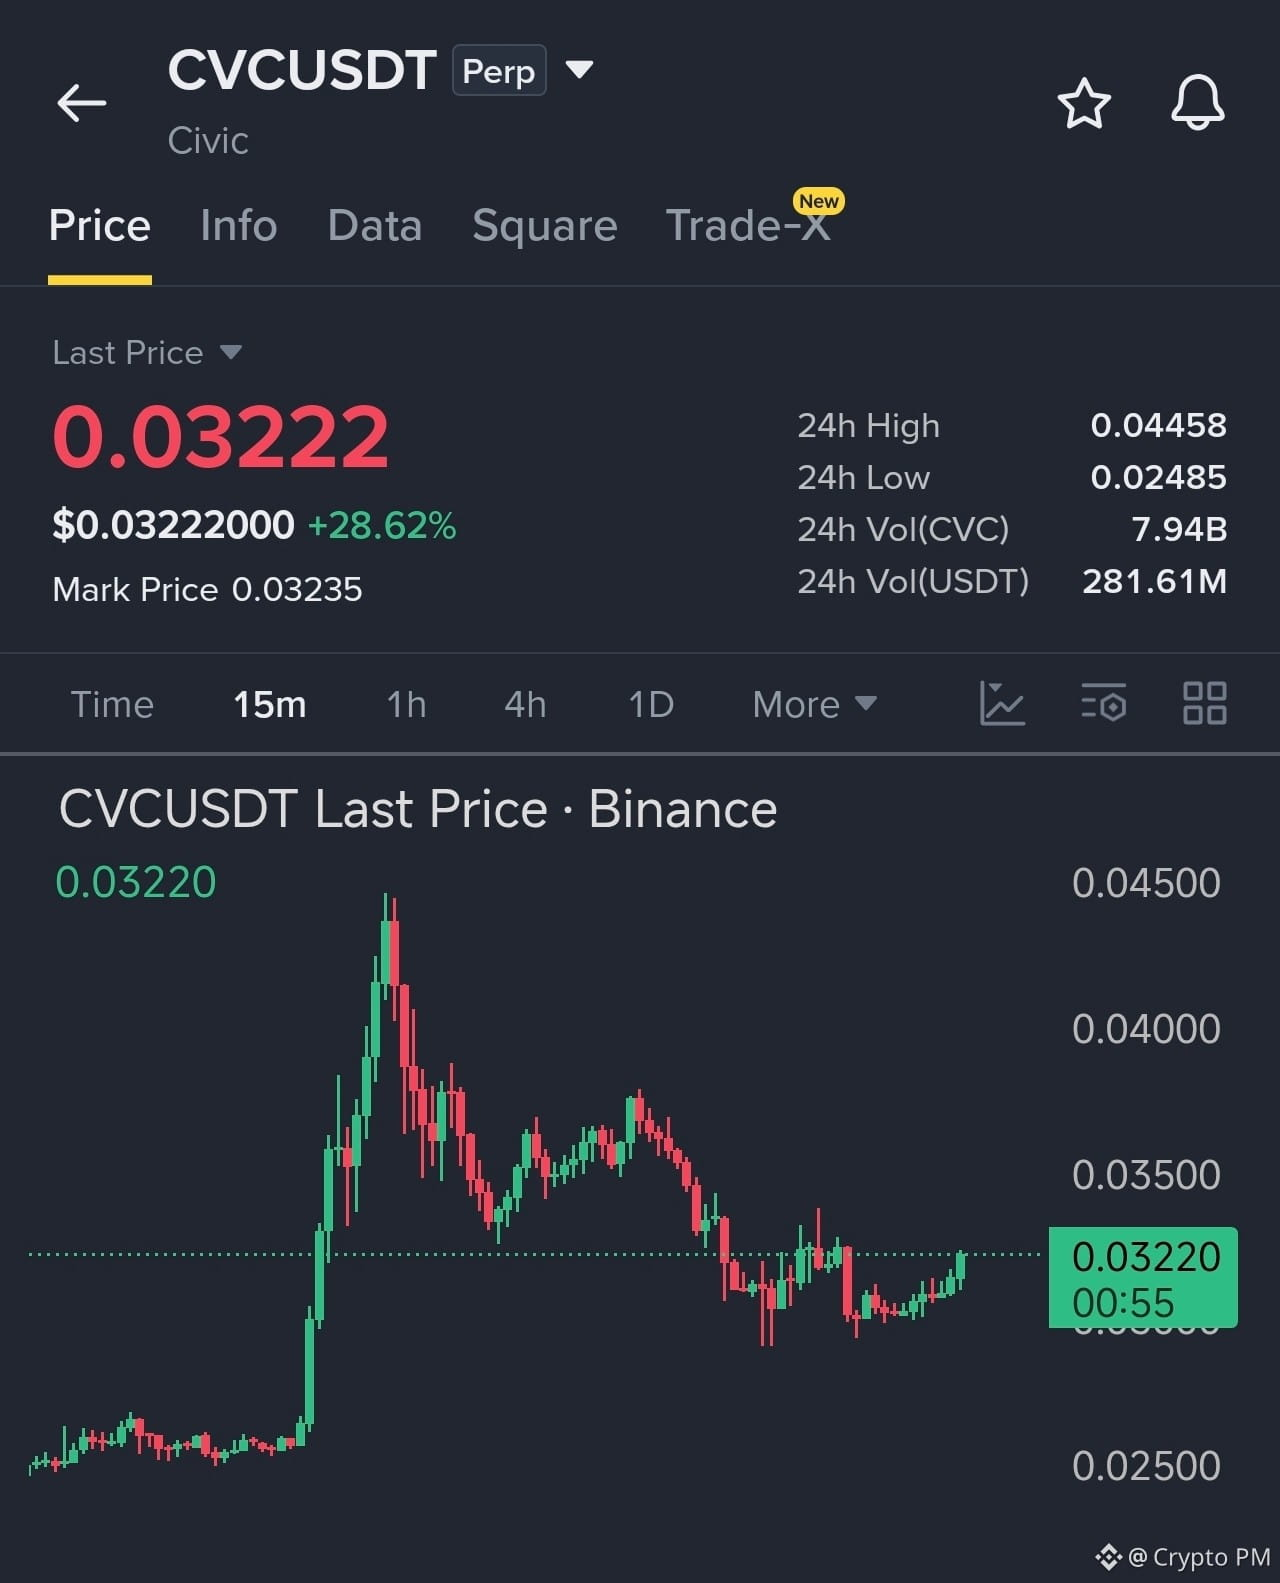
$CVC is showing strong bullish momentum.
{future}(CVCUSDT)
The price moved from $0.0306 to $0.0328, recording a +7.15% gain.
Trading volume surged to $20.37M, up 8.59%, with an additional $1.61M in volume - showing a clear increase in market activity alongside the price move.
The 15m chart shows $CVC recovering from the $0.030 area and building a series of higher lows. The latest candles are pushing toward the $0.033 resistance zone, with volume also picking up.
If buyers manage to break and hold above $0.033, the $0.035–$0.037 zone could become the next area of interest.
$CVC is showing a potential momentum shift. But this isn't a confirmed reversal yet - sustained buying volume and a clean breakout are needed. A rejection around resistance could still trigger a pullback.
$CVC is showing strong bullish momentum.
The price moved from $0.0306 to $0.0328, recording a +7.15% gain.
Trading volume surged to $20.37M, up 8.59%, with an additional $1.61M in volume - showing a clear increase in market activity alongside the price move.
The 15m chart shows $CVC recovering from the $0.030 area and building a series of higher lows. The latest candles are pushing toward the $0.033 resistance zone, with volume also picking up.
If buyers manage to break and hold above $0.033, the $0.035–$0.037 zone could become the next area of interest.
$CVC is showing a potential momentum shift. But this isn't a confirmed reversal yet - sustained buying volume and a clean breakout are needed. A rejection around resistance could still trigger a pullback.
The price moved from $0.0306 to $0.0328, recording a +7.15% gain.
Trading volume surged to $20.37M, up 8.59%, with an additional $1.61M in volume - showing a clear increase in market activity alongside the price move.
The 15m chart shows $CVC recovering from the $0.030 area and building a series of higher lows. The latest candles are pushing toward the $0.033 resistance zone, with volume also picking up.
If buyers manage to break and hold above $0.033, the $0.035–$0.037 zone could become the next area of interest.
$CVC is showing a potential momentum shift. But this isn't a confirmed reversal yet - sustained buying volume and a clean breakout are needed. A rejection around resistance could still trigger a pullback.
7
1.8k
Log in to explore more content
Join global crypto users on Binance Square
⚡️ Get latest and useful information about crypto.
💬 Trusted by the world’s largest crypto exchange.
👍 Discover real insights from verified creators.
Email / Phone number
Trending Topics
BitcoinReboundsTo$79K
18,860 views
160 Discussing
🚨 $BTC is pushing higher.
Bitcoin is trading around $78,804, up roughly 1.9%, after reclaiming the $78K area. The next level to watch is the intraday high near $78,905.
A clean break above that level could open the way toward $79K–$80K. If BTC gets rejected, support sits around $78,300, then $77,975.
Bulls have momentum, but BTC needs to hold above $78K.
#Bitcoin #BTC #CryptoTrading #CryptoMarket #CryptoAnalysis
PulseON
·17 Likes
·16.7k views
BitcoinSpotETFsNetInflow$160M
0 views
19 Discussing
SouthKoreaCryptoTaxDelayPetitionTops50000
6,779 views
184 Discussing