
During the operation of the market, there will be a series of positive or negative lines (at least 3) followed by a sudden negative or positive line in the opposite direction, which seems to stop the trend, but the subsequent trend will extend. This reverse K line is worth paying attention to, which is also the reverse drag line to be explained below.
When watching the market, everyone should like to see a strong bull market, and the market with continuous negative lines (black K-line) or positive lines (red K-line) is even more exciting. However, some investors are afraid of this strong market, worrying that the market will stop and the market will adjust as soon as they enter the market, that is, they are afraid of "chasing high" or "chasing low", but if they miss the strong market because of this, they are afraid of "throwing the baby out with the bathwater". In the market with continuous negative or positive lines, it is not clear which K-line to enter the market, but if the reverse K-line is closed, if it can be judged as a reverse drag line, you can consider entering the market.
There is no fixed corresponding K-line for the reverse drag line, that is, the reverse K-line after a series of positive or negative lines is the reverse drag line, regardless of the size of the K-line entity. The key to the reverse drag line is that the market continues after this K-line (if the market stops temporarily, it is not a reverse drag line).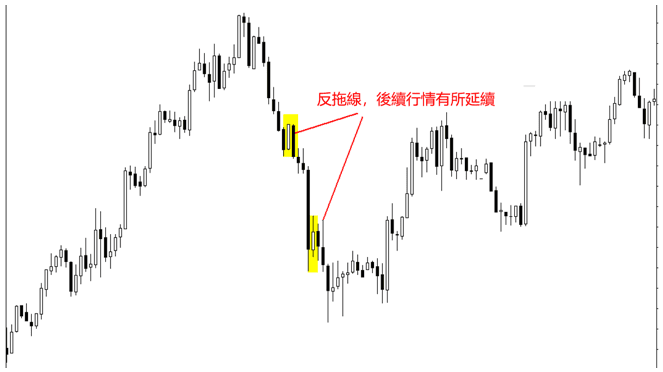
After the reverse line closes, you can consider looking for trading opportunities in the original market direction.
In fact, in a strong market with consecutive positive or negative closings, the sudden appearance of a reverse K-line is indeed worrying, especially when the reverse K-line also forms a reversal pattern. However, if the market proves that this reverse K-line is actually a reverse drag line, it will be regrettable. Therefore, for the reverse drag line, it is key to identify it.
Take the market situation of continuous positive lines as an example. After the negative line is closed in the opposite direction, if it is followed by a positive line, then this line is a reverse drag line. If it is followed by a negative line, then it is not a reverse drag line.
The above method is relatively clear, but it will delay the opportunity. Even if there is only a difference of one K-line, it is better to be able to identify the reverse line faster.
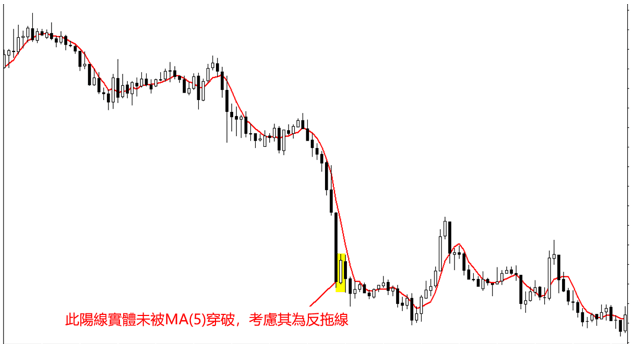
Two auxiliary identification methods are provided here, but they require the help of tools. One uses the Boolean channel and the other uses MA (5).
The Bollinger Band is sensitive to market sentiment. If it is a reverse line, the upper or lower track of the Bollinger channel will not change in slope. On the contrary, if the upper or lower track of the Bollinger channel changes in slope, the probability that it is not a reverse line is high, and you need to consider exiting the market.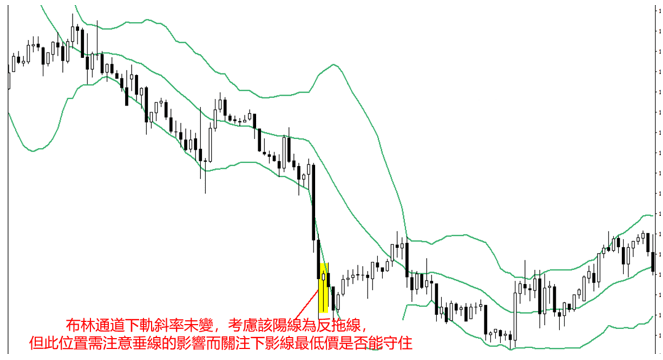
With the help of MA (5), if the reverse K-line entity is not penetrated by MA (5), the probability of a reverse drag is high. Otherwise, consider exiting the market.
Note that these two methods are not as accurate as using the K-line following the reverse K-line as the basis for judgment, but at least they can try to identify the reverse line earlier. Therefore, entering the market in this way has a slightly higher risk, and it is not recommended for non-aggressive people to try.
Having said that, it is still risky to try to enter the market by using the reverse drag line. After all, the market you have found still has a continuation after the outbreak. If the market is not stable enough, the profit space is very limited, so it is difficult to determine whether the market is really stable. Therefore, it is recommended to settle for the second best and determine whether to exit the market by identifying the reverse drag line. In this way, the difficulty is much lower.
Technology is not everything, but without technology, nothing is possible.
(Do your own research, not investment advice)