Futures Trading Report (February): Retracement or Trend Reversal?

1. Market Overview: Crypto markets displayed mixed performance in February
Most major cryptocurrencies yield negative returns in February despite reaching a new 6-month high. After a strong performance in January, volatility came back as Bitcoin peaked at $10,500. However, the rally was shortlived as prices retreated and closed at $8500 for the month. As such, Bitcoin’s market capitalization fell from $170 billion to $155 billion, 9% lower since January.
Chart 1 - Bitcoin’s market capitalization dominance fell in February

Source: Coin360
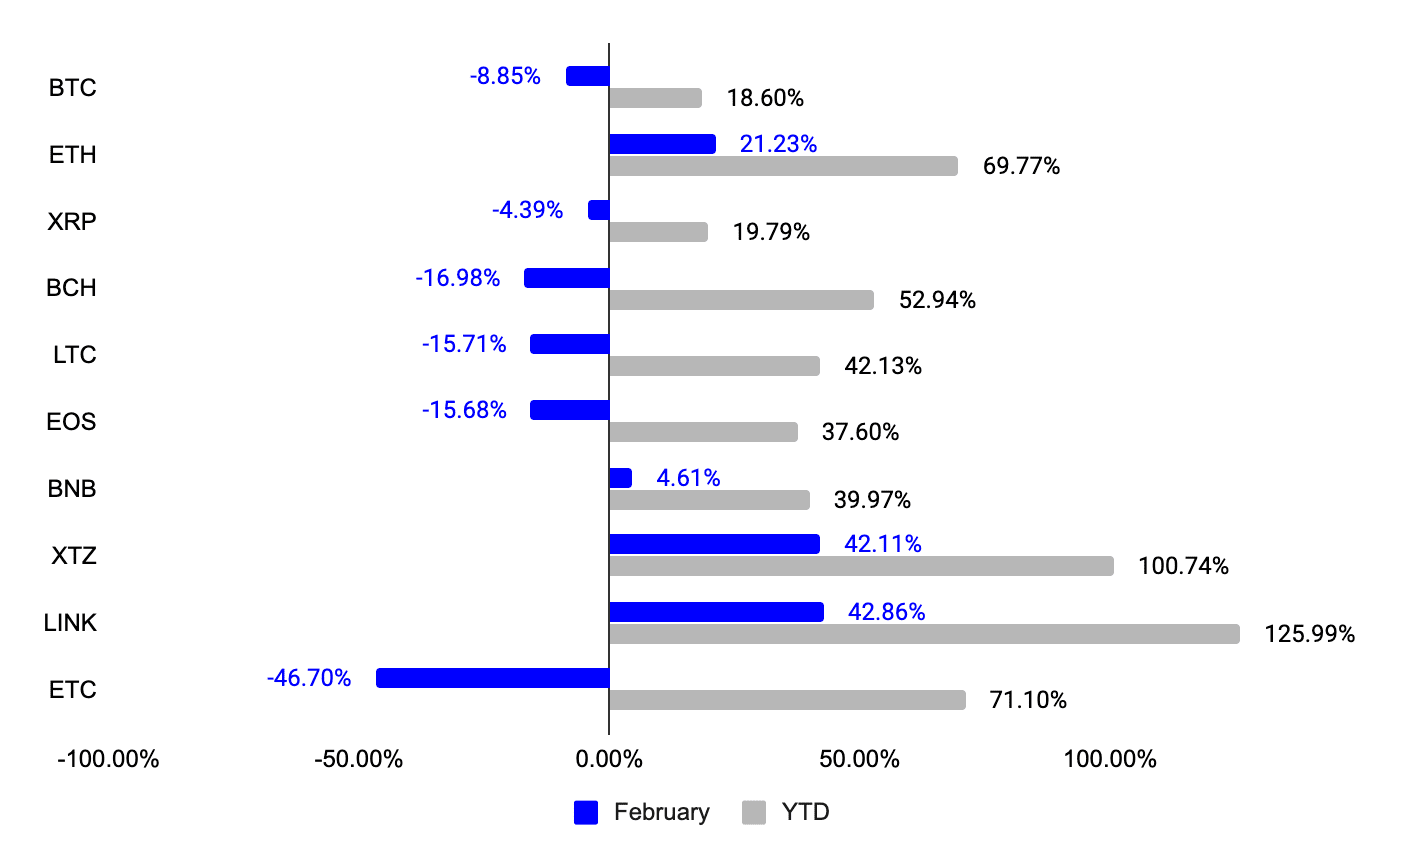
In the altcoin markets, we observed a similar price trend as most altcoins ended February on a negative note. Total altcoin market capitalization declined from $85 billion to $83billion, a 2% month-on-month decline. Despite the underperformance of crypto-markets, there were exceptions such as ETH, LINK, XTZ, and BNB. ETH ended the month with 21.2% higher as prices closed at $220. Meanwhile, XTZ, LINK, and BNB also outperformed the general market, with gains of 42.1%, 42.8%, and 4%, respectively.
Chart 2 - Performances of large-cap cryptocurrencies
Source: Binance Futures
Year to date, Altcoin markets have outperformed BTC by a wide margin. Except for XRP, most large-cap altcoins have more than doubled the returns of BTC. Owing to the strong performances of certain altcoins, Bitcoin’s market capitalization dominance fell to 60% (vs. 70% in January).
2. Volatility is back, is it staying?
February was a relatively volatile month for cryptocurrencies. The surge in volatility presented opportunities for traders, investors, and miners to capitalize on adverse price movements.
On average, the 30-day volatility across large-cap cryptocurrencies increased to 6.2% from 4.8% since January. In particular, large-cap altcoins such as XRP, BNB, ETH, TRX, ETC, and LTC experienced higher volatility in February. ETC displayed the largest volatility among large-cap cryptocurrencies as its volatility was 6x larger than BTC and 3x larger than ETH.
Table 1 - Historical volatility across large-cap cryptocurrencies

Source: Binance Futures
Chart 3 - Visual representation of historical volatility across crypto markets

Source: Binance Futures
Comparing historical volatility, the 30 and 90-day trends indicate higher volatility in Altcoin markets than Bitcoin. This was no surprise as altcoin markets have outperformed BTC since the start of the year. As traders look to participate in the ‘Altcoin season’, it is expected to experience more volatility across Altcoins.
3. Relative Correlation Assessment
In February, correlations trends showed that BTC has maintained a positive relationship with most large-cap altcoins and displayed the strongest correlation with BNB. ETC was the only exception, indicated a weak price relationship of 0.24.
ETH showed a weaker relationship with BTC than in previous months, as correlation drops from 0.96 to 0.62. This observation is consistent with ETH’s outperformance against BTC.
Table 2 - 30-day correlations across large-cap cryptocurrencies

Source: Binance Futures
Additionally, we observed the inverse correlation between ETH and ETC as both ended the month in divergence, recorded 21% and -34% net change in prices. ETC displayed the weakest relationship with other large-cap cryptocurrencies, which came as no surprise as it was one of the worst performers for the month.
4. Performance of Binance Futures perpetual markets

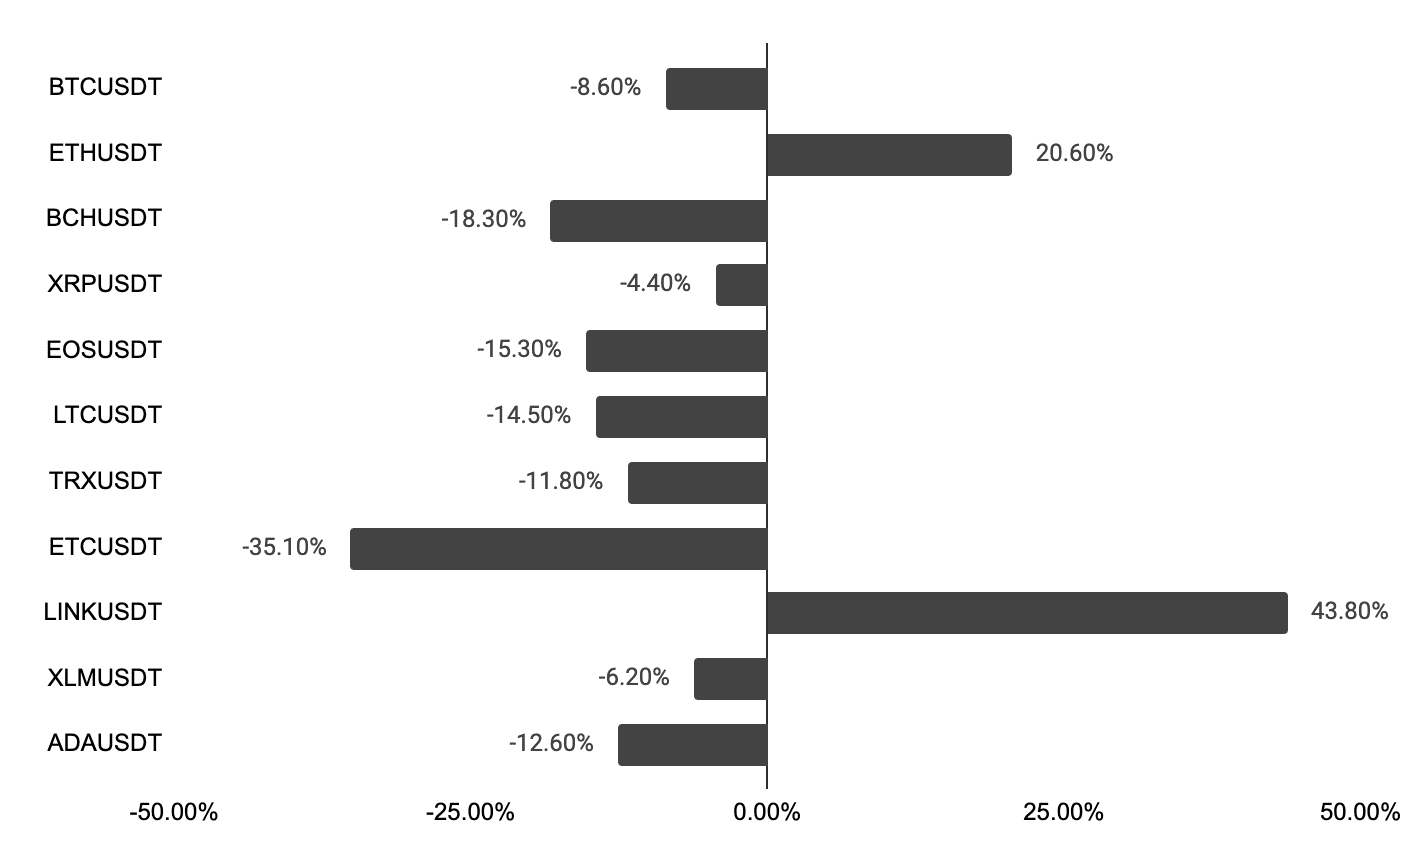
In February, most of Binance Futures’ perpetual contracts ended the month on a negative note. Its most-traded contract, BTCUSDT, closed 8% lower since January. ETHUSDT and LINKUSDT have outperformed other perpetual contracts, recorded gains of 20.6%, and 43.8%, respectively. Meanwhile, ETCUSDT saw a significant decline in market value, decreasing by 35.10% to $7.7 per contract.
Chart 4 - Binance Futures’ perpetual markets performance in February
Source: Binance Futures
Analysts suggest that concerns over the global coronavirus situation caused turmoil across global equity markets, dragging along crypto-markets as well. Despite the recent sell-off, cryptocurrencies are still considered as an uncorrelated asset from traditional markets based on historical performances.
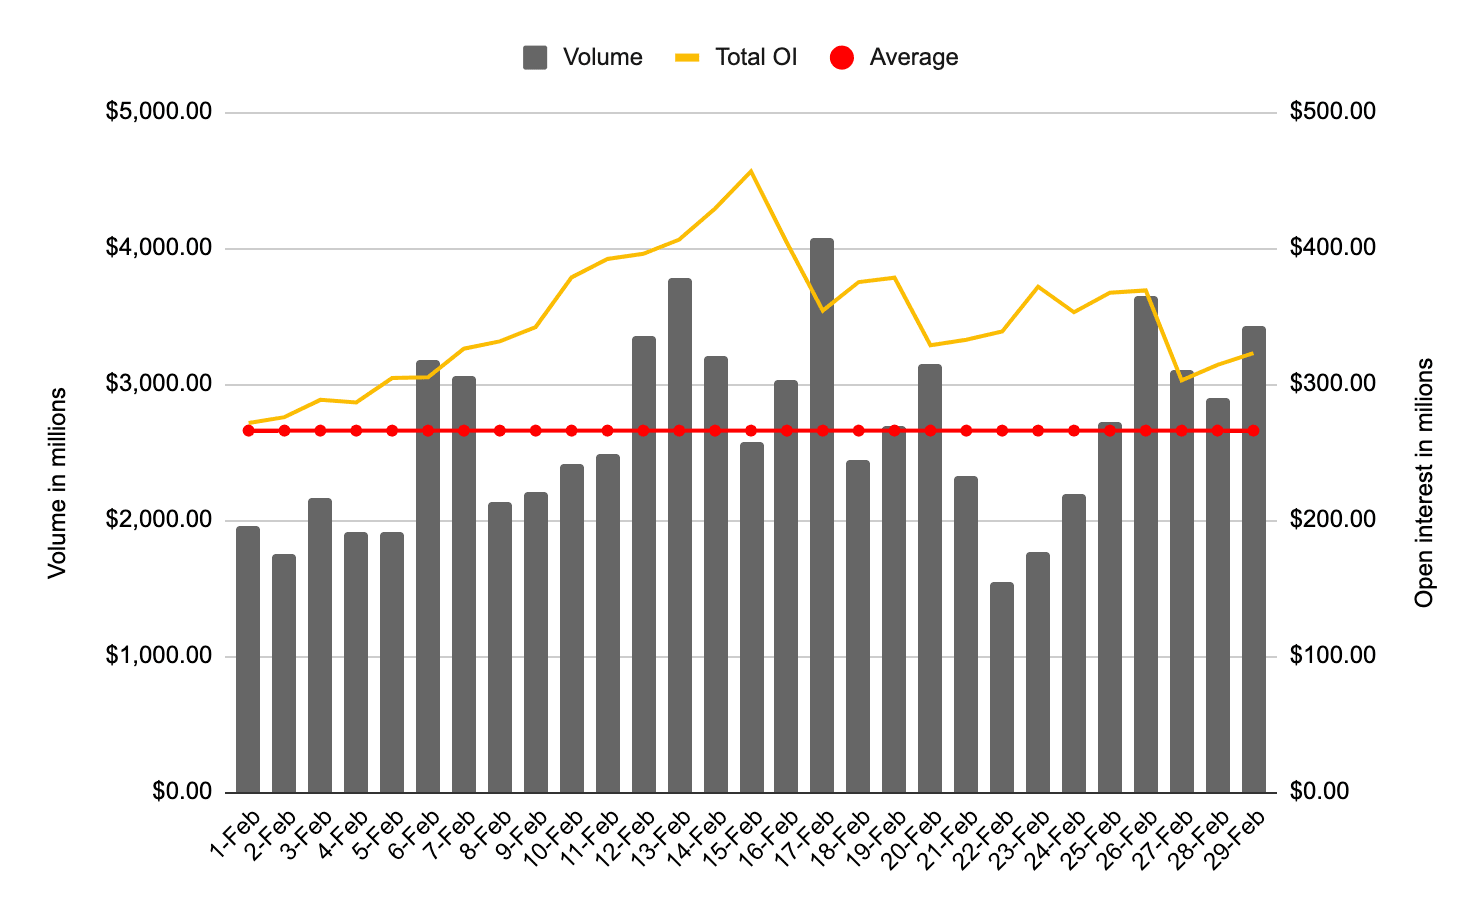
Binance Futures saw a jump in trading activity despite the negative performance across crypto-futures markets. The increase in volatility provided more opportunities for traders as Binance Futures recorded 37.5% higher volumes than January, ending the month with $77 billion in volume.
Most cryptocurrencies peaked in mid-February, in that period, Binance Futures recorded a new all-time high with $4 billion in volume on a single day. Throughout February, traders were more active in market participation as Binance Futures saw its average daily volume increased from $1.7 billion to $2.6 billion.
Chart 5 - Daily and average volume vs. daily open interest
Source: Binance Futures
Binance Futures’ total open interest grew by 18% from $272 to $322 million. Its open interest broke peaked at $450 million as crypto markets continued the bullish momentum since January. However, open interest declined as prices move lower.
5. Sentiment Indicators: Are traders accumulating or unloading positions?
In general, traders remained bullish on the entire crypto-market and were not deterred by the sell-off towards the end of the month. We observed an increase in buying activity across our perpetual futures contracts, as indicated by the Long/Short ratio.
Chart 6 - Long/Short ratio vs. daily net change in BTC

Source: Binance Futures
As shown in Chart 5, the number of long positions gradually increased since the start of the month from 1.1 to 1.7. The ratio continued to increase even as prices of BTC retreated towards the end of the month. These findings suggest that traders accumulated on long positions as prices dip lower, anticipating a trend continuation in the coming weeks.
In a similar fashion to the previous month, we observed less hedging activity on Binance Futures. The taker to maker volume ratio declined throughout the month. In particular, the ratio continued to decline during the consecutive down-days towards the end of the month. This observation is consistent with the increasing long/short ratio that was discussed earlier.
Chart 7 - Taker/maker ratio vs BTC daily net returns

Source: Binance Futures
Historically, in periods where traders are risk-averse, the two indicators tend to diverge. For instance, the taker to maker volumes tends to increase as BTC prices trend lower, which signals that traders are actively risk-hedging.
6. Final Thoughts: Trend continuation or reversal?
After a strong recovery in January, crypto-markets eventually retreated as turmoil in global equity markets spills over. Despite that, traders maintained a bullish outlook on the crypto-market, as shown earlier.
While bullish sentiment prevails, traders should also consider price action to confirm the integrity of the underlying trend. Here, we analyze the recent price action and highlight the key price levels that traders should keep in mind.

Source: Tradingview
As of this writing, BTC hovers around $8700-8800 as prices stabilize after the recent sell-off. If prices break above its near-term resistance of $9000, traders could see more bullish momentum before a major resistance level awaits at $9600. If BTC breaks above $9600 with strong momentum, it could trigger the next leg of the bull market. However, should BTC fails to do so, the uptrend could be at risk.
Analyzing the price action on BTC, we observed that sell-side pressure has slowed down and recovered off a critical price support area. The price action conforms to the money flow index, which has reached oversold territory. Considering its low valuation and a 1-month accumulation phase in December, the long-term price trend on BTC remains bullish.