
Bhatti 2007
27 Posts

Bhatti 2007
Report
Block User
Open Trade
Frequent Trader
6.7 Months
1 Following
3 Followers
17 Liked
Posts
Portfolio
·
--
Bullish
🚀 AMD (ADVANCED MICRO DEVICES) — BULLISH MOMENTUM
AMD is showing strong bullish momentum after a significant price surge. 📈
A breakout above $448 could open the door for a potential move toward $460, while $446.25 remains an important support level.
Traders should watch volume, resistance, and market sentiment closely. A pullback or trend reversal is still possible.
Trend Outlook: Potentially Bullish
Key Resistance: $448.14
Support Level: $446.25
Next Focus: $460 — Speculative Target
⚠️ This is a technical market observation, not financial advice. Always manage risk.$AMD.US
{stock_us}(AMD.US)
🤑🤑🤑🤑🤑🤑🤑🤑🤑
🚀 AMD (ADVANCED MICRO DEVICES) — BULLISH MOMENTUM
AMD is showing strong bullish momentum after a significant price surge. 📈
A breakout above $448 could open the door for a potential move toward $460, while $446.25 remains an important support level.
Traders should watch volume, resistance, and market sentiment closely. A pullback or trend reversal is still possible.
Trend Outlook: Potentially Bullish
Key Resistance: $448.14
Support Level: $446.25
Next Focus: $460 — Speculative Target
⚠️ This is a technical market observation, not financial advice. Always manage risk.$AMD.US
🤑🤑🤑🤑🤑🤑🤑🤑🤑
AMD is showing strong bullish momentum after a significant price surge. 📈
A breakout above $448 could open the door for a potential move toward $460, while $446.25 remains an important support level.
Traders should watch volume, resistance, and market sentiment closely. A pullback or trend reversal is still possible.
Trend Outlook: Potentially Bullish
Key Resistance: $448.14
Support Level: $446.25
Next Focus: $460 — Speculative Target
⚠️ This is a technical market observation, not financial advice. Always manage risk.$AMD.US
🤑🤑🤑🤑🤑🤑🤑🤑🤑


AMDUS+10,64%
96
·
--
{spot}(AMDBUSDT)
🚀 AMD (Advanced Micro Devices) — Bullish Momentum
AMD is showing strong bullish momentum after a significant price increase. The short-term trend remains positive, with traders watching key resistance levels for a potential breakout.
📊 Trend Outlook: Potential Bullish Momentum
⏳ Timeframe: Next 24–72 Hours
🎯 Resistance: $460–$470
🛡️ Support: $440–$445
A sustained move above resistance could strengthen the bullish outlook. Watch volume and price action carefully — market direction is never guaranteed. Always manage risk.
🚀 AMD (Advanced Micro Devices) — Bullish Momentum
AMD is showing strong bullish momentum after a significant price increase. The short-term trend remains positive, with traders watching key resistance levels for a potential breakout.
📊 Trend Outlook: Potential Bullish Momentum
⏳ Timeframe: Next 24–72 Hours
🎯 Resistance: $460–$470
🛡️ Support: $440–$445
A sustained move above resistance could strengthen the bullish outlook. Watch volume and price action carefully — market direction is never guaranteed. Always manage risk.
AMD is showing strong bullish momentum after a significant price increase. The short-term trend remains positive, with traders watching key resistance levels for a potential breakout.
📊 Trend Outlook: Potential Bullish Momentum
⏳ Timeframe: Next 24–72 Hours
🎯 Resistance: $460–$470
🛡️ Support: $440–$445
A sustained move above resistance could strengthen the bullish outlook. Watch volume and price action carefully — market direction is never guaranteed. Always manage risk.

57
·
--
Bullish
🚀 COHR (COHERENT CORP.) — BULLISH MOMENTUM
COHR is showing strong upward momentum after a significant price surge. A sustained move above the $195 resistance level could open the door for further upside.
📊 Current Price: $192.83
🎯 Key Resistance: $195.00
📈 Trend Outlook: Potential Bullish Continuation
⏳ Timeframe: Next 24–72 Hours
Watch the price action and trading volume closely. A breakout is possible, but market volatility remains high. This is a technical outlook, not a guaranteed prediction.
Stay focused. Trade smart.$COHRB
{future}(COHRUSDT)
🚀 COHR (COHERENT CORP.) — BULLISH MOMENTUM
COHR is showing strong upward momentum after a significant price surge. A sustained move above the $195 resistance level could open the door for further upside.
📊 Current Price: $192.83
🎯 Key Resistance: $195.00
📈 Trend Outlook: Potential Bullish Continuation
⏳ Timeframe: Next 24–72 Hours
Watch the price action and trading volume closely. A breakout is possible, but market volatility remains high. This is a technical outlook, not a guaranteed prediction.
Stay focused. Trade smart.$COHRB
COHR is showing strong upward momentum after a significant price surge. A sustained move above the $195 resistance level could open the door for further upside.
📊 Current Price: $192.83
🎯 Key Resistance: $195.00
📈 Trend Outlook: Potential Bullish Continuation
⏳ Timeframe: Next 24–72 Hours
Watch the price action and trading volume closely. A breakout is possible, but market volatility remains high. This is a technical outlook, not a guaranteed prediction.
Stay focused. Trade smart.$COHRB

85
·
--
Bullish
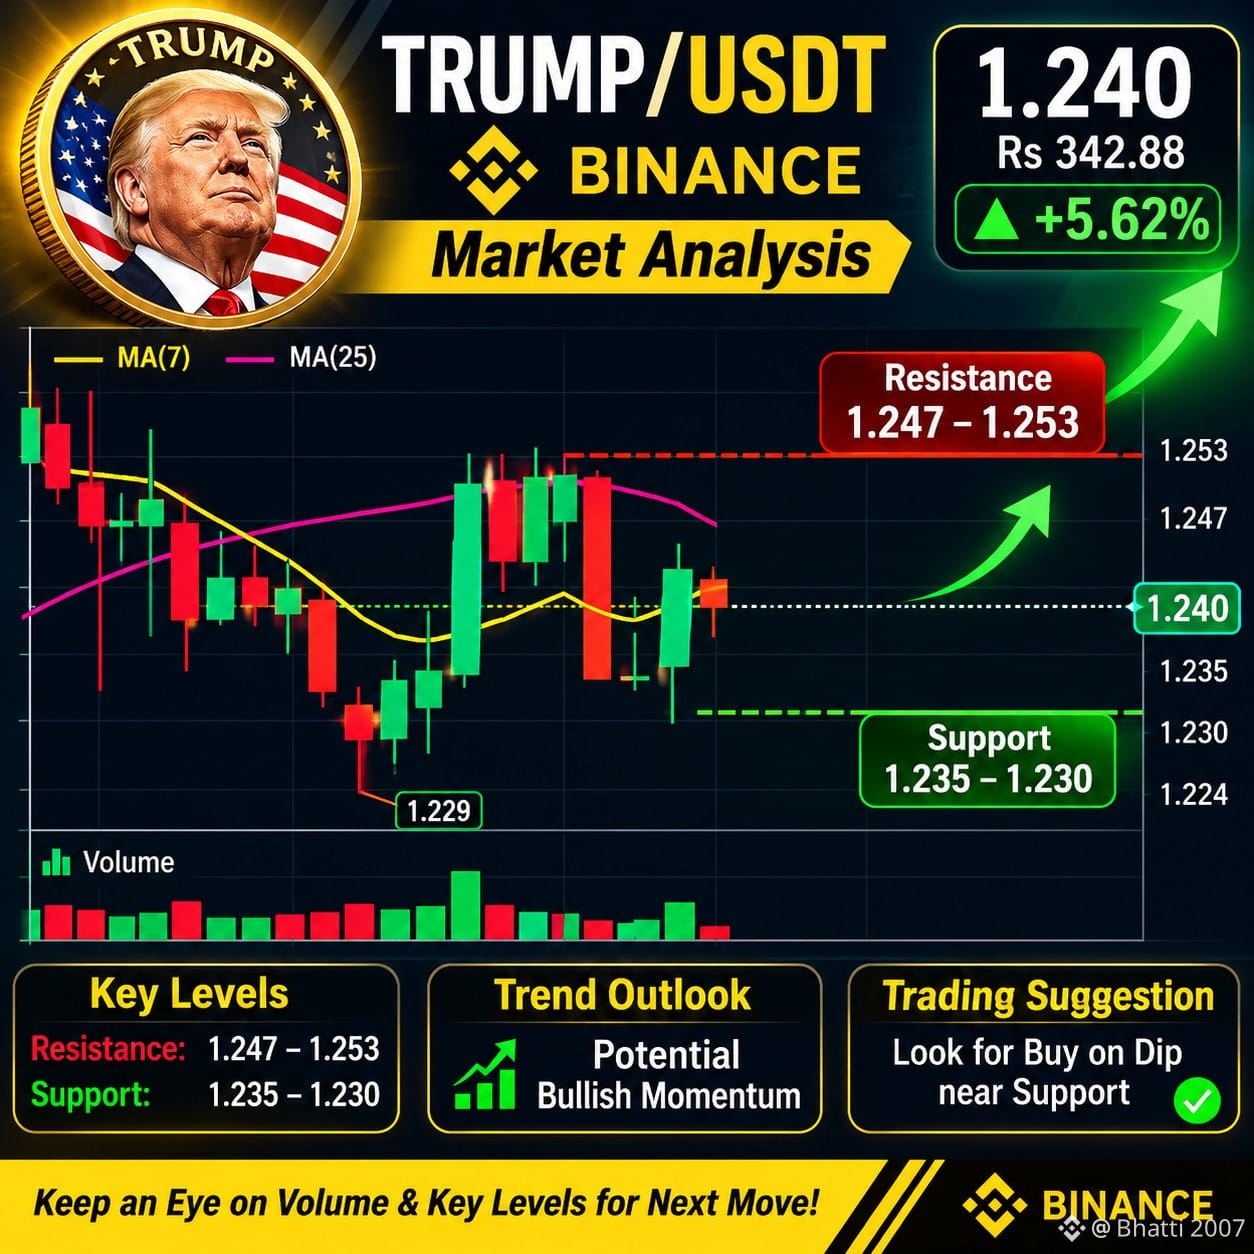
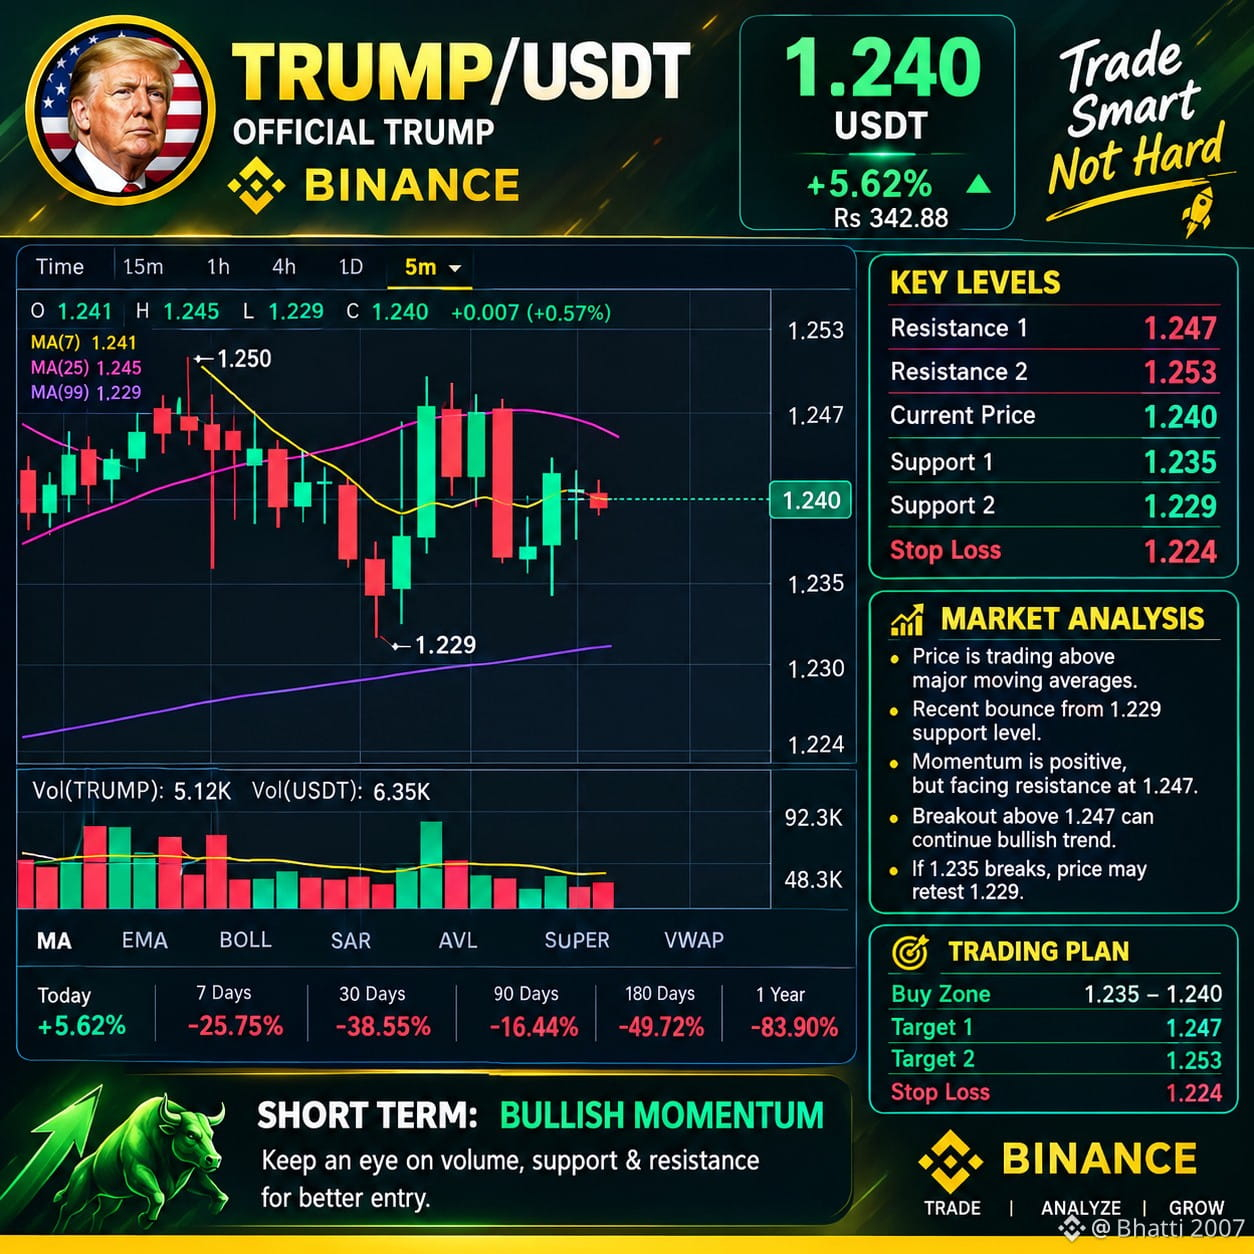
Based on your 5-minute TRUMP/USDT chart, I’m preparing a striking Binance-style graph.
### 📊 TRUMP/USDT — Technical Analysis
* Current Price: 1.240 USDT
* 24H Change: +5.62%
* Resistance: 1.245 – 1.250
* Support: 1.235 – 1.229
* Short-Term Outlook: Neutral to Slightly Bearish
The price is currently below MA(25). A strong breakout above 1.245 could create bullish momentum. A drop below 1.235 may increase weakness.
This analysis is based on the screenshot and is not a definitive prediction.
### 📈 TRUMP/USDT Graph
```text
Price: 1.240 USDT
1.253 ───── Resistance 2
1.247 ───── Resistance 1
1.245 ───── Breakout Level
1.240 ───── Current Price
1.235 ───── Support 1
1.229 ───── Support 2
Outlook: Neutral / Volatile
```
English Post:
TRUMP/USDT is showing short-term volatility after a recent recovery from the 1.229 support zone. A breakout above 1.245–1.247 could open the door for further upside toward 1.253. However, a drop below 1.235 may increase selling pressure. Traders should monitor volume and key support levels before making any decisions.
The generated image is an illustrative chart, not a live trading signal.
{future}(TRUMPUSDT)
Based on your 5-minute TRUMP/USDT chart, I’m preparing a striking Binance-style graph.
### 📊 TRUMP/USDT — Technical Analysis
* Current Price: 1.240 USDT
* 24H Change: +5.62%
* Resistance: 1.245 – 1.250
* Support: 1.235 – 1.229
* Short-Term Outlook: Neutral to Slightly Bearish
The price is currently below MA(25). A strong breakout above 1.245 could create bullish momentum. A drop below 1.235 may increase weakness.
This analysis is based on the screenshot and is not a definitive prediction.
### 📈 TRUMP/USDT Graph
```text
Price: 1.240 USDT
1.253 ───── Resistance 2
1.247 ───── Resistance 1
1.245 ───── Breakout Level
1.240 ───── Current Price
1.235 ───── Support 1
1.229 ───── Support 2
Outlook: Neutral / Volatile
```
English Post:
TRUMP/USDT is showing short-term volatility after a recent recovery from the 1.229 support zone. A breakout above 1.245–1.247 could open the door for further upside toward 1.253. However, a drop below 1.235 may increase selling pressure. Traders should monitor volume and key support levels before making any decisions.
The generated image is an illustrative chart, not a live trading signal.
### 📊 TRUMP/USDT — Technical Analysis
* Current Price: 1.240 USDT
* 24H Change: +5.62%
* Resistance: 1.245 – 1.250
* Support: 1.235 – 1.229
* Short-Term Outlook: Neutral to Slightly Bearish
The price is currently below MA(25). A strong breakout above 1.245 could create bullish momentum. A drop below 1.235 may increase weakness.
This analysis is based on the screenshot and is not a definitive prediction.
### 📈 TRUMP/USDT Graph
```text
Price: 1.240 USDT
1.253 ───── Resistance 2
1.247 ───── Resistance 1
1.245 ───── Breakout Level
1.240 ───── Current Price
1.235 ───── Support 1
1.229 ───── Support 2
Outlook: Neutral / Volatile
```
English Post:
TRUMP/USDT is showing short-term volatility after a recent recovery from the 1.229 support zone. A breakout above 1.245–1.247 could open the door for further upside toward 1.253. However, a drop below 1.235 may increase selling pressure. Traders should monitor volume and key support levels before making any decisions.
The generated image is an illustrative chart, not a live trading signal.
47
·
--
Bearish
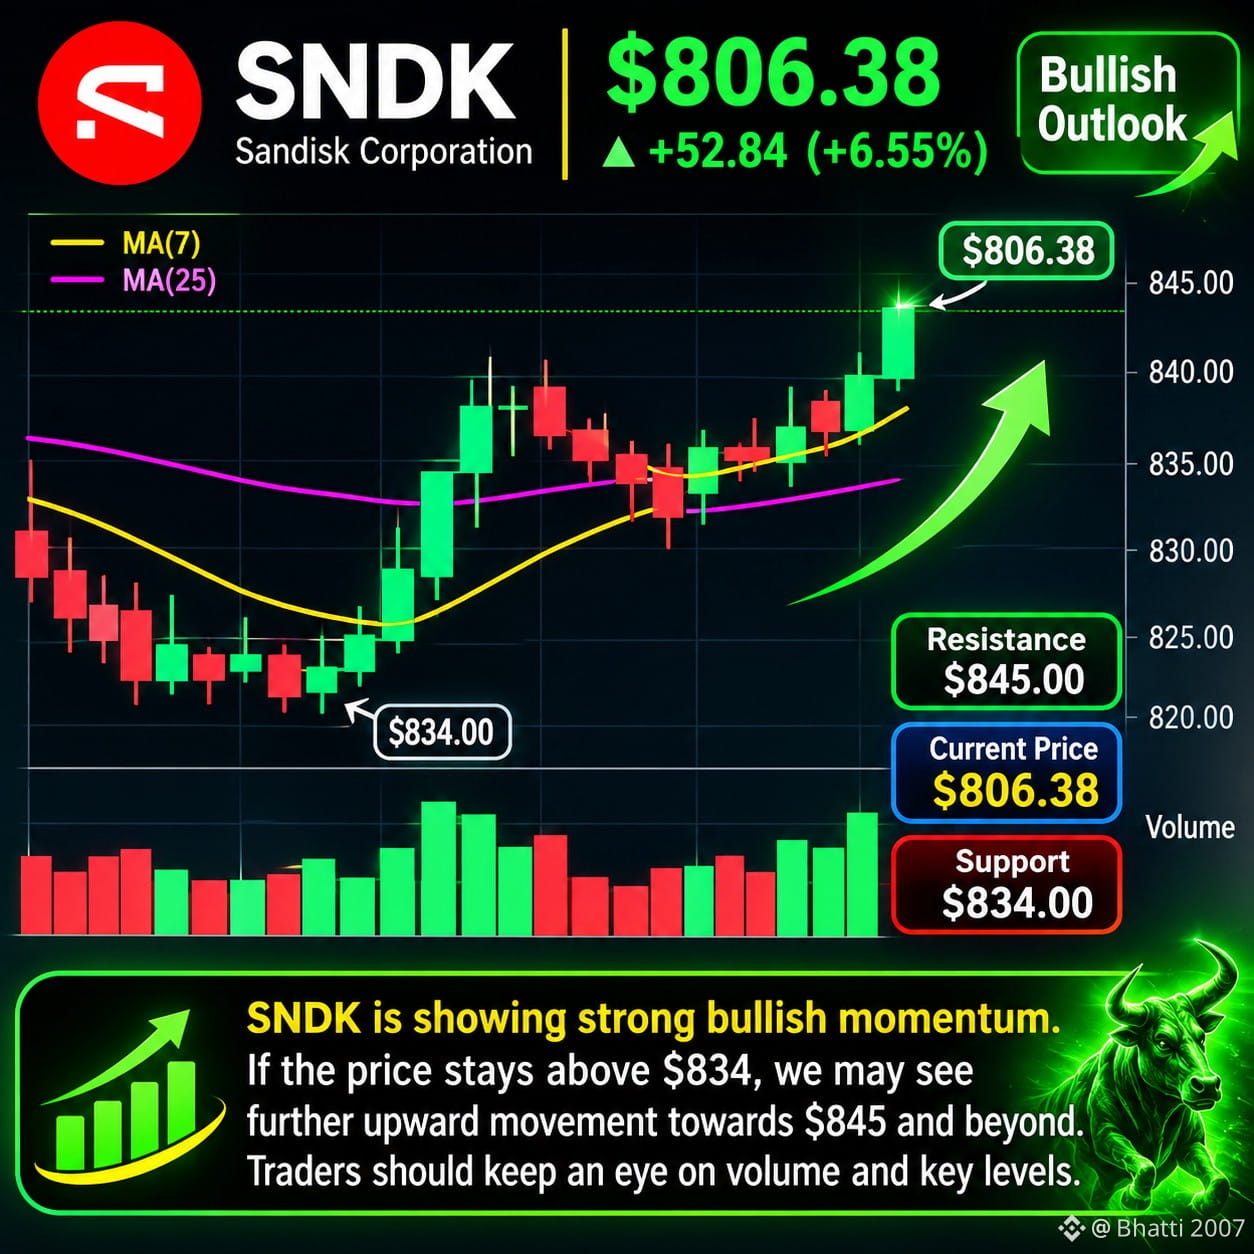
🚀 SNDK is showing a potential short-term recovery after a sharp market decline.
📈 A breakout above $845 could signal further bullish momentum.
🎯 Traders should closely monitor support, resistance, and trading volume.
⚠️ Market direction remains uncertain — always confirm with live price action.
{stock_us}(SNDK.US)
🚀 SNDK is showing a potential short-term recovery after a sharp market decline.
📈 A breakout above $845 could signal further bullish momentum.
🎯 Traders should closely monitor support, resistance, and trading volume.
⚠️ Market direction remains uncertain — always confirm with live price action.
📈 A breakout above $845 could signal further bullish momentum.
🎯 Traders should closely monitor support, resistance, and trading volume.
⚠️ Market direction remains uncertain — always confirm with live price action.
SNDKUS+4,14%
1.4k
·
--
Bullish
🚀 JCTUSDT — BULLISH MOMENTUM
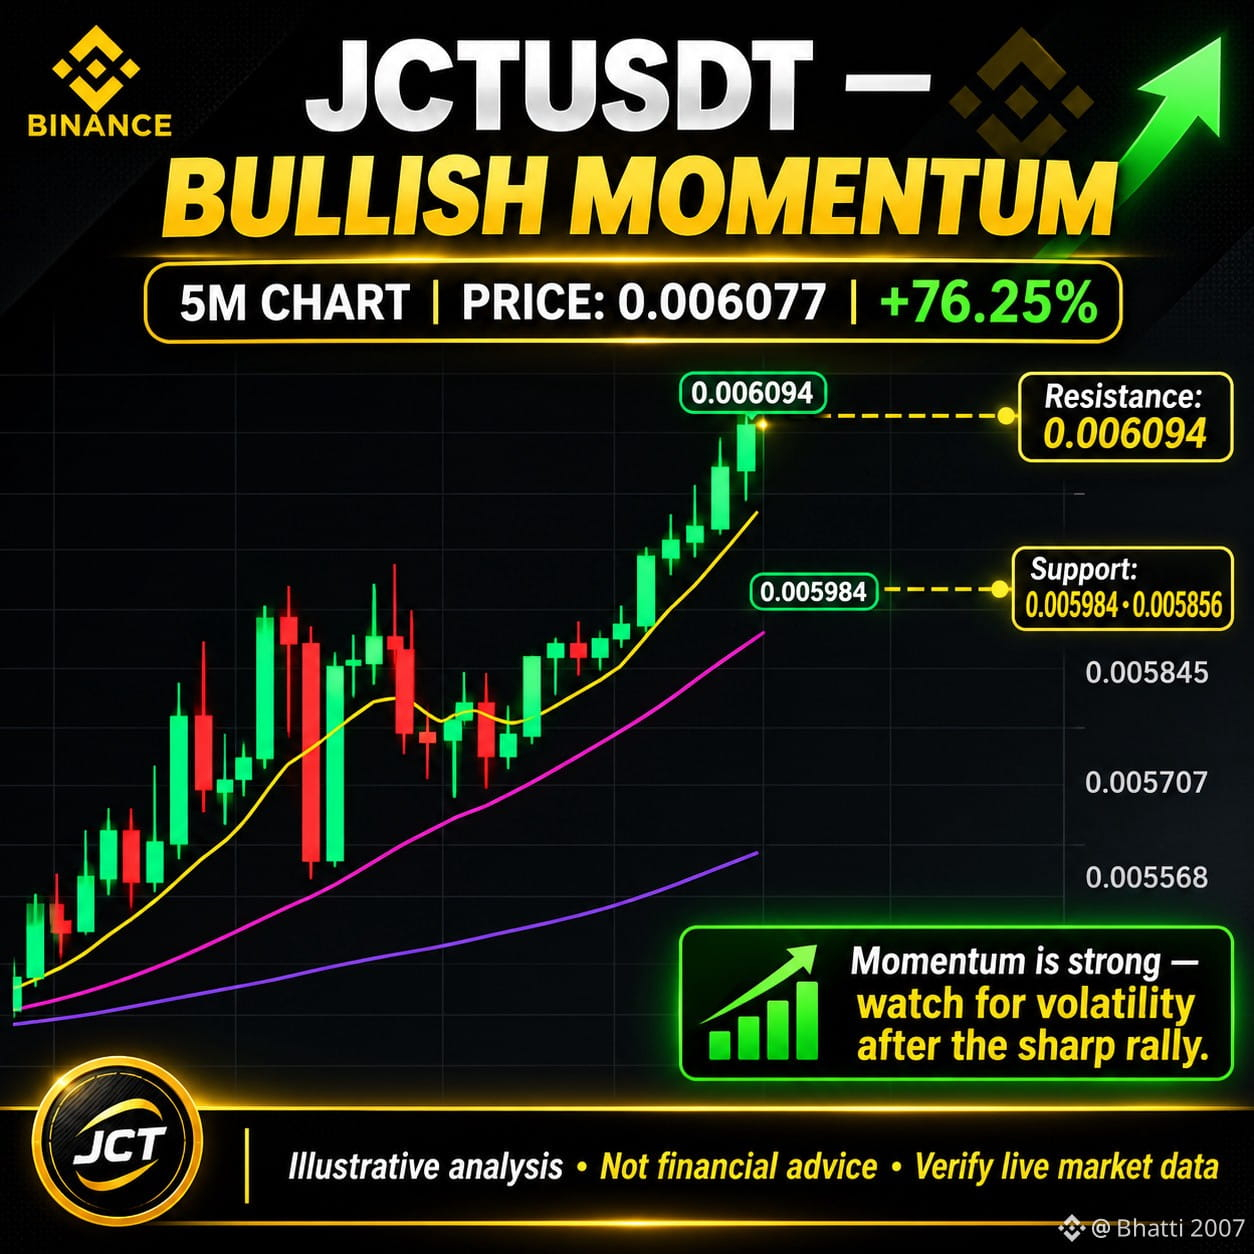
📊 Strong upward momentum is visible on the 5-minute chart.
🟢 Current Price: 0.006077
📈 24H Change: +76.25%
🎯 Resistance: 0.006094
🔍 Key Support: 0.005984 – 0.005856
⚠️ After a sharp rally, volatility may increase. Watch for a confirmed breakout and monitor live market conditions.
JCT JCTUSDT CryptoAnalysis Binance BullishMomentum Altcoins
{future}(JCTUSDT)
$JCT
🚀 JCTUSDT — BULLISH MOMENTUM
📊 Strong upward momentum is visible on the 5-minute chart.
🟢 Current Price: 0.006077
📈 24H Change: +76.25%
🎯 Resistance: 0.006094
🔍 Key Support: 0.005984 – 0.005856
⚠️ After a sharp rally, volatility may increase. Watch for a confirmed breakout and monitor live market conditions.
JCT JCTUSDT CryptoAnalysis Binance BullishMomentum Altcoins
$JCT
📊 Strong upward momentum is visible on the 5-minute chart.
🟢 Current Price: 0.006077
📈 24H Change: +76.25%
🎯 Resistance: 0.006094
🔍 Key Support: 0.005984 – 0.005856
⚠️ After a sharp rally, volatility may increase. Watch for a confirmed breakout and monitor live market conditions.
JCT JCTUSDT CryptoAnalysis Binance BullishMomentum Altcoins
$JCT
235

·
--
Bearish
🚀 ETHEREUM (ETH) — MARKET TREND ANALYSIS
Ethereum remains one of the leading cryptocurrencies in the market. A potential bullish move could develop if ETH breaks above key resistance with strong trading volume. Traders should monitor price action, support levels, and market sentiment before making any decisions.
📊 Trend Outlook: Potential Bullish Momentum
⏳ Timeframe: Next 24–72 Hours
🎯 Key Focus: Support, Resistance & Volume
⚠️ Market direction is uncertain. Always confirm the trend with live chart data and manage your risk carefully.
{spot}(ETHUSDT)
🚀 ETHEREUM (ETH) — MARKET TREND ANALYSIS
Ethereum remains one of the leading cryptocurrencies in the market. A potential bullish move could develop if ETH breaks above key resistance with strong trading volume. Traders should monitor price action, support levels, and market sentiment before making any decisions.
📊 Trend Outlook: Potential Bullish Momentum
⏳ Timeframe: Next 24–72 Hours
🎯 Key Focus: Support, Resistance & Volume
⚠️ Market direction is uncertain. Always confirm the trend with live chart data and manage your risk carefully.
Ethereum remains one of the leading cryptocurrencies in the market. A potential bullish move could develop if ETH breaks above key resistance with strong trading volume. Traders should monitor price action, support levels, and market sentiment before making any decisions.
📊 Trend Outlook: Potential Bullish Momentum
⏳ Timeframe: Next 24–72 Hours
🎯 Key Focus: Support, Resistance & Volume
⚠️ Market direction is uncertain. Always confirm the trend with live chart data and manage your risk carefully.

78
·
--
📊 DAY 1 — MARKET INTRODUCTION & POSITIONING
₿ BTC / USDT — Daily Market Watch
In the fast-moving crypto market, smart traders focus on price action, market structure, and key support and resistance levels. 📈
🔍 What to Watch Today:
BTC Price Action: Monitor key breakout and breakdown levels.
Market Sentiment: Watch for changes in buying and selling pressure.
Trading Volume: Confirm whether a move has strong market participation.
Key Levels: Identify important support and resistance zones.
⚠️ Market Outlook: Bitcoin's next move remains uncertain. Wait for confirmation before making any trading decisions.
💡 Trade Smart. Manage Risk. Stay Informed.
BitcoinBTCBinanceCryptoAnalysis BTCUSDT CryptoMarket TradingStrategy MarketWatch
{spot}(BTCUSDT)
📊 DAY 1 — MARKET INTRODUCTION & POSITIONING
₿ BTC / USDT — Daily Market Watch
In the fast-moving crypto market, smart traders focus on price action, market structure, and key support and resistance levels. 📈
🔍 What to Watch Today:
BTC Price Action: Monitor key breakout and breakdown levels.
Market Sentiment: Watch for changes in buying and selling pressure.
Trading Volume: Confirm whether a move has strong market participation.
Key Levels: Identify important support and resistance zones.
⚠️ Market Outlook: Bitcoin's next move remains uncertain. Wait for confirmation before making any trading decisions.
💡 Trade Smart. Manage Risk. Stay Informed.
BitcoinBTCBinanceCryptoAnalysis BTCUSDT CryptoMarket TradingStrategy MarketWatch
₿ BTC / USDT — Daily Market Watch
In the fast-moving crypto market, smart traders focus on price action, market structure, and key support and resistance levels. 📈
🔍 What to Watch Today:
BTC Price Action: Monitor key breakout and breakdown levels.
Market Sentiment: Watch for changes in buying and selling pressure.
Trading Volume: Confirm whether a move has strong market participation.
Key Levels: Identify important support and resistance zones.
⚠️ Market Outlook: Bitcoin's next move remains uncertain. Wait for confirmation before making any trading decisions.
💡 Trade Smart. Manage Risk. Stay Informed.
BitcoinBTCBinanceCryptoAnalysis BTCUSDT CryptoMarket TradingStrategy MarketWatch

70
·
--
Bullish
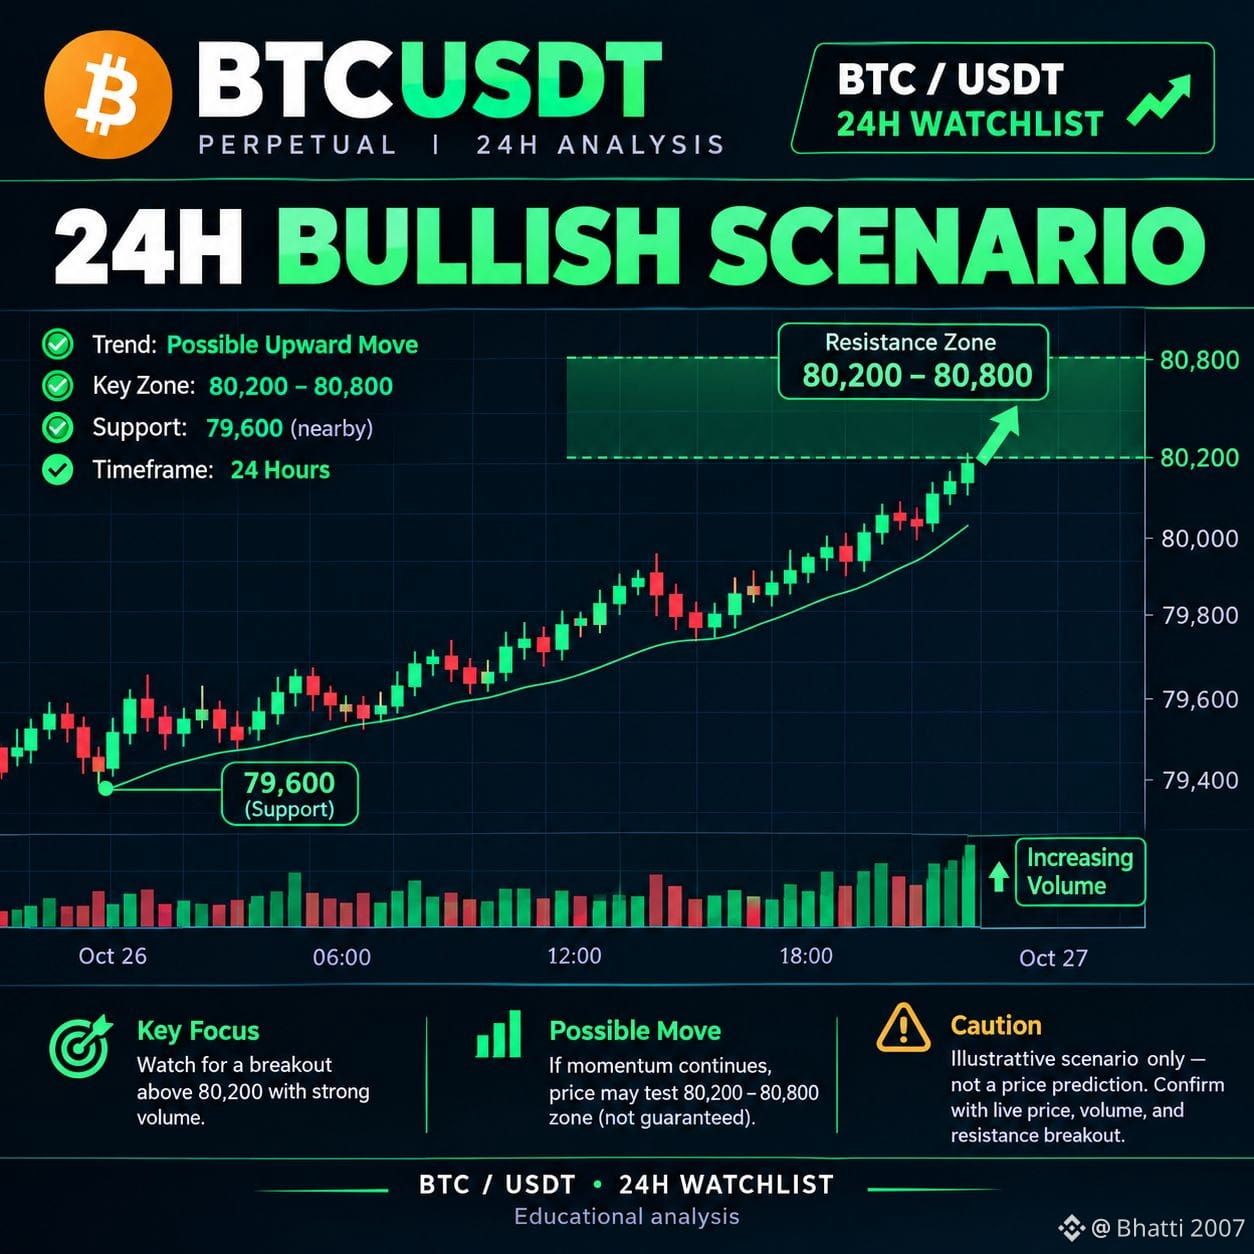
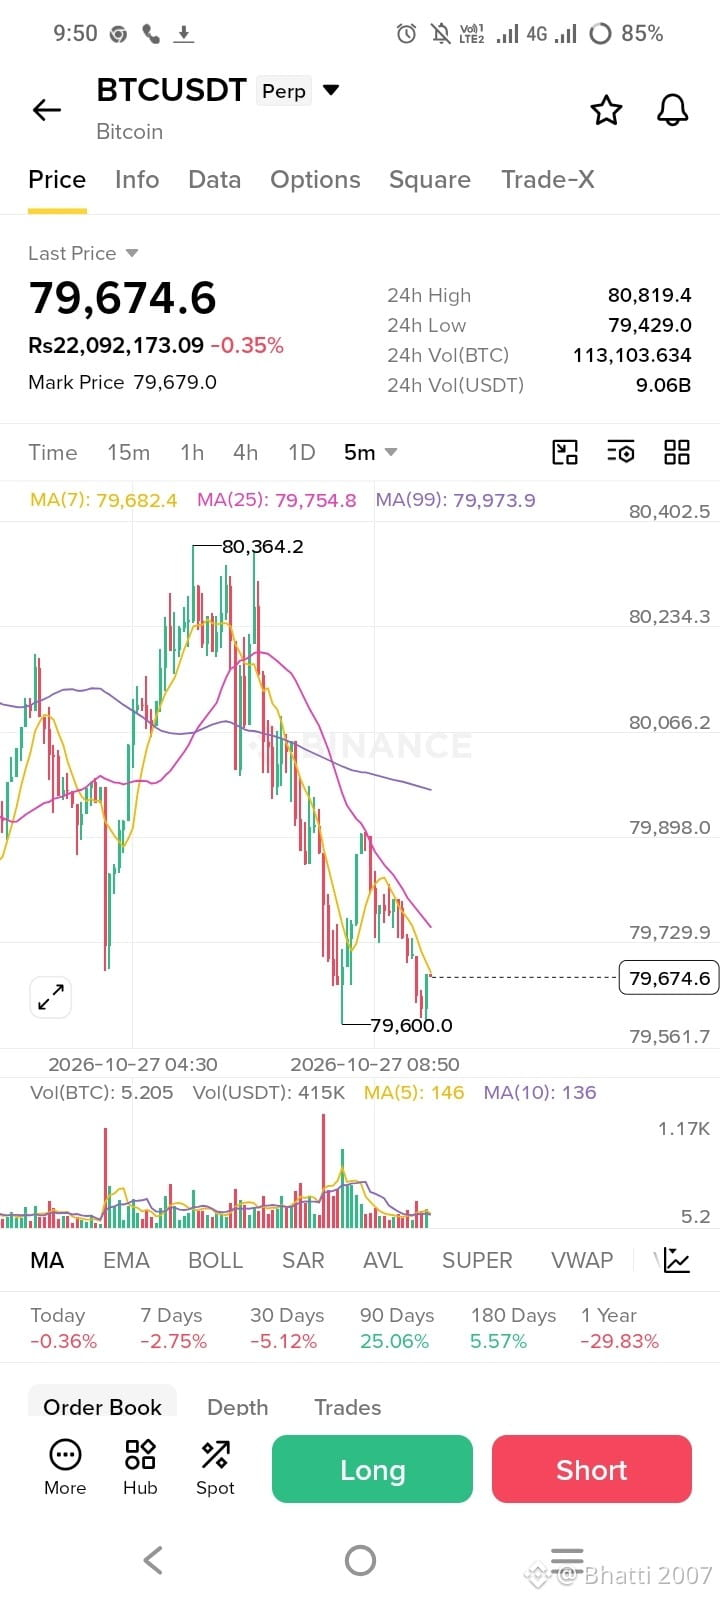
📊 BTC/USDT — CAUTIOUS MARKET OUTLOOK
🪙 Reference Price: 79,674.6 USDT (from the shared chart)
📉 Short-Term Trend: Slightly bearish momentum is visible on the 5-minute timeframe.
🛡️ Key Support: 79,600 USDT — watch for a confirmed break below this level.
🎯 Resistance Zone: 79,730–79,900 USDT — a sustained move above this zone may indicate a potential recovery.
⚖️ Market Outlook: Direction remains uncertain. Wait for price-action and volume confirmation before considering a trade.
⚠️ This is a snapshot-based analysis, not a guaranteed prediction. Prices can change quickly; manage risk carefully.
#BTC #BTCUSDT #Bitcoin #CryptoMarket #TechnicalAnalysisPost
{spot}(BTCUSDT)
📊 BTC/USDT — CAUTIOUS MARKET OUTLOOK
🪙 Reference Price: 79,674.6 USDT (from the shared chart)
📉 Short-Term Trend: Slightly bearish momentum is visible on the 5-minute timeframe.
🛡️ Key Support: 79,600 USDT — watch for a confirmed break below this level.
🎯 Resistance Zone: 79,730–79,900 USDT — a sustained move above this zone may indicate a potential recovery.
⚖️ Market Outlook: Direction remains uncertain. Wait for price-action and volume confirmation before considering a trade.
⚠️ This is a snapshot-based analysis, not a guaranteed prediction. Prices can change quickly; manage risk carefully.
#BTC #BTCUSDT #Bitcoin #CryptoMarket #TechnicalAnalysisPost
🪙 Reference Price: 79,674.6 USDT (from the shared chart)
📉 Short-Term Trend: Slightly bearish momentum is visible on the 5-minute timeframe.
🛡️ Key Support: 79,600 USDT — watch for a confirmed break below this level.
🎯 Resistance Zone: 79,730–79,900 USDT — a sustained move above this zone may indicate a potential recovery.
⚖️ Market Outlook: Direction remains uncertain. Wait for price-action and volume confirmation before considering a trade.
⚠️ This is a snapshot-based analysis, not a guaranteed prediction. Prices can change quickly; manage risk carefully.
#BTC #BTCUSDT #Bitcoin #CryptoMarket #TechnicalAnalysisPost
74
·
--
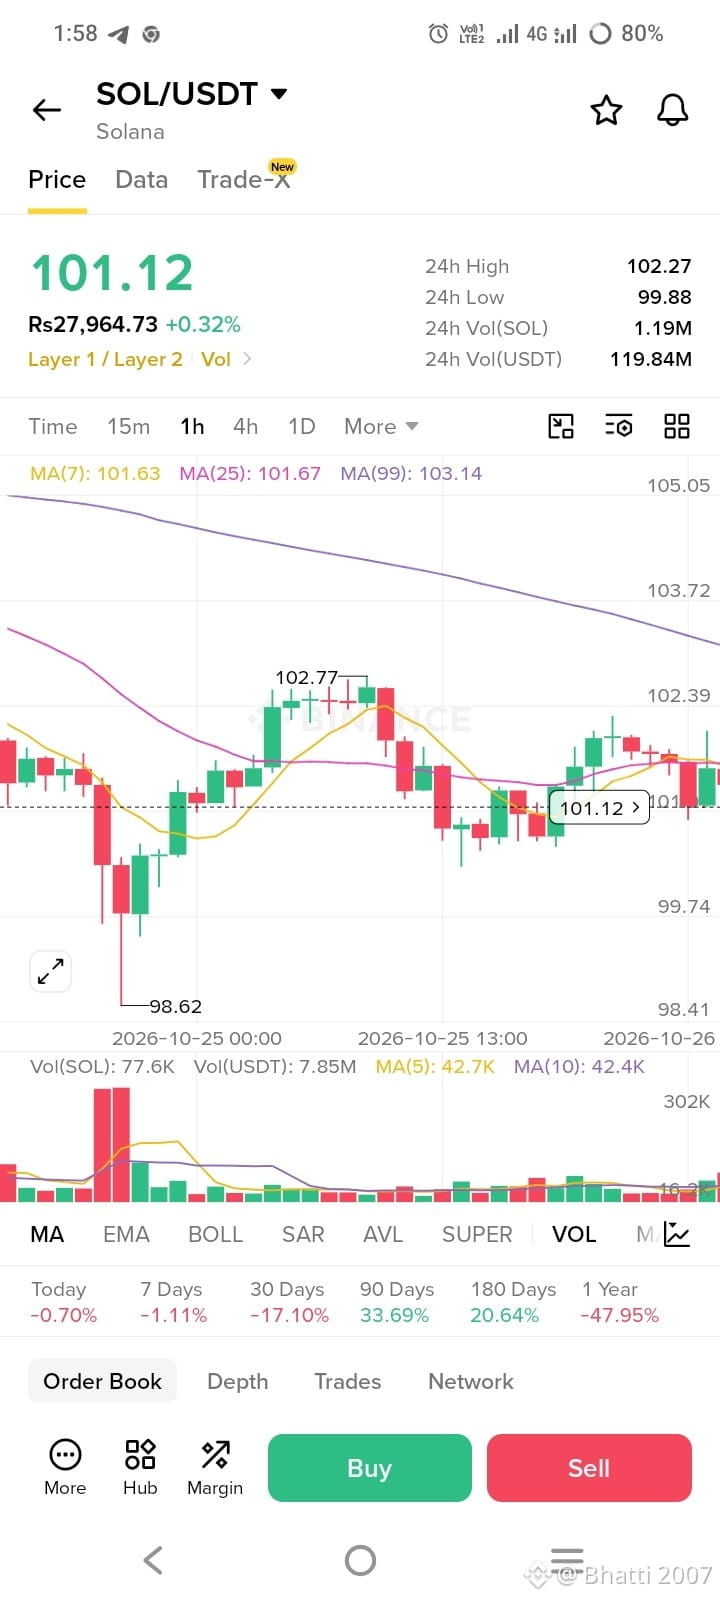
🚀 SOLANA (SOL) — THE NEXT BIG MOVE? 📈🔥
⚡ Solana is on every crypto trader’s watchlist!
📊 Watch key resistance levels, trading volume, and momentum for the next potential breakout.
💎 Will SOL make a powerful move? Keep watching the charts! 👀
#Solana #SOL #Crypto #Altcoins #Binance #CryptoTrading #BullishTrend
{spot}(SOLUSDT)
🚀 SOLANA (SOL) — THE NEXT BIG MOVE? 📈🔥
⚡ Solana is on every crypto trader’s watchlist!
📊 Watch key resistance levels, trading volume, and momentum for the next potential breakout.
💎 Will SOL make a powerful move? Keep watching the charts! 👀
#Solana #SOL #Crypto #Altcoins #Binance #CryptoTrading #BullishTrend
⚡ Solana is on every crypto trader’s watchlist!
📊 Watch key resistance levels, trading volume, and momentum for the next potential breakout.
💎 Will SOL make a powerful move? Keep watching the charts! 👀
#Solana #SOL #Crypto #Altcoins #Binance #CryptoTrading #BullishTrend

80
·
--
Bullish
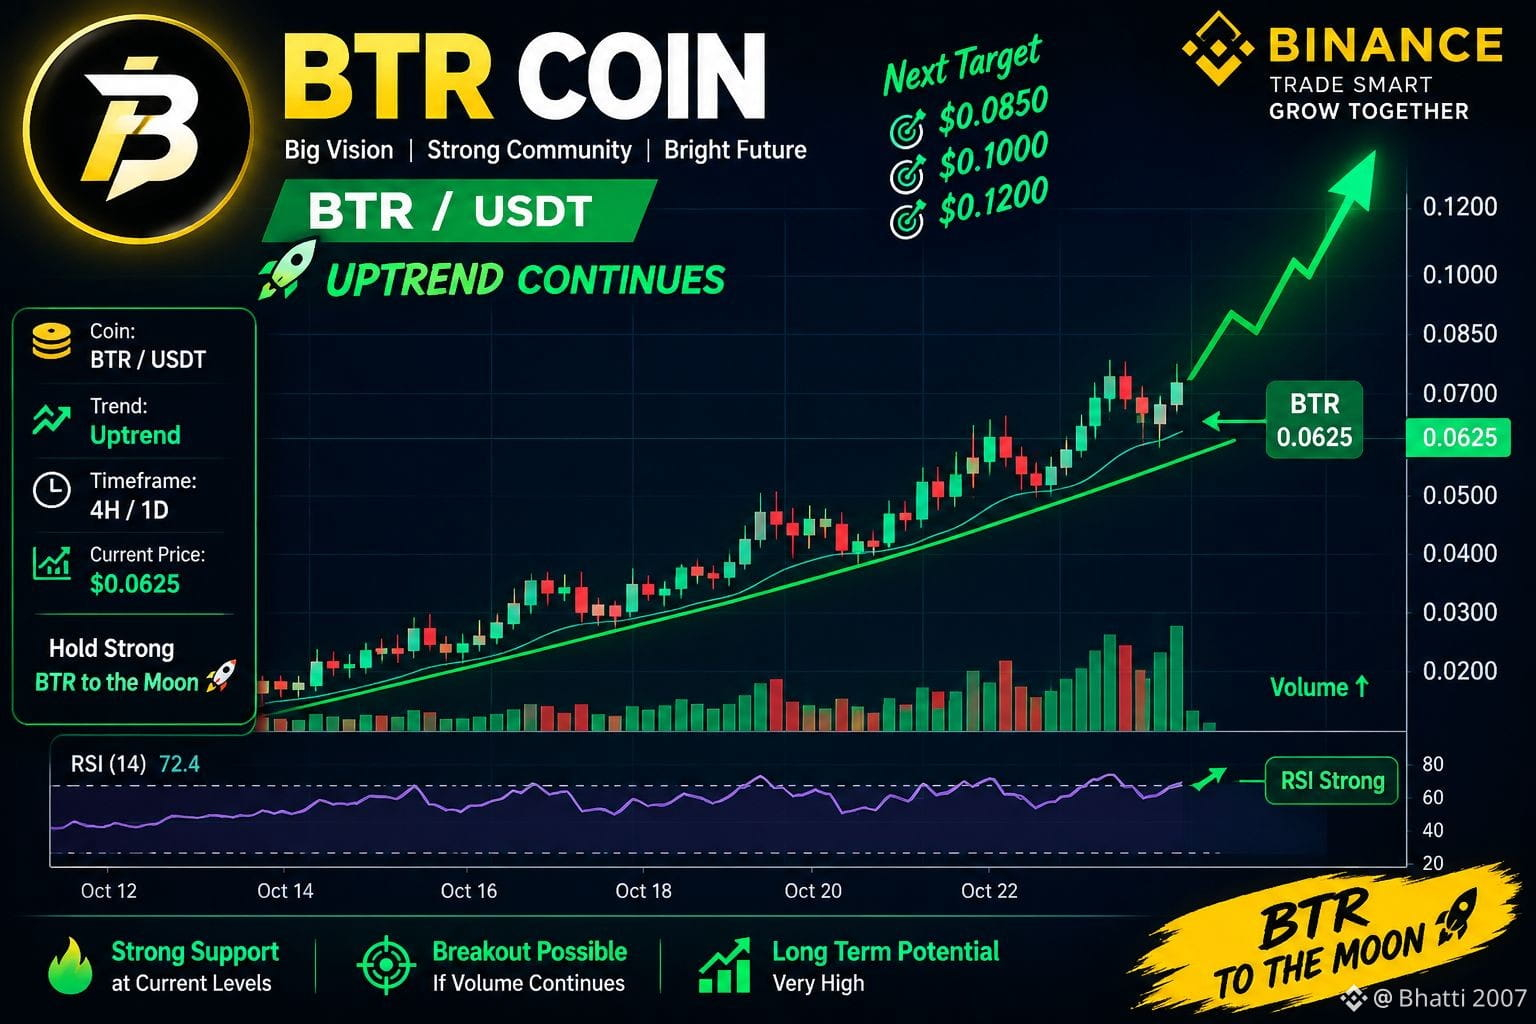
BTR, take a water pot
{alpha}(560xfed13d0c40790220fbde712987079eda1ed75c51)
BTR, take a water pot
200

·
--
Bullish
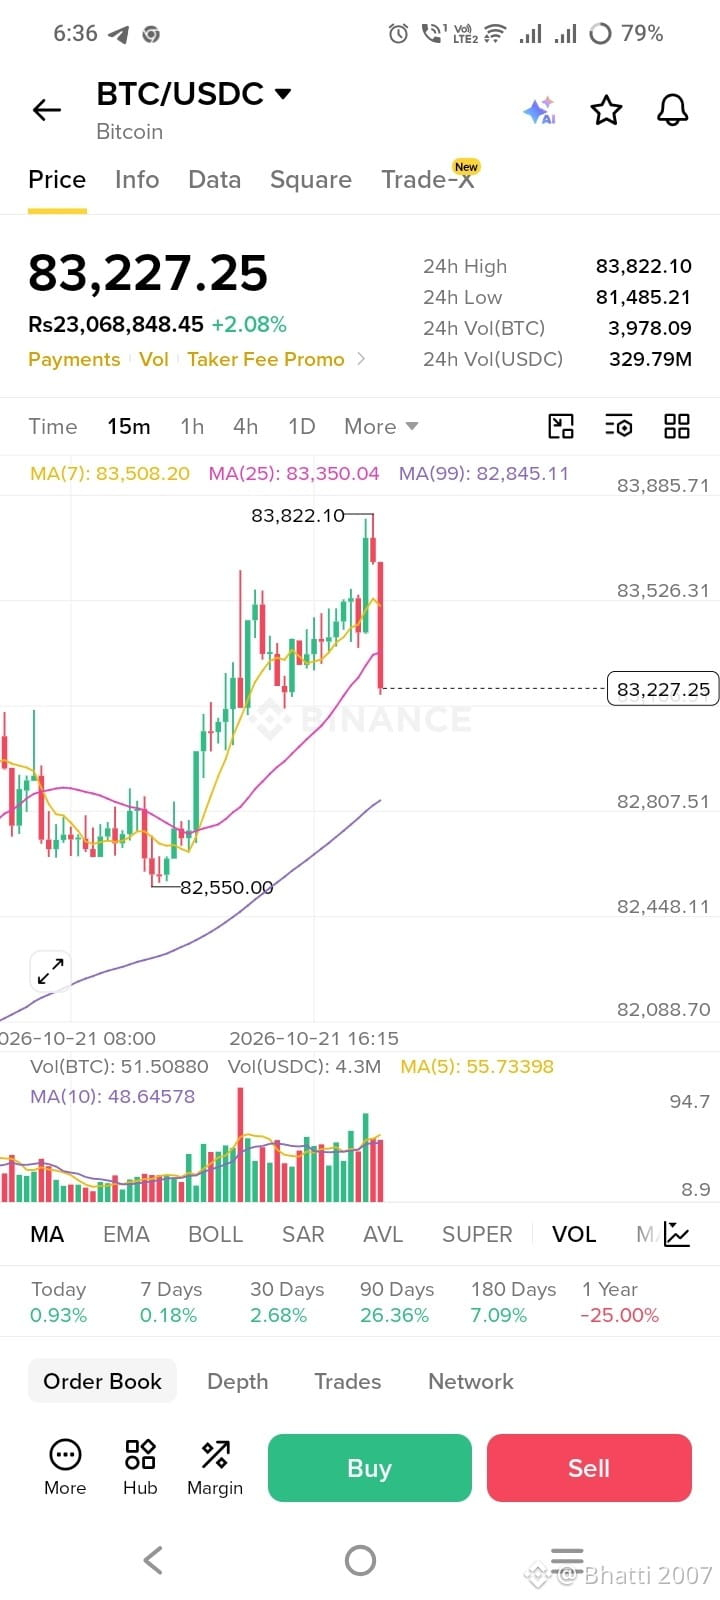
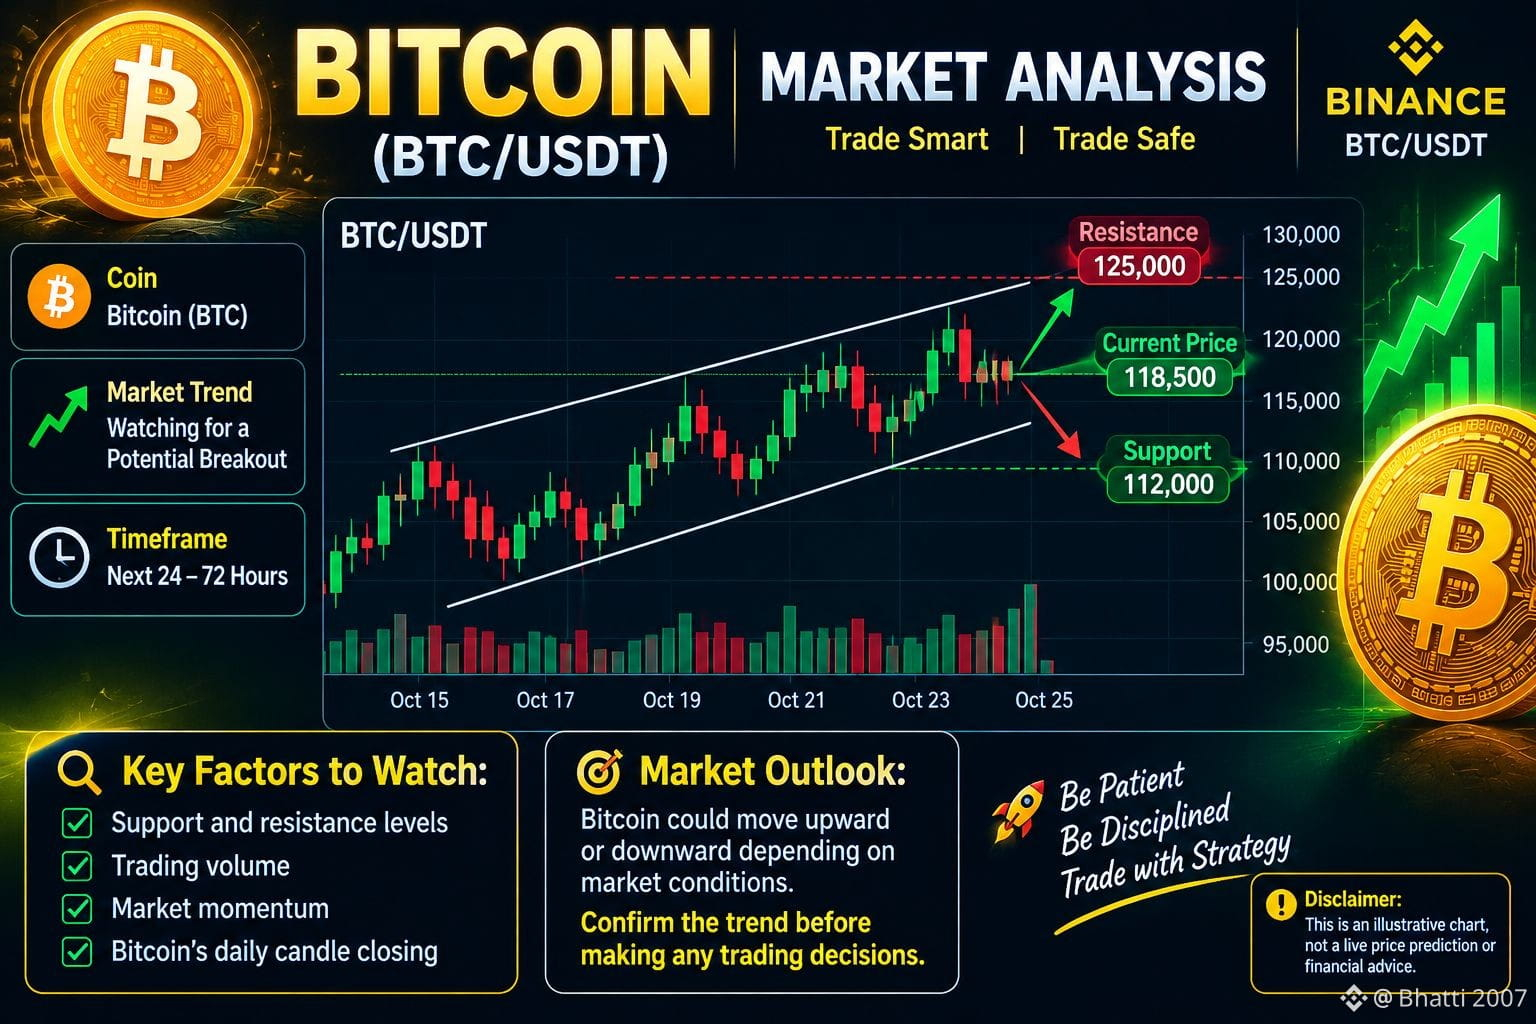
Here's a nice English chart for Bitcoin that you can post on Binance. 📊
{spot}(BTCUSDT)
Here's a nice English chart for Bitcoin that you can post on Binance. 📊
80
·
--
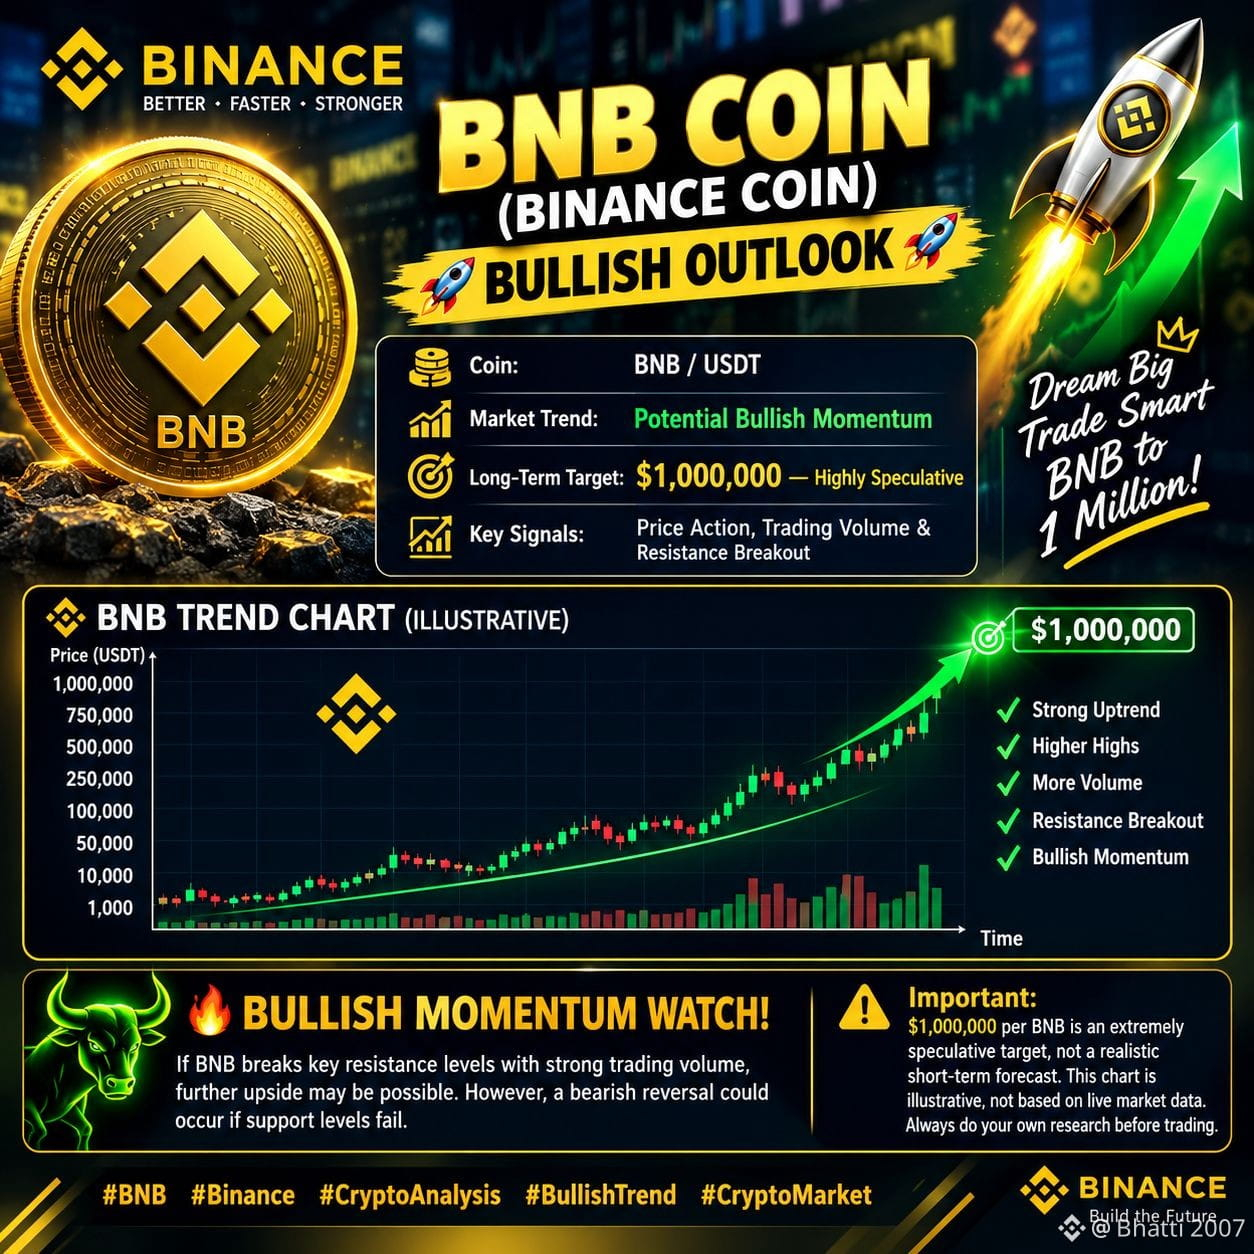
🚀 BNB COIN (BINANCE COIN) — BULLISH OUTLOOK 🚀
🪙 Coin: BNB / USDT
📊 Market Trend: Potential Bullish Momentum
🎯 Long-Term Target: $1,000,000 — Highly Speculative
📈 Key Signals: Price Action, Trading Volume & Resistance Breakout
📊 BNB TREND CHART (ILLUSTRATIVE)
Price │ 🚀 │ ●──── │ ●─── │ ●─── │ ●─── │ ●─── │ ●── └────────────────────────── Time
🔥 BULLISH MOMENTUM WATCH!
If BNB breaks key resistance levels with strong trading volume, further upside may be possible. However, a bearish reversal could occur if support levels fail.
⚠️ Important: $1,000,000 per BNB is an extremely speculative target, not a realistic short-term forecast. This chart is illustrative, not based on live market data. Always do your own research before trading.
#BNB #Binance #CryptoAnalysis #BullishTrend #CryptoMarket
🚀 BNB COIN (BINANCE COIN) — BULLISH OUTLOOK 🚀
🪙 Coin: BNB / USDT
📊 Market Trend: Potential Bullish Momentum
🎯 Long-Term Target: $1,000,000 — Highly Speculative
📈 Key Signals: Price Action, Trading Volume & Resistance Breakout
📊 BNB TREND CHART (ILLUSTRATIVE)
Price │ 🚀 │ ●──── │ ●─── │ ●─── │ ●─── │ ●─── │ ●── └────────────────────────── Time
🔥 BULLISH MOMENTUM WATCH!
If BNB breaks key resistance levels with strong trading volume, further upside may be possible. However, a bearish reversal could occur if support levels fail.
⚠️ Important: $1,000,000 per BNB is an extremely speculative target, not a realistic short-term forecast. This chart is illustrative, not based on live market data. Always do your own research before trading.
#BNB #Binance #CryptoAnalysis #BullishTrend #CryptoMarket
🪙 Coin: BNB / USDT
📊 Market Trend: Potential Bullish Momentum
🎯 Long-Term Target: $1,000,000 — Highly Speculative
📈 Key Signals: Price Action, Trading Volume & Resistance Breakout
📊 BNB TREND CHART (ILLUSTRATIVE)
Price │ 🚀 │ ●──── │ ●─── │ ●─── │ ●─── │ ●─── │ ●── └────────────────────────── Time
🔥 BULLISH MOMENTUM WATCH!
If BNB breaks key resistance levels with strong trading volume, further upside may be possible. However, a bearish reversal could occur if support levels fail.
⚠️ Important: $1,000,000 per BNB is an extremely speculative target, not a realistic short-term forecast. This chart is illustrative, not based on live market data. Always do your own research before trading.
#BNB #Binance #CryptoAnalysis #BullishTrend #CryptoMarket
1
83

·
--
Bullish
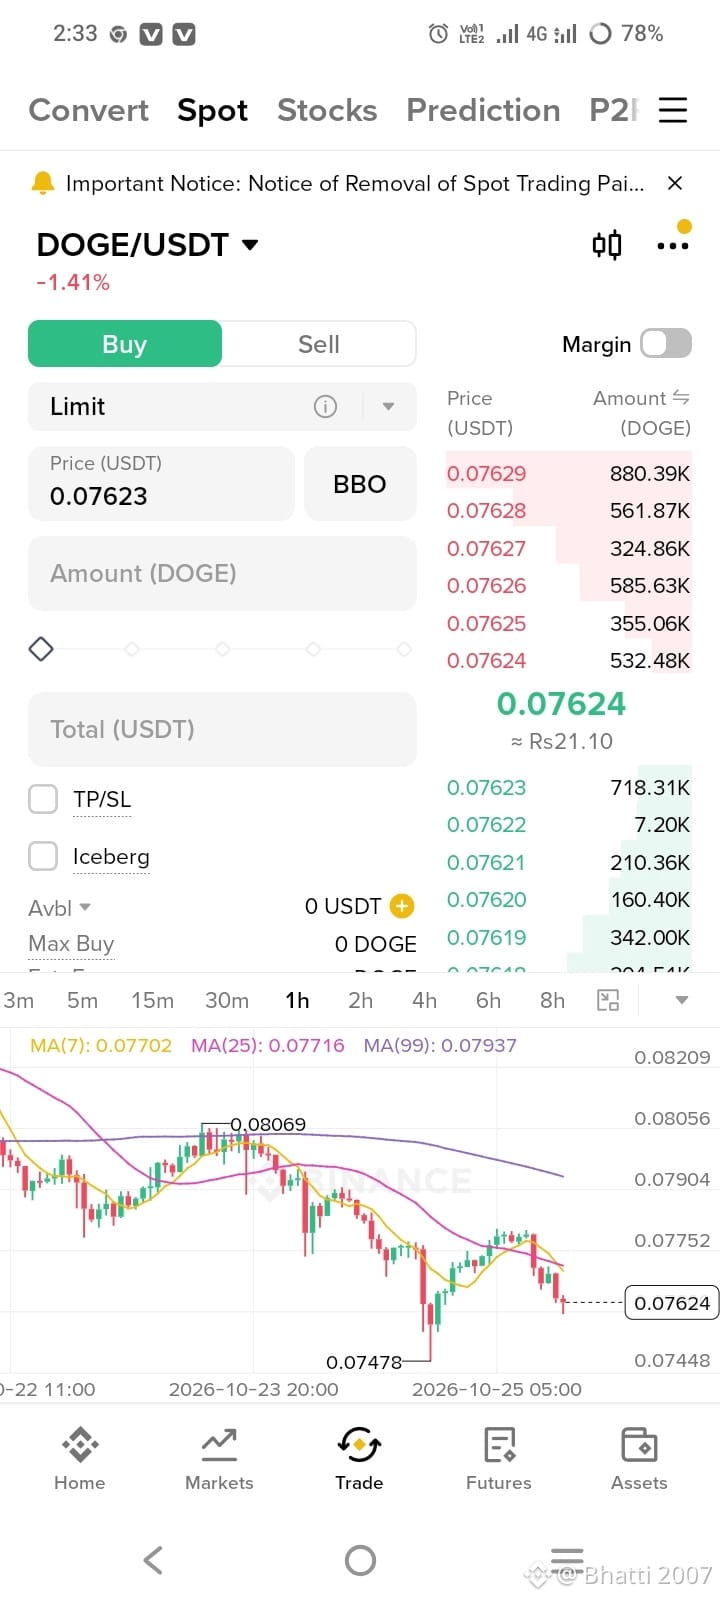
DOGE 🐕 🐕 🐕
{spot}(DOGEUSDT)
🤑🤑🤑🤑🤑🤑🤑🤑Sure, translating it now. Here it is in English, ready to screenshot for Binance
DOGE 🐕 🐕 🐕
🤑🤑🤑🤑🤑🤑🤑🤑Sure, translating it now. Here it is in English, ready to screenshot for Binance
🤑🤑🤑🤑🤑🤑🤑🤑Sure, translating it now. Here it is in English, ready to screenshot for Binance

1
97

Log in to explore more content
Join global crypto users on Binance Square
⚡️ Get latest and useful information about crypto.
💬 Trusted by the world’s largest crypto exchange.
👍 Discover real insights from verified creators.
Email / Phone number
Trending Topics
KeplrAdvisesSocialLoginUsersToTransferAssets
160 views
26 Discussing
🚨 Keplr Wallet Security Update
🔓 Some Google and Apple login wallets were affected by a security breach.
💰 Users' crypto funds may be at risk.$ATOM
🚫 Google and Apple login are temporarily suspended.$OSMO
🛡️ Keplr advises affected users to move their remaining funds to a new secure wallet.
😟 Full recovery of stolen funds is not confirmed yet.$INJ
📢 Important: If you use Google or Apple login for Keplr, secure your funds as soon as possible. 🔐
#KeplrAdvisesSocialLoginUsersToTransferAssets
HamzaEarns
·0 Likes
·17 views
TetherPlans€28.8MForJuventusCapitalIncrease
229 views
26 Discussing
JobsReportRaisesHikeOdds
624,023 views
3,864 Discussing