
Wanli一本万莉168
4k Posts

Wanli一本万莉168
 Square Verified+
Report
Block User
最早广场直播建设者,加密圈学习者,活到老学到老,现布局Web3新赛道。北京时间每天15:00直播,欢迎来直播间一起探讨:共建广场、共建社区。喜欢的可加我币安聊天室:wanli168

BNB Holder
Frequent Trader
2.9 Years
654 Following
88.6K+ Followers
90.8K+ Liked
Posts
All
Quotes
Videos
Live
PINNED
·
--
How much money did this netizen's mom actually make?
How much money did this netizen's mom actually make?

152
91
228.1k
PINNED
·
--
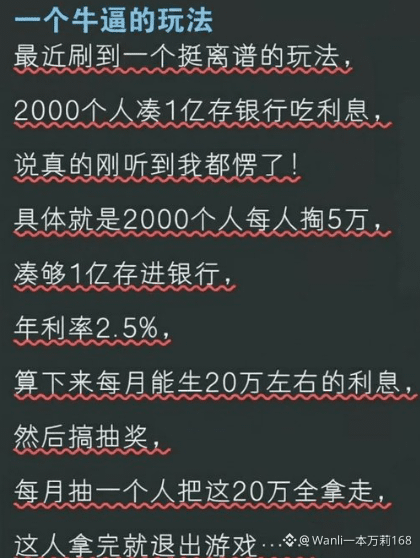
This is seriously awesome!
What genius came up with this way to play?
This is seriously awesome!
What genius came up with this way to play?
What genius came up with this way to play?
101
3
128
269.6k

·
--
One isn't greedy for money, and the other isn't lustful.
One isn't greedy for money, and the other isn't lustful.


4
2
2k
·
--
The real bear isn’t some market manipulator—it’s the dollar. It just moved above its 200-week moving average.
This latest drop has sparked a lot of arguments in the community. Some say a certain platform dumped coins; others say a certain company sold. Honestly, those were just the triggers, not the explosive.
The explosive is the macro picture.
Last week, the U.S. Dollar Index closed at 103.41, above its 200-week moving average at 102.11. This was the first clear weekly close above that line since April 2025. It rose 1.11% in a single week.
That same day, BTC fell below its own 200-week moving average. One crossed up, the other crossed down. We saw this picture once before, at the end of 2021. Veteran traders remember what happened next.
Why is this happening? October CPI came in hot. PPI was up 6.5% year over year, the highest since November 2022. The two-year Treasury yield jumped 35 basis points in a week, its biggest move in more than two years. The 10-year yield closed at 5.15%. The market has now almost fully priced in a rate hike in December.
That’s right—a rate hike, not a cut. When that expectation shifts, global risk assets all have to be repriced. BTC isn’t a safe haven. Right now, it’s a high-beta risk asset. When the dollar strengthens, BTC struggles to breathe.
So stop staring at candlesticks every day, looking for someone to blame. Watch two things: the Dollar Index and the December rate decision.
If the dollar doesn’t turn around and liquidity doesn’t ease, every rally is just a recovery—not a reversal. I’ve said this many times this year, and I’ve been more right each time.
What can you do now? Bring your position down to a level you can sleep with. Don’t use leverage to try to guess the bottom. The real bottom is never guessed—it’s shaped by the macro picture.
I know this isn’t exciting, but people who last in the market don’t make money by chasing excitement.
The real bear isn’t some market manipulator—it’s the dollar. It just moved above its 200-week moving average.
This latest drop has sparked a lot of arguments in the community. Some say a certain platform dumped coins; others say a certain company sold. Honestly, those were just the triggers, not the explosive.
The explosive is the macro picture.
Last week, the U.S. Dollar Index closed at 103.41, above its 200-week moving average at 102.11. This was the first clear weekly close above that line since April 2025. It rose 1.11% in a single week.
That same day, BTC fell below its own 200-week moving average. One crossed up, the other crossed down. We saw this picture once before, at the end of 2021. Veteran traders remember what happened next.
Why is this happening? October CPI came in hot. PPI was up 6.5% year over year, the highest since November 2022. The two-year Treasury yield jumped 35 basis points in a week, its biggest move in more than two years. The 10-year yield closed at 5.15%. The market has now almost fully priced in a rate hike in December.
That’s right—a rate hike, not a cut. When that expectation shifts, global risk assets all have to be repriced. BTC isn’t a safe haven. Right now, it’s a high-beta risk asset. When the dollar strengthens, BTC struggles to breathe.
So stop staring at candlesticks every day, looking for someone to blame. Watch two things: the Dollar Index and the December rate decision.
If the dollar doesn’t turn around and liquidity doesn’t ease, every rally is just a recovery—not a reversal. I’ve said this many times this year, and I’ve been more right each time.
What can you do now? Bring your position down to a level you can sleep with. Don’t use leverage to try to guess the bottom. The real bottom is never guessed—it’s shaped by the macro picture.
I know this isn’t exciting, but people who last in the market don’t make money by chasing excitement.
This latest drop has sparked a lot of arguments in the community. Some say a certain platform dumped coins; others say a certain company sold. Honestly, those were just the triggers, not the explosive.
The explosive is the macro picture.
Last week, the U.S. Dollar Index closed at 103.41, above its 200-week moving average at 102.11. This was the first clear weekly close above that line since April 2025. It rose 1.11% in a single week.
That same day, BTC fell below its own 200-week moving average. One crossed up, the other crossed down. We saw this picture once before, at the end of 2021. Veteran traders remember what happened next.
Why is this happening? October CPI came in hot. PPI was up 6.5% year over year, the highest since November 2022. The two-year Treasury yield jumped 35 basis points in a week, its biggest move in more than two years. The 10-year yield closed at 5.15%. The market has now almost fully priced in a rate hike in December.
That’s right—a rate hike, not a cut. When that expectation shifts, global risk assets all have to be repriced. BTC isn’t a safe haven. Right now, it’s a high-beta risk asset. When the dollar strengthens, BTC struggles to breathe.
So stop staring at candlesticks every day, looking for someone to blame. Watch two things: the Dollar Index and the December rate decision.
If the dollar doesn’t turn around and liquidity doesn’t ease, every rally is just a recovery—not a reversal. I’ve said this many times this year, and I’ve been more right each time.
What can you do now? Bring your position down to a level you can sleep with. Don’t use leverage to try to guess the bottom. The real bottom is never guessed—it’s shaped by the macro picture.
I know this isn’t exciting, but people who last in the market don’t make money by chasing excitement.
BTC-0,72%
IEFETF+0,08%
2
526
·
--
Those who see a horse are left-brained.
Those who see a bird are right-brained.
Those who see a horse are left-brained.
Those who see a bird are right-brained.
Those who see a bird are right-brained.

20
7
7.1k
·
--
I'm curious why so many people have this exact same circular mark on their arms. Does anyone know why???
I'm curious why so many people have this exact same circular mark on their arms. Does anyone know why???

96
45
72k
·
--
Proving you're clean without handing over your customer list: there's a way
The most awkward thing for an institution entering the space is wanting to prove it's clean without handing over its customer list. There are basically two approaches today. One is to give addresses and transaction histories to an on-chain analytics company for scoring, which is equivalent to laying all your cards on the table for a third party. The other is to use a Merkle whitelist, which can only prove that a particular address is in a set—not that the set itself is clean. I tried a third approach using SXT's private data pathway: put the internal list and the public list of restricted addresses into the same set of tables, then have a query return a Boolean value along with a proof. You disclose only the conclusion, not a single record. The potential of this use case is greater than most people think. You could do proof of reserves this way, sanctions screening, or even prove whether a customer's assets meet a certain threshold—all by outputting only a yes-or-no result. The real technical challenge is keeping things current. The list changes every day, so the proof has to be regenerated too; otherwise, you're proving you were clean last week. I learned that the hard way once: I used an old proof to verify a new list, and the contract told me everything was fine. That gave me a chill. After that, I learned to include a hash of the data version in the proof, and to reject it outright if the version doesn't match. The bottleneck isn't cryptography; it's the list itself. Who maintains it, how often it's updated, and whether its update history can be audited—these are operational issues. Get those wrong, and none of the rest matters. And whether the law recognizes cryptographic proofs is still an open question; compliance officers would rather see a stamped report. Compared with Chainlink's proof of reserves, this approach is more flexible: it can run arbitrary SQL, not just sum balances. The trade-off is that you have to take on the engineering work of generating the proofs yourself. I expect RWA and custodial institutions to adopt this first, because what they need most is that layer of assurance that lets them prove things about themselves without disclosing sensitive information. To take it further, you'd need to combine range proofs with aggregation proofs—for example, proving both that total exposure is below a limit and that no single counterparty exceeds its limit. There's no off-the-shelf tool for this yet, so you'd have to build it yourself. Once this layer is running smoothly, institutional sales pitches will change from “Our risk controls are strict” to “You can verify it yourself.” #sxt $SXT @SpaceandTimeDB
Proving you're clean without handing over your customer list: there's a way
The most awkward thing for an institution entering the space is wanting to prove it's clean without handing over its customer list. There are basically two approaches today. One is to give addresses and transaction histories to an on-chain analytics company for scoring, which is equivalent to laying all your cards on the table for a third party. The other is to use a Merkle whitelist, which can only prove that a particular address is in a set—not that the set itself is clean. I tried a third approach using SXT's private data pathway: put the internal list and the public list of restricted addresses into the same set of tables, then have a query return a Boolean value along with a proof. You disclose only the conclusion, not a single record. The potential of this use case is greater than most people think. You could do proof of reserves this way, sanctions screening, or even prove whether a customer's assets meet a certain threshold—all by outputting only a yes-or-no result. The real technical challenge is keeping things current. The list changes every day, so the proof has to be regenerated too; otherwise, you're proving you were clean last week. I learned that the hard way once: I used an old proof to verify a new list, and the contract told me everything was fine. That gave me a chill. After that, I learned to include a hash of the data version in the proof, and to reject it outright if the version doesn't match. The bottleneck isn't cryptography; it's the list itself. Who maintains it, how often it's updated, and whether its update history can be audited—these are operational issues. Get those wrong, and none of the rest matters. And whether the law recognizes cryptographic proofs is still an open question; compliance officers would rather see a stamped report. Compared with Chainlink's proof of reserves, this approach is more flexible: it can run arbitrary SQL, not just sum balances. The trade-off is that you have to take on the engineering work of generating the proofs yourself. I expect RWA and custodial institutions to adopt this first, because what they need most is that layer of assurance that lets them prove things about themselves without disclosing sensitive information. To take it further, you'd need to combine range proofs with aggregation proofs—for example, proving both that total exposure is below a limit and that no single counterparty exceeds its limit. There's no off-the-shelf tool for this yet, so you'd have to build it yourself. Once this layer is running smoothly, institutional sales pitches will change from “Our risk controls are strict” to “You can verify it yourself.” #sxt $SXT @SpaceandTime
The most awkward thing for an institution entering the space is wanting to prove it's clean without handing over its customer list. There are basically two approaches today. One is to give addresses and transaction histories to an on-chain analytics company for scoring, which is equivalent to laying all your cards on the table for a third party. The other is to use a Merkle whitelist, which can only prove that a particular address is in a set—not that the set itself is clean. I tried a third approach using SXT's private data pathway: put the internal list and the public list of restricted addresses into the same set of tables, then have a query return a Boolean value along with a proof. You disclose only the conclusion, not a single record. The potential of this use case is greater than most people think. You could do proof of reserves this way, sanctions screening, or even prove whether a customer's assets meet a certain threshold—all by outputting only a yes-or-no result. The real technical challenge is keeping things current. The list changes every day, so the proof has to be regenerated too; otherwise, you're proving you were clean last week. I learned that the hard way once: I used an old proof to verify a new list, and the contract told me everything was fine. That gave me a chill. After that, I learned to include a hash of the data version in the proof, and to reject it outright if the version doesn't match. The bottleneck isn't cryptography; it's the list itself. Who maintains it, how often it's updated, and whether its update history can be audited—these are operational issues. Get those wrong, and none of the rest matters. And whether the law recognizes cryptographic proofs is still an open question; compliance officers would rather see a stamped report. Compared with Chainlink's proof of reserves, this approach is more flexible: it can run arbitrary SQL, not just sum balances. The trade-off is that you have to take on the engineering work of generating the proofs yourself. I expect RWA and custodial institutions to adopt this first, because what they need most is that layer of assurance that lets them prove things about themselves without disclosing sensitive information. To take it further, you'd need to combine range proofs with aggregation proofs—for example, proving both that total exposure is below a limit and that no single counterparty exceeds its limit. There's no off-the-shelf tool for this yet, so you'd have to build it yourself. Once this layer is running smoothly, institutional sales pitches will change from “Our risk controls are strict” to “You can verify it yourself.” #sxt $SXT @SpaceandTime

1
31
31.4k
·
--
ETH falls below 2,000, but 910,000 ETH are waiting in the staking queue
Ethereum held the 2,000 level for a long time. Today, it broke through.
Current price: 1,989, down 60% from its all-time high of 4,946.
At the same time, what’s happening on-chain is the exact opposite.
The staking rate hit a new all-time high of 36.3%. More than 41 million ETH have been locked in the Beacon Chain, with another 911,938 waiting to enter and 264,211 waiting to exit. Net inflows are about 650,000 ETH. At the current pace, the queue will take more than ten days to clear.
On one side, prices are crashing; on the other, people are rushing to lock up their coins for three years. There’s no contradiction: the people selling aren’t the same people staking.
The sellers are ETFs. Over the past four trading days, spot ETH ETFs saw net outflows of $339 million. Passive investors don’t care about the story; they only look at net asset value.
The stakers are long-term holders. A 36.3% staking rate means the actual circulating supply is shrinking. And the Foundation has proposed setting a 50% cap on the staking rate, with reward issuance to stop if it goes above that. This is a move to protect staking yields.
One more detail: three addresses suspected of being associated with Erik Voorhees bought 23,091 ETH in a single day, spending $47.36 million at an average price of 2,051. They bought into the downturn, not the rebound.
My view: ETH’s problem right now isn’t its narrative; it’s liquidity. It’s one of the highest-beta assets in this risk-asset cycle. When Nvidia sneezes, ETH catches a cold first.
But the record-high staking rate is worth noting. It won’t make the price rise tomorrow, but it could reduce selling pressure during the next rally.
Two things to watch: Can ETH/BTC get back above 0.029? Will the exit queue suddenly swell?
If the exit queue grows from 260,000 to 600,000, that’s when you can call it panic.
ETH falls below 2,000, but 910,000 ETH are waiting in the staking queue
Ethereum held the 2,000 level for a long time. Today, it broke through.
Current price: 1,989, down 60% from its all-time high of 4,946.
At the same time, what’s happening on-chain is the exact opposite.
The staking rate hit a new all-time high of 36.3%. More than 41 million ETH have been locked in the Beacon Chain, with another 911,938 waiting to enter and 264,211 waiting to exit. Net inflows are about 650,000 ETH. At the current pace, the queue will take more than ten days to clear.
On one side, prices are crashing; on the other, people are rushing to lock up their coins for three years. There’s no contradiction: the people selling aren’t the same people staking.
The sellers are ETFs. Over the past four trading days, spot ETH ETFs saw net outflows of $339 million. Passive investors don’t care about the story; they only look at net asset value.
The stakers are long-term holders. A 36.3% staking rate means the actual circulating supply is shrinking. And the Foundation has proposed setting a 50% cap on the staking rate, with reward issuance to stop if it goes above that. This is a move to protect staking yields.
One more detail: three addresses suspected of being associated with Erik Voorhees bought 23,091 ETH in a single day, spending $47.36 million at an average price of 2,051. They bought into the downturn, not the rebound.
My view: ETH’s problem right now isn’t its narrative; it’s liquidity. It’s one of the highest-beta assets in this risk-asset cycle. When Nvidia sneezes, ETH catches a cold first.
But the record-high staking rate is worth noting. It won’t make the price rise tomorrow, but it could reduce selling pressure during the next rally.
Two things to watch: Can ETH/BTC get back above 0.029? Will the exit queue suddenly swell?
If the exit queue grows from 260,000 to 600,000, that’s when you can call it panic.
Ethereum held the 2,000 level for a long time. Today, it broke through.
Current price: 1,989, down 60% from its all-time high of 4,946.
At the same time, what’s happening on-chain is the exact opposite.
The staking rate hit a new all-time high of 36.3%. More than 41 million ETH have been locked in the Beacon Chain, with another 911,938 waiting to enter and 264,211 waiting to exit. Net inflows are about 650,000 ETH. At the current pace, the queue will take more than ten days to clear.
On one side, prices are crashing; on the other, people are rushing to lock up their coins for three years. There’s no contradiction: the people selling aren’t the same people staking.
The sellers are ETFs. Over the past four trading days, spot ETH ETFs saw net outflows of $339 million. Passive investors don’t care about the story; they only look at net asset value.
The stakers are long-term holders. A 36.3% staking rate means the actual circulating supply is shrinking. And the Foundation has proposed setting a 50% cap on the staking rate, with reward issuance to stop if it goes above that. This is a move to protect staking yields.
One more detail: three addresses suspected of being associated with Erik Voorhees bought 23,091 ETH in a single day, spending $47.36 million at an average price of 2,051. They bought into the downturn, not the rebound.
My view: ETH’s problem right now isn’t its narrative; it’s liquidity. It’s one of the highest-beta assets in this risk-asset cycle. When Nvidia sneezes, ETH catches a cold first.
But the record-high staking rate is worth noting. It won’t make the price rise tomorrow, but it could reduce selling pressure during the next rally.
Two things to watch: Can ETH/BTC get back above 0.029? Will the exit queue suddenly swell?
If the exit queue grows from 260,000 to 600,000, that’s when you can call it panic.
1
5
16.8k
·
--
Jensen Huang has really let loose, switching up his style.
Jensen Huang has really let loose, switching up his style.


5
24
15.8k

·
--
Trump Media made $410 million, but it can’t spend a penny of it
Third-quarter net income was $409.7 million, compared with a $54.8 million loss in the same period last year
Don’t rush to say they’ve turned things around. Almost all of that $410 million came from non-cash revaluation of digital assets. Adjusted EBITDA was a loss of $12.3 million. The company holds 15,649 BTC, worth about $1.17 billion at today’s price of $74,770
Understand this structure and you’ll understand companies like this: their income statements are essentially amplifiers of Bitcoin’s price. When crypto rises, book profits explode; when it falls, book losses explode. It has very little to do with how well their social media platform is doing
That’s also why the financial reports of treasury companies always seem so strange. Revaluation gains can be booked as profit without a penny of cash flow, but dividends, buybacks, and interest payments all require real money
For traders, there are two useful takeaways. Financial reports are lagging indicators: they reflect crypto prices last quarter, not today’s. BTC has fallen from 126,080 to 74,770, a 40% drawdown. The direction of next quarter’s revaluation is already written. The impressive profit you see now is in the past
What you should really watch isn’t net income—it’s whether the company starts selling its coins. When a company that holds crypto announces a sale, that news always tells you more than its financial report
Trump Media made $410 million, but it can’t spend a penny of it
Third-quarter net income was $409.7 million, compared with a $54.8 million loss in the same period last year
Don’t rush to say they’ve turned things around. Almost all of that $410 million came from non-cash revaluation of digital assets. Adjusted EBITDA was a loss of $12.3 million. The company holds 15,649 BTC, worth about $1.17 billion at today’s price of $74,770
Understand this structure and you’ll understand companies like this: their income statements are essentially amplifiers of Bitcoin’s price. When crypto rises, book profits explode; when it falls, book losses explode. It has very little to do with how well their social media platform is doing
That’s also why the financial reports of treasury companies always seem so strange. Revaluation gains can be booked as profit without a penny of cash flow, but dividends, buybacks, and interest payments all require real money
For traders, there are two useful takeaways. Financial reports are lagging indicators: they reflect crypto prices last quarter, not today’s. BTC has fallen from 126,080 to 74,770, a 40% drawdown. The direction of next quarter’s revaluation is already written. The impressive profit you see now is in the past
What you should really watch isn’t net income—it’s whether the company starts selling its coins. When a company that holds crypto announces a sale, that news always tells you more than its financial report
Third-quarter net income was $409.7 million, compared with a $54.8 million loss in the same period last year
Don’t rush to say they’ve turned things around. Almost all of that $410 million came from non-cash revaluation of digital assets. Adjusted EBITDA was a loss of $12.3 million. The company holds 15,649 BTC, worth about $1.17 billion at today’s price of $74,770
Understand this structure and you’ll understand companies like this: their income statements are essentially amplifiers of Bitcoin’s price. When crypto rises, book profits explode; when it falls, book losses explode. It has very little to do with how well their social media platform is doing
That’s also why the financial reports of treasury companies always seem so strange. Revaluation gains can be booked as profit without a penny of cash flow, but dividends, buybacks, and interest payments all require real money
For traders, there are two useful takeaways. Financial reports are lagging indicators: they reflect crypto prices last quarter, not today’s. BTC has fallen from 126,080 to 74,770, a 40% drawdown. The direction of next quarter’s revaluation is already written. The impressive profit you see now is in the past
What you should really watch isn’t net income—it’s whether the company starts selling its coins. When a company that holds crypto announces a sale, that news always tells you more than its financial report
4
495
·
--
Learn from other people’s bosses—they’re pretty smart, huh?
Learn from other people’s bosses—they’re pretty smart, huh?


4
13
8.1k
·
--
The boss said there’s a meeting at noon, so this is the lunch I ordered.
The boss will praise me when they get back, right?
😎
The boss said there’s a meeting at noon, so this is the lunch I ordered.
The boss will praise me when they get back, right?
😎
The boss will praise me when they get back, right?
😎

6
14
6.9k
·
--
ETH at 2,246. Someone is quietly accumulating—and they know exactly what they’re doing.
ETH is now at 2,246, with an intraday low of 2,211. It looks weak on the surface: nearly $300 million in long positions were liquidated over the past 48 hours.
But the spot market tells a completely different story.
Over the past few hours, two addresses bought a combined 18,500 ETH, worth about $42.2 million.
One of them, 0x32c6, spent 19.7 million USDT to buy 8,773.5 ETH at an average price of 2,245. Its holdings have now reached 23,097 ETH, with an estimated cost basis of around 1,909. The last time this wallet bought this aggressively was five months ago.
The other, 0x4AB7, withdrew 9,777 ETH directly from an exchange to its own wallet. Not withdrawing coins is trading; withdrawing them is holding. Those are two completely different things.
There’s an even more aggressive player: a trader who claims to be on a ten-trade winning streak opened a roughly $4.53 billion notional long position on 20,277 ETH using 25x leverage. The position is already up $250,000. Their first 10 trades were all winners, for a cumulative profit of $6.32 million.
Some are calling for a bullish move, but the real risk lies below.
If ETH falls below 2,130, the cumulative long-liquidation exposure across major centralized exchanges is $901 million. That’s a minefield—and once ETH enters it, things could move fast.
My view: ETH is forming a bottom, but it hasn’t bottomed out yet.
What’s the difference? Forming a bottom means testing the level repeatedly; a bottom is a one-time reversal. Clearly, we’re seeing the former.
So scale into your position in layers: 2,200 to 2,250 is the first tranche, and keep a second tranche in reserve above 2,130. If 2,130 breaks, don’t buy the dip—let the market find its own footing.
First, watch 2,420, the previous high. Only a move above it would signal a structural reversal.
ETH at 2,246. Someone is quietly accumulating—and they know exactly what they’re doing.
ETH is now at 2,246, with an intraday low of 2,211. It looks weak on the surface: nearly $300 million in long positions were liquidated over the past 48 hours.
But the spot market tells a completely different story.
Over the past few hours, two addresses bought a combined 18,500 ETH, worth about $42.2 million.
One of them, 0x32c6, spent 19.7 million USDT to buy 8,773.5 ETH at an average price of 2,245. Its holdings have now reached 23,097 ETH, with an estimated cost basis of around 1,909. The last time this wallet bought this aggressively was five months ago.
The other, 0x4AB7, withdrew 9,777 ETH directly from an exchange to its own wallet. Not withdrawing coins is trading; withdrawing them is holding. Those are two completely different things.
There’s an even more aggressive player: a trader who claims to be on a ten-trade winning streak opened a roughly $4.53 billion notional long position on 20,277 ETH using 25x leverage. The position is already up $250,000. Their first 10 trades were all winners, for a cumulative profit of $6.32 million.
Some are calling for a bullish move, but the real risk lies below.
If ETH falls below 2,130, the cumulative long-liquidation exposure across major centralized exchanges is $901 million. That’s a minefield—and once ETH enters it, things could move fast.
My view: ETH is forming a bottom, but it hasn’t bottomed out yet.
What’s the difference? Forming a bottom means testing the level repeatedly; a bottom is a one-time reversal. Clearly, we’re seeing the former.
So scale into your position in layers: 2,200 to 2,250 is the first tranche, and keep a second tranche in reserve above 2,130. If 2,130 breaks, don’t buy the dip—let the market find its own footing.
First, watch 2,420, the previous high. Only a move above it would signal a structural reversal.
ETH is now at 2,246, with an intraday low of 2,211. It looks weak on the surface: nearly $300 million in long positions were liquidated over the past 48 hours.
But the spot market tells a completely different story.
Over the past few hours, two addresses bought a combined 18,500 ETH, worth about $42.2 million.
One of them, 0x32c6, spent 19.7 million USDT to buy 8,773.5 ETH at an average price of 2,245. Its holdings have now reached 23,097 ETH, with an estimated cost basis of around 1,909. The last time this wallet bought this aggressively was five months ago.
The other, 0x4AB7, withdrew 9,777 ETH directly from an exchange to its own wallet. Not withdrawing coins is trading; withdrawing them is holding. Those are two completely different things.
There’s an even more aggressive player: a trader who claims to be on a ten-trade winning streak opened a roughly $4.53 billion notional long position on 20,277 ETH using 25x leverage. The position is already up $250,000. Their first 10 trades were all winners, for a cumulative profit of $6.32 million.
Some are calling for a bullish move, but the real risk lies below.
If ETH falls below 2,130, the cumulative long-liquidation exposure across major centralized exchanges is $901 million. That’s a minefield—and once ETH enters it, things could move fast.
My view: ETH is forming a bottom, but it hasn’t bottomed out yet.
What’s the difference? Forming a bottom means testing the level repeatedly; a bottom is a one-time reversal. Clearly, we’re seeing the former.
So scale into your position in layers: 2,200 to 2,250 is the first tranche, and keep a second tranche in reserve above 2,130. If 2,130 breaks, don’t buy the dip—let the market find its own footing.
First, watch 2,420, the previous high. Only a move above it would signal a structural reversal.
1
4
1.4k
·
--
The Sunology trend has made its way into Web2 after all.
The Sunology trend has made its way into Web2 after all.

4
518
·
--
Damn! Everyone else says it’s awesome, but how come I still can’t understand it after staring at it for ages?
Damn! Everyone else says it’s awesome, but how come I still can’t understand it after staring at it for ages?

1
3
588

·
--
Bitcoin at 77,658: Is the bull market over? Here are some hard truths
On October 6 last year, BTC hit an all-time high of 126,080. Today, it's at 77,658—a 38% pullback.
Yesterday, U.S. spot Bitcoin ETFs saw $643 million in net outflows. More than $430 million in long positions were liquidated over the past week, yet open interest is rising. What does that mean? Leverage hasn't gone away; it's just a new batch of people carrying it.
But here's what I want to say: this downturn didn't start in crypto.
On October 30, the Nasdaq 100 fell 3.2%, and Intel plunged 29.6% in a single day after its earnings bombed. Google, Amazon, and Intel all reported results below expectations. For the first time, the AI trade faced serious scrutiny. That same day, oil rose on Middle East tensions while gold fell. That's a classic "liquidity squeeze" combination, not a "narrative collapse."
So don't use the halving cycle to explain everything. BTC in 2026 is already a macro asset. Its correlation with the Nasdaq is much stronger than with the "four-year cycle."
Three numbers to watch on the charts: 76,000—that's the support level tested repeatedly on October 30. 74,800—if it breaks below this level, the next target is the 70,000 round number. 81,915—BTC needs to get back above this level for the structure to count as repaired.
And don't forget this date: November 6, the U.S. jobs report. This data will directly determine whether rates get cut again in December. The market right now isn't afraid of hackers; it's afraid that "money is getting more expensive."
My position strategy is simple: between 75,000 and 82,000, I won't guess the direction—I'll just trade the range. If it breaks below 74,000, I'll reduce my position, not add to it. If it really gets back above 85,000, then the trend is back, and we can talk about going on the attack.
Is the bull market over? I don't know. But I do know that at these levels, it's not about conviction—it's about position management.
Bitcoin at 77,658: Is the bull market over? Here are some hard truths
On October 6 last year, BTC hit an all-time high of 126,080. Today, it's at 77,658—a 38% pullback.
Yesterday, U.S. spot Bitcoin ETFs saw $643 million in net outflows. More than $430 million in long positions were liquidated over the past week, yet open interest is rising. What does that mean? Leverage hasn't gone away; it's just a new batch of people carrying it.
But here's what I want to say: this downturn didn't start in crypto.
On October 30, the Nasdaq 100 fell 3.2%, and Intel plunged 29.6% in a single day after its earnings bombed. Google, Amazon, and Intel all reported results below expectations. For the first time, the AI trade faced serious scrutiny. That same day, oil rose on Middle East tensions while gold fell. That's a classic "liquidity squeeze" combination, not a "narrative collapse."
So don't use the halving cycle to explain everything. BTC in 2026 is already a macro asset. Its correlation with the Nasdaq is much stronger than with the "four-year cycle."
Three numbers to watch on the charts: 76,000—that's the support level tested repeatedly on October 30. 74,800—if it breaks below this level, the next target is the 70,000 round number. 81,915—BTC needs to get back above this level for the structure to count as repaired.
And don't forget this date: November 6, the U.S. jobs report. This data will directly determine whether rates get cut again in December. The market right now isn't afraid of hackers; it's afraid that "money is getting more expensive."
My position strategy is simple: between 75,000 and 82,000, I won't guess the direction—I'll just trade the range. If it breaks below 74,000, I'll reduce my position, not add to it. If it really gets back above 85,000, then the trend is back, and we can talk about going on the attack.
Is the bull market over? I don't know. But I do know that at these levels, it's not about conviction—it's about position management.
On October 6 last year, BTC hit an all-time high of 126,080. Today, it's at 77,658—a 38% pullback.
Yesterday, U.S. spot Bitcoin ETFs saw $643 million in net outflows. More than $430 million in long positions were liquidated over the past week, yet open interest is rising. What does that mean? Leverage hasn't gone away; it's just a new batch of people carrying it.
But here's what I want to say: this downturn didn't start in crypto.
On October 30, the Nasdaq 100 fell 3.2%, and Intel plunged 29.6% in a single day after its earnings bombed. Google, Amazon, and Intel all reported results below expectations. For the first time, the AI trade faced serious scrutiny. That same day, oil rose on Middle East tensions while gold fell. That's a classic "liquidity squeeze" combination, not a "narrative collapse."
So don't use the halving cycle to explain everything. BTC in 2026 is already a macro asset. Its correlation with the Nasdaq is much stronger than with the "four-year cycle."
Three numbers to watch on the charts: 76,000—that's the support level tested repeatedly on October 30. 74,800—if it breaks below this level, the next target is the 70,000 round number. 81,915—BTC needs to get back above this level for the structure to count as repaired.
And don't forget this date: November 6, the U.S. jobs report. This data will directly determine whether rates get cut again in December. The market right now isn't afraid of hackers; it's afraid that "money is getting more expensive."
My position strategy is simple: between 75,000 and 82,000, I won't guess the direction—I'll just trade the range. If it breaks below 74,000, I'll reduce my position, not add to it. If it really gets back above 85,000, then the trend is back, and we can talk about going on the attack.
Is the bull market over? I don't know. But I do know that at these levels, it's not about conviction—it's about position management.
4
328
·
--
You can get posted on the campus page just for offering a girl your seat, because she thought you were a narcissistic guy trying to hit on her?
So who’s the narcissist here?
Also, isn’t there any moderation on this page? How can they just let people incite online harassment and hostility like this?!
You can get posted on the campus page just for offering a girl your seat, because she thought you were a narcissistic guy trying to hit on her?
So who’s the narcissist here?
Also, isn’t there any moderation on this page? How can they just let people incite online harassment and hostility like this?!
So who’s the narcissist here?
Also, isn’t there any moderation on this page? How can they just let people incite online harassment and hostility like this?!

3
627
Log in to explore more content
Join global crypto users on Binance Square
⚡️ Get latest and useful information about crypto.
💬 Trusted by the world’s largest crypto exchange.
👍 Discover real insights from verified creators.
Email / Phone number
Trending Topics
NvidiaBeatsEstimatesWith$130BQ4Outlook
2,178 views
46 Discussing
Nvidia Beats With $115.8 Billion in Revenue, Guides to $130 Billion and Adds $150 Billion Buyback
Binance News
·25 Likes
·30.4k views
AnthropicIPOPriceCouldExceed$80
5,694 views
53 Discussing
CanNvidia’sDataCenterGrowthContinue?
12,262 views
225 Discussing